Effects of Chronic Heat or Cold Exposure on Growth and Blood Pressure in Rats
Katsuhiko TSUCHIYA* and Akihiro TAlMURA*
Abstract: We studied the effects of various environmental temperatures on growth and blood pressure in rats. Spontaneously hypertensive rats (SHR) and their mother strain, normotensive Wistar-Kyoto rats (WKY) were used as the experimental animal. Rats of the two strains, SHR and WKY of 1 month old were divided into three groups randomly and they were housed in three rooms, of which temperatures were controlled at a constant, 30°C (H-group), 22-24°C (N-group) and 10°C (C-group), respectively.
Effects of environmental temperature on body weight gain were studied. Growth retardation was observed in the H-group of both strains. Maximal body weight gains were higher and reduced more quickly in SHR compared to those in WKY In both SHR and WKY, at approximately 4 months old, the ratio of the tail to body surface areas was in the order ofH-group > N-group > C-group in both strains.
Systolic blood pressure (BP) was measured by the tail cuff method at approximately 4 months old.
In WK~ BP in the C-group was significantly higher than that in H-group. In SHR, the BPs ofthe three groups were high compared to those in WKY groups, to which rats were exposed since 1 month old.
And the BPs ofC-group and H-group were significantly high compared to that in N-group.
These facts indicate that effects of environmental temperature, to which rats were exposed since 1 month old, on growth were similar in WKY and SHR, and that the effects of the environmental temperature on systemic BP are clear in normotensive WK~ whereas in SHR, genetic expression of the hypertensive phenotype is consistent at various environmental temperatures.
Key Words: Environmental temperature, Wistar-Kyoto-rats (WKY), Spontaneously hypertensive rats (SHR), Growth
INTRODUCTION
There are many studies on the effects of environmental stress on growth and physiological conditions. The effects of chronic exposure to various environmental temperatures on the physiological conditions in rats have been reported.
Cold-induced hypertension in rats was reported by Fregly et al. (1989).
* Department of Natural Environmental Conserveation, Faculty of Environmental Studies, Nagasaki University, Nagasaki 852-8521, Japan
Received 26 April 2006 Accepted 8 August 2006
Global warming is increasing, mainly due to industrial activities. A high environmental temper- ature may have severe effects in various fields including human health.
This study investigated animal models to indicate the
effect of increased environmental temperature on the
health of humans and other species. Experimental
animal models for genetic hypertension, spontane-
ously hypertensive rats (SHR) and the mother strain,
normotensive Wistar-Kyoto rats (WKY) were
introduced (Okamoto & Aoki, 1963). These SHR
rats were known as a genetically hypertensive rats,
the hypertension is consistently developed with
aging. It is interesting whether a development of
genetic hypertension is modified or not by the
4 0 0 - r - - - , 4 0 0 - . - - - ,
4 5
(months old)
4 5
(months old)
3 3
2 2
O~-_.._-____,r__-_.__-__r-___I
o
O~-__._-___.--_r__-~-___I
o
§
1::OJ .~ 200>.
"C
dl
300
100
B----fr-
N-group: 22-24·C (n=8)SHR
~ C-group: 10·C (n=7) 100
§
1::OJ·iii 3= 200
~
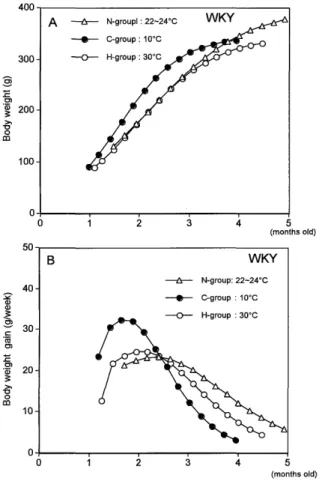
lD 300N-group and the C-group. In WK~ mean BW at near 4 months (M) old was 343±28 g in the C-group (n=10; 3.9M), 338±9g in the N-group (n=5; 4.0M) and 319±8 g in the H-group (n=5; 4.0M). There were no significant differences among these values.
In SHR, the mean value ofBW at 4 months old was 335±25 g in the C-group (n=7: 4.0 M), 346±21 gin the N-group (n=8; 4.0 M) and 310±16 g in the H-group (n=8; 4.0 M). The value of the H-group was significantly lower than those of the Nand C groups (P < 0.05).
Fig. 1. Mean body weight ofWKY (A) and SHR (B) exposed to the three different environmental temperatures, C-group (solid circles, WKY;n=lO, SHR;n=7), N-group (open triangles, WKY;n=5, SHR;n=8 ), and H-group (open circles WKY;n=5, SHR;n=8).
A
--t:r- N-group: 22-24·C (n=5)
exposure to the various environmental temperatures.
The effects of chronic exposure to various temperatures on growth and the development of hypertension were studied in WKY and SHR.
METHOD
Male WKY and SHR were introduced from the breeding company (Charles River, Japan). Rats ofthe two strains, SHR and WKY of 1 month old were divided into three groups randomly and they were housed in three rooms, of which temperatures were controlled at a constant, 30°C (H-group), 22-24°C (N-group) and 10°C (C-group), respectively.
In one plastic cage, 3 or 4 rats were kept with wood shavings under a 12/12-hour light-dark cycle (light on 7:00-19:00) with food (F-2, Funahashi, Japan) and water ad libitum. The body weights (BW) of rats were measured using a balance every week.
The predicted growth curves were obtained by fitting values of BW to the logistic function (Y=a1{I +b exp(-cX)}, where Y is predicted BW, X is months from birth. a, band c are constant). From these fitting curves, mean weight gain per week was calculated.
At approximately 4 months old, the systolic blood pressure (BP) of rats was measured by the tail cuff method (PE-300, NARCO, USA) after the general warming, which induced tail vasodilation. In order to evaluate the tail surface area by calculation, assuming that the cross section of any portion of the rat tail is an exact circle, the entire length of the tail, from the anus to the tip of the tail, and the diameter at every 3 cm of the tail were measured using a slide caliper. Calculated body surface area was obtained by the equation, S = 8.62 x BW 0.67 (S: total surface area (cm 2 ), BW: body weight(g), Lyzak & Hunter, 1987).
Values were expressed as Mean±S.D.. Statistical significance of change in parameters was determined Kruskal-Wallis test (Stat View 5.0, SAS Institute Inc.).
RESULTS
Body weight and body weight gain
The mean body weights (BW) of the three groups in WKY and SHR were plotted against time (month) after birth in Fig. I-A, B. One-group was composed of 5-10 rats. As shown in Fig. 1, growth curves of SHR were steeper in comparison with those ofWKY.
And in both strains, WKY and SHR, the growth curves of the H-groups were under than those of the
Fitting curves of BW to the logistic equation in WKYare shown Fig.2-A. From these fitting curves, the mean weight gain per week was calculated (Fig.
2-B). In WK~ maximal values of weight gain are
within the range of 1.5-2.5 months old. Maximal
values of weight gain were 32.4 g/week in the
C-group, 23.3 g/week in the N-group and 24.7
g/week in the H-group. Figure 3-A and B shows the
fitting curves of BW and weight gain of SHR,
4 0 0 - . - - - .
respectively. In SHR, maximal values of weight gain are in the range of I.S-2 months old, the value of weight gain at the peak was 39.7 g/week in the C-group, 42.3 g/week in the N-group, and 32.0 g/week in the H-group.
Curves ofthe weight gain in SHR were higher in the maximal zone, and thereafter those curves reduced more quickly than those ofthe WKY groups.
300 :§
E
Cl 'iii;: 200
>-
"0 IIIo
100
A
----t::r- N-groupl :22-24'CSHR
Fig. 2. Fitting curves of mean body weight to the logistic equation (A) and weight gains of the three rats groups ofWKY (B).
2
3 45
(months old)
WKY
----t::r- N-group:22-24'C
-e-
e-group :10'C4 5
(months old)
3 2
2
3 45
(months old)
SHR
---ft- N-group :22-24'C
-e-
e-group:10'C---0-- H-group :30'C
0
0 50
B 40 2'
<ll<ll
~
c:30
'ro
ClE
Cl20
~
10
0 0
Tail growth
The body surface area of the rats was calculated by means of the equation, and the tail surface was also calculated by the diameter measured in each 3 cm of the tail from the anus to the tip of the tail.
In WKY, the ratio of the tail surface to the body surface area was 7.9 +0.3 % in the C-group (n=10), 8.S+0.4% in the N-group (n=10), and 8.9+0.2% in the H-group (n=S), (Fig. 4-A). In SHR, the ratio was 7.0+0.1% in the C-group (n=7), 8.1 +0.4 % in the N-group (n=8), and 9.0+0.3% in the H-group (n=8), (Fig. 4-B). In both strains, these values were significantly different (P < 0.01, or P < O.OS only between N-group and H-group in WKY) from each other. Both in WKY and SHR, mean values of the ratio ofthe tail surface to the body surface areas were in the order ofH-group > N-group > C- group.
Fig. 3. Fitting curves of mean body weight to the logistic equation (A) and weight gains (B) of the three rats groups of SHR.
5 (months old)
4
3 20
0 50
B 2' 40
Q) Q)
~
-9
c:30 'ro
ClE
Cl20
'iii;:
>-
"0 0 III
10
0 0 400
A
300 :§
ECl 'iii;:
200
>-
"0 III0
100
T
WKY
n=4
4.1M
* *
" ' - 1
~---'I
" ' - 1- - - . ,SH R
T
o-L..J... L.--
B
A
200
~ E 150 ,S
~ ~ 100
!/)
~0-
"0
ii5 o 50
200
~
~100
!/)
~
0-"0
ii5 o 50
o-L....I... L--
three groups of SHR, hypertension developed. Mean values of BP in both C-group and H-group were significantly (P<0.05) higher than that in the N-group.
n=5
4.0M
n=8
4.0M
* ,J WKY
T
II
T
**
**
**
** ,..-...*... *---, I SHR
1--"";";;";';;---'11 +
B
~ 10.0
lU~ lU
~ 7.5
::J
!/)
>-
"0
~ 5.0
-
lU~lU
~ 2.5
~
::J!/)
~ O.O..L-II... --I---
~ 10.0
lU
~lU
~ 7.5
::J
!/)
>-
"0
~ 5.0
-
lU~lU
~ 2.5
~
::J!/)