representation in motor cortex deep output layer
Author Qian Li, Ho Ko, Zhong‑Ming Qian, Leo Y. C.
Yan, Danny C. W. Chan, Gordon Arbuthnott, Ya Ke, Wing‑Ho Yung
journal or
publication title
Nature Communications
volume 8
page range 15834
year 2017‑06‑09
Publisher Springer Nature
Rights (C) 2017 The Author(s).
Author's flag publisher
URL http://id.nii.ac.jp/1394/00000262/
doi: info:doi/10.1038/ncomms15834
Creative Commons Attribution 4.0 International
(http://creativecommons.org/licenses/by/4.0/)
Received 29 May 2016 | Accepted 26 Apr 2017 | Published 9 Jun 2017
Refinement of learned skilled movement
representation in motor cortex deep output layer
Qian Li 1, * , w , Ho Ko 2,3,4,5, *, Zhong-Ming Qian 6 , Leo Y.C. Yan 1,4 , Danny C.W. Chan 1,4 , Gordon Arbuthnott 7 , Ya Ke 1,4,5 & Wing-Ho Yung 1,4,5
The mechanisms underlying the emergence of learned motor skill representation in primary motor cortex (M1) are not well understood. Specifically, how motor representation in the deep output layer 5b (L5b) is shaped by motor learning remains virtually unknown. In rats undergoing motor skill training, we detect a subpopulation of task-recruited L5b neurons that not only become more movement-encoding, but their activities are also more structured and temporally aligned to motor execution with a timescale of refinement in tens-of-milliseconds.
Field potentials evoked at L5b in vivo exhibit persistent long-term potentiation (LTP) that parallels motor performance. Intracortical dopamine denervation impairs motor learning, and disrupts the LTP profile as well as the emergent neurodynamical properties of task-recruited L5b neurons. Thus, dopamine-dependent recruitment of L5b neuronal ensembles via synaptic reorganization may allow the motor cortex to generate more temporally structured, movement-encoding output signal from M1 to downstream circuitry that drives increased uniformity and precision of movement during motor learning.
DOI: 10.1038/ncomms15834 OPEN
1
School of Biomedical Sciences, Faculty of Medicine, The Chinese University of Hong Kong, Hong Kong, China.
2Department of Medicine and Therapeutics, Faculty of Medicine, The Chinese University of Hong Kong, Hong Kong, China.
3Li Ka Shing Institute of Health Sciences, Faculty of Medicine, The Chinese University of Hong Kong, Hong Kong, China.
4Gerald Choa Neuroscience Centre, Faculty of Medicine, The Chinese University of Hong Kong, Hong Kong, China.
5Chow Yuk Ho Technology Center for Innovative Medicine, Faculty of Medicine, The Chinese University of Hong Kong, Hong Kong, China.
6Laboratory of Neuropharmacology, School of Pharmacy, Fudan University, Shanghai 201203, China.
7Okinawa Institute of Science and Technology Graduate University, Okinawa, Japan 904-0495. * These authors contributed equally to this work. w Present address: Cold Spring Harbor Laboratory, 1 Bungtown Road, Cold Spring Harbor, New York 11724, USA. Correspondence and requests for materials should be addressed to Y.K. (email: [email protected]) or to W.-H.Y. (email:
[email protected]).
T he capability to learn novel, complex motor skills is a remarkable ability of human and many other mammals.
Although multiple extracortical brain areas, notably the cerebellum and the basal ganglia, contribute to motor learning 1 , it has been argued that the primary motor cortex (M1) is ideally suited not only for the execution of movement but also the acquisition and storage of motor memory 2 . Recent finding also highlights the essential role of the motor cortex in tutoring subcortical motor circuits in acquiring motor skills 3 . M1 neurons are known to comprise a functionally heterogeneous population, encoding distinct motor parameters such as direction, velocity, position and muscle activity 4–10 , while jointly they may constitute a pattern generator to encode for the large diversity of possible movements 11 . The motor representations of individual neurons and neuronal ensembles in M1 are not static, exhibiting adaptation to task requirements, as well as improved coding and predictability of behavioural outcomes with motor learning 12–17 .
M1 circuitry exhibits interlaminar specificity. Layer 2/3 (L2/3) provides excitatory input to layer 5a (L5a) and layer 5b (L5b), while L5a also relays feedforward excitatory drive to L5b (refs 18–21). Functional imaging in animals undergoing motor training demonstrated that M1 L2/3 neurons consist of functionally distinct types with different sensory, motor and decision correlates during motor task which are modulated by learning 22,23 . In the forelimb area of M1, after repeated lever-manipulation task L2/3 neurons exhibit more reproducible population activity in relation to motor execution 24 . Interestingly, L2/3 neurons retain similar predictability of motor outcome during training of lever-press task, while L5a neurons become progressively recruited for the task and a substantial proportion of neurons become more predictive of lever trajectory after motor training 25 . However, it remains unknown, how these learning induced reorganizations of neuronal coding in L2/3 and L5a are eventually conveyed to and reflected in the motor representation of the output layer L5b, which is beyond the reach of optical functional imaging techniques (for example, two-photon microscopy) due to its depth. Previous studies showed that M1 neurons encode movement parameters with temporal leads or lags on the order of tens to hundreds of milliseconds 5,8,9,26,27 ; however, how these temporal dynamics in motor representation in M1 change with learning remains virtually unknown.
It has been suggested that reorganization of both the interlaminar and intrinsic horizontal connections in M1 underlies learning-induced plasticity of motor representation. Great insight has been provided by recent in vivo imaging studies of the motor cortex, which revealed rapid changes in spine dynamics on the apical dendrites of L5 neurons within the first few hours 28–30 . These findings suggest a crucial role of long lasting synapse remodelling and connectivity reorganization in the formation as well as consolidation of motor memory. Electrophysiological studies, on the other hand, have revealed that motor skill training could strengthen horizontal connections in the superficial layers 1–3 of the motor cortex, manifested as an increase in local field potentials (FPs) evoked in cortical slices studied in vitro 31,32 . However, up to now, physiologically induced long-term potentiation (LTP) during motor skill learning has not been demonstrated convincingly and tracked in vivo in the motor cortex.
To probe the process of motor learning and the refinement of motor representation by L5b, we performed a longitudinal study by chronic recording of single-unit activities from M1 in rats performing repetitive motor skill task up to 7 days. We elucidated the fine-scale temporal dynamics of single neuron and population activities from ensembles of L5b neurons, as well as the maintenance of training-induced synaptic plasticity in vivo. We also interrogated the process by examining the effect of depleting
dopamine, the neuromodulator that has been consistently implicated in different types of cortical plasticity and learning 33–35 .
Results
In vivo recordings in L5b during forelimb-reaching training.
To investigate the temporal dynamics of single-neuron and population activities in L5b during motor learning, food-restric- ted rats (n ¼ 9) were trained with a forelimb reaching and grasping task for 7 consecutive days (Fig. 1a, Supplementary Movies 1 and 2, left panel), with simultaneous multi-channel single-unit recordings at L5b of the forelimb territory in M1 (Supplementary Fig. 1a). To acquire the largest possible samples of neurons per animal, we employed 16-channel microwire array for recording from neuronal ensembles. Data were included for analyses only if correct targeting of electrodes at L5b was verified by post-mortem histological reconstruction of the recording sites, based on that L5b is distinct from neighbouring L5a and layer 6 (L6) with a denser VGlut2 immunoreactivity and larger neuronal soma size 36–38 (Supplementary Fig. 1a,b; see Supplementary Fig. 1c for all reconstructed recording sites from one animal).
Furthermore, to provide enough single-unit data from the same animal for neuronal population analyses, we only included rats from which more than 20 single-units were recorded in L5b (see Supplementary Fig. 1d,e for the locations of all the recording sites included for analyses).
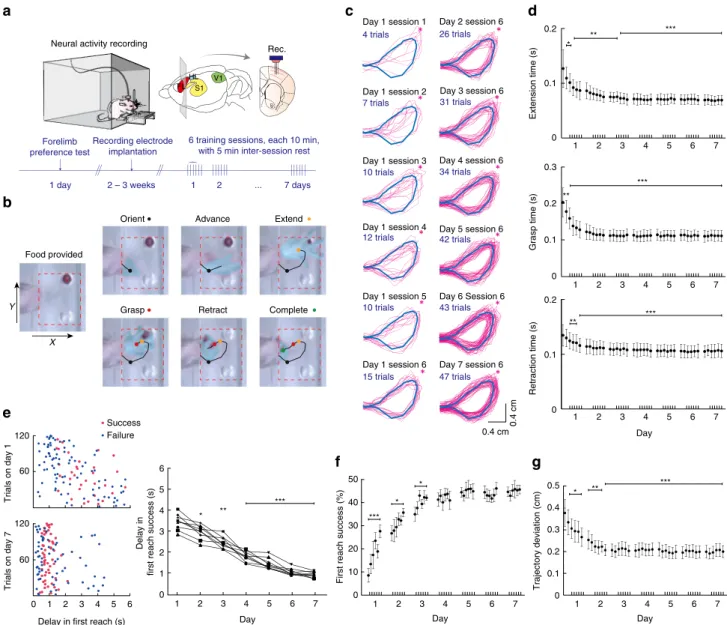
Each animal received six 10-min training sessions per day, with 5-min rest intervals between sessions. The reaching attempts involved a coordinated motor sequence consisting of different phases: orienting, advancing, extending, grasping, retracting and completion (Fig. 1b, see Methods for definition of each phase), resulting in trackable forepaw trajectories (Fig. 1c). Over days of training, the extension time, grasp time and retraction time of individual first reach success trials (defined as trials during which the animal completed the reaching attempt and consumed the food pellet successfully on the first reaching attempt) exhibited progressive decrease and became less variable from trial to trial, especially over the first 2 days of training and then became steady (Fig. 1d). In addition, rats responded to the provision of food with progressively shorter and less variable delays in first reach success trials (Fig. 1e). We also observed the largest increase in the proportion of first reach success trials during the first 3 days, both within and across days, which levelled off from day 4 (Fig. 1f, mean ± s.e.m. of first reach success rate: day 1 session 1:
8.7 ± 3.0% versus session 6: 28.2 ± 2.8%, P ¼ 2.03 10 4 ; day 2 session 1: 27.3 ± 3.4% versus session 6: 36.4 ± 1.8%, P ¼ 0.020; day 3 session 1: 35.7 ± 3.1% versus session 6: 42.9 ± 1.2%, P ¼ 0.037;
day 4 session 1: 42.1 ± 2.9% versus session 6: 41.8 ± 4.0%, P ¼ 0.913; day 7 session 1: 45.6 ± 2.1% versus session 6:
46.6 ± 1.1%, P ¼ 0.659; one-way repeated measures ANOVA, 9 rats). Notably, the acquired motor skill memory was retained overnight. Improved skillfulness was also reflected in increased spatial uniformity of forepaw movement trajectory, especially during first reach success trials in the first 2 days of training, as both the average and variance of deviation from the reference expert trajectory (computed from the average of 50 randomly selected first success trials from day 7 session 6, see Fig. 1c and Methods) decreased significantly (Fig. 1g).
Long-term stability of chronic single-unit recordings in L5b.
To study the properties of motor skill representation during the
7-day training process, it was critical that only well-separated
units that exhibited long-term stability were included for further
analyses. We validated the stability of single-unit tracking by
comparison against standard tetrode recordings. The quality of
single-unit isolation was assessed by computing quantitative
measures of cluster quality, from both 16-channel microwire array and tetrodes. Specifically, the criteria for single-unit are: signal-to-noise ratio44, isolation distance (ID) 39 Z 15, L-ratior0.2 (refs 40,41–43), and a clear refractory period revealed by both inter-spike interval (ISI) distribution and auto- correlograms with 99.5% of events with ISI42 ms (microwire array: Fig. 2a–c, Supplementary Fig. 2a–c; tetrode: Supplementary Fig. 2d–f, see Methods).
To determine whether a unit was stable and represented correct tracking of the same neuron over consecutive days, we computed four criterion scores: maximum time-shifted linear correlation coefficient of spike waveform (Max r, Fig. 2d), normalized spike peak-to-peak amplitude difference (DP
amp), dissimilarity score for inter-spike interval histogram (ISIH), and dissimilarity score for autocorrelation histogram 44–47 (see Methods). We fitted Gaussian mixture model to distributions
Rec.
S1 V1 FL
HL
2 – 3 weeks 1
6 training sessions, each 10 min, with 5 min inter-session rest Forelimb
preference test
Recording electrode implantation
1 day
a
Neural activity recording
f
e
SuccessFailure
Trials on day 1
120
60
b
0 1 2 3 4 5 6
120
60
Delay in first reach (s)
Trials on day 7
c
0 1 2 3 4 6
1 2 3 4 5 6 7
Day Delay in first reach success (s)
5
1 2 5 7
50
First reach success (%)
10 20 30 40
3 4 6
0
Day
***
*
* Retract
Advance Extend
Complete Grasp
Orient
* Food provided
X Y
Day 1 session 1 4 trials
1 2 5 7
0.2
Extension time (s)
0.1
3 4 6
0
1 2 5 7
0.3
Grasp time (s) 0.1
3 4 6
0 0.2
Trajectory deviation (cm)
Day 2 session 6 26 trials
Day 3 session 6 31 trials
Day 4 session 6 34 trials
42 trials Day 5 session 6
Day 6 Session 6 43 trials
Day 1 session 6 15 trials Day 1 session 5 10 trials Day 1 session 3 10 trials Day 1 session 2 7 trials
Day 1 session 4 12 trials
Day 7 session 6 47 trials
d
0.4 cm 0.4 cm
g
1 2 5 7
0.2
Retraction time (s)
0.1
3 4 6
0
Day
*
** ***
**
***
**
***
*
1 2 5 7
0.4
3 4 6
0
Day 0.5
0.2 0.1
** ***
0.3
* **
***
7 days ...
2
Figure 1 | Forelimb reaching for food training and simultaneous recording from L5b neurons in M1. (a) Schematics of experimental paradigm. Neural activities in L5b were recorded during forelimb food-reaching task training over 7 days by multi-channel recording electrode array (Rec.). FL and HL:
forelimb and hindlimb territories of M1; S1: primary somatosensory cortex; V1: primary visual cortex. (b) Six phases of a first reach success trial captured by camera and the forelimb trajectory tracked automatically (see Methods). (c) The evolution of more uniform forelimb trajectories (pink) in first reach success trials. The reference expert trajectory is shown in blue colour. Red asterisk denotes the position of food pellet. (d) The duration of forelimb extension (upper panel), grasping (middle panel) and retraction (lower panel) in first reach success trials. The timing of reaching action shortened significantly in day 1 and exhibited further decrease in day 2 and 3, and remained steady thereafter. Mean ± s.d. *Po0.05; **Po0.01; ***Po0.001, one-way repeated measures ANOVA, n ¼ 9. (e) Left, delay in first reach attempt quantified by the time interval between food provision and the ‘orient’ position of forelimb on days 1 and 7 (120 consecutive trials each from a single representative rat). Right, learning associated shortening in the delay in first reach success attempt. Mean ± s.d. of delay in first reach success trials: day 1: 3.44 ± 0.37 s; day 7: 0.96 ± 0.14 s, P ¼ 2.51 10
6; *Po0.05; **Po0.01;
***P o 0.001, all compared with day 1; one-way ANOVA, 9 rats; first reach failure trials: day 1: 2.31±1.55 s; day 7: 1.45±1.20 s, P ¼ 0.012; one-way ANOVA,
9 rats. (f) Training-dependent improvement in first reach success rate (see text). (g) Evaluation of forelimb trajectory spatial variance as the averaged
distance integrated over time between the actual trajectories in first reach success trials (pink) and the reference expert trajectory (blue) shown in d. Mean
cumulative Euclidean distance ± s.d., day 1 session 1: 0.375 ± 0.061 cm; day 1 session 6: 0.265 ± 0.042 cm, P ¼ 0.0173; day 2 session 1: 0.252 ± 0.041 cm,
P ¼ 0.0052; day 2 session 6: 0.205±0.026 cm, P ¼ 7.85 10
4; *P o 0.05; **P o 0.01; ***P o 0.001, all compared to day 1 session 1, one-way repeated
measures ANOVA, n ¼ 9.
of combinations of the criteria and employed quadratic discriminant analysis to obtain optimal decision boundary for classification of recordings that correspond to the same or distinct neuron (Fig. 2e, Supplementary Fig. 2g,h; see Methods for
details). We chose the Max r–ISIH dissimilarity score joint distribution as the optimal discrimination model because these were the two most informative features that gave the lowest Bayesian information criterion (BIC) and Akaike information
Max r (z scored)
a b
c
Day 1
Day 4 Day 2
Day 3
Day 5
Day 6
Day 7 PC2 PC1
PC3
PC1
PC2 Time
Time (ms) –100
–100
–1 Log (ISI) (ms)
9
F = 15.59 J3 = 10.33 DB = 0.26 Dn = 2.62
F = 15.72 J3 = 9.96 DB = 0.26 Dn = 2.70
F = 15.36 J3 = 10.54 DB = 0.27 Dn = 2.60
F = 14.06 J3 =10.10 DB = 0.25 Dn =2.66
F = 15.26 J3 = 10.23 DB = 0.25 Dn = 2.58
F = 16.32 J3 = 9.68 DB = 0.25 Dn = 2.53
F = 14.40 J3 = 9.90 DB = 0.25 Dn = 2.47 Unit 1 Unit 2 Unit 3 Unit 4
200 20 μV μs
1 2 3 4 5 6 7
Day 0
0.15
L-ratio
0.1
0.05
Day
ID
0 150
1 2 3 4 5 6 7
100
50
f
x Unit 1 day 1 Unit 1 day 7
x Unit 4 day 1 Unit 4 day 7
Max r = 0.998
Max r = 0.783 200 μs
20 μV
1 2 3 4 5
4 3 2 1 0 0
3
2
1
00 1 2 3 4 5
Same neuron Distinct neuron
3
2
1
0
1 2 3 4
0
1 2 4 5
3
0
1 2 3
0
d
g
1 2 3 4 5 6 7
5 4
2 1 0 3
ISIH score (–log)
1 2 3 4 5 6 7
5 4
2 1 0 3
Autocorr score (–log)
1 2 3 4 5 6 7
Day 3
2
1
0
Day
1 2 3 4 5 6 7
2 6
4
0
ISIH score (log) Autocorr score (–log)
ISIH score (–log)
Autocorr score (–log)
Autocorr score (–log)
e
ΔPamp(–log) ΔPamp(–log)
Max r (z scored)
Max r (z scored)
100 0
100 0
–100 0 100
criterion (AIC) (see Methods). We classified 158 single units as stable tracking of the same cells through 7 days (see Supplementary Fig. 2i for estimated cumulative false positive and negative rates; also see Methods). 47 units from microwire array recording and 16 units from tetrode recordings disappeared into background or occurred in transit thus failed to be tracked over 7 days. Sorting quality (microwire array, Fig. 2f;
tetrodes, Supplementary Fig. 2j) and tracking stability (microwire array, Fig. 2g; tetrodes, Supplementary Fig. 2k) for all included single-units remained stable throughout the 7 training days. We therefore concluded that, in our experiments, the single-unit tracking performance of microwire array recordings was comparable to that of tetrode recordings.
Diversity in single neuron dynamics in L5b during learning.
The 158 L5b neurons, collected from 61 channels on microwire arrays from five out of nine rats included for analyses, were classified putatively as either pyramidal neurons (PNs, 131/158) or interneurons (INs, 27/158) based on their electrophysiological properties (Supplementary Fig. 3a–c). On the first day of experiments, we invariably observed a spectrum of activities of these neurons, with some clearly showing firing correlated with forelimb displacement and velocity and others that were less correlated. Analysis of single neuron dynamics revealed that 10.7% (14/131) of PNs exhibited reaching-correlated firing as shown in their peri-event time histograms (PETH) (Fig. 3a,b, neuron A) which were temporally aligned to the ‘orient’ position (see Methods and Fig. 1b). This reaching-correlated firing property did not change with training (see Supplementary Fig. 4a,b for further examples). On the other hand, 44.3%
(58/131) PNs’ activities initially had no or little correlation with reaching execution, but with learning, their activities also became temporally aligned to forelimb movement with either increase (37/58, Fig. 3a,b, neuron B, also see Supplementary Fig. 4c,d for further examples) or decrease in firing (21/58, Supplementary Fig. 4e,f for further examples). There were also 45.0% (59/131) of PNs whose peri-event firing changes did not reach statistical significance despite training (Fig. 3a,b, neuron C). These results suggest that the firing characteristics of a subpopulation of L5b neurons are not static, but progressively change with motor learning.
Fine-temporal scale refinement of skilled movement encoding.
Previous studies demonstrated increased information content of M1 neuronal firing about motor output in monkeys 15 as well as M1 L5a neurons in rodents 25 with motor learning, while the time
scale at which firing–motor output relationship may be altered remains elusive. Having observed L5b PNs with diverse behavioural correlates, we next investigated the modulation of peri-task execution firing and information content by motor learning in these individual L5b PNs, as well as the time scale of the changes. We computed the mutual information between single-unit instantaneous firing rate and forelimb instantaneous velocity as a function of different time lags (t, ranging from 500 to þ 500 ms, with t40 meaning firing precedes instantaneous movement, Supplementary Fig. 5a), and obtained the optimal time lag (t
opt.) for each neuron, defined as the value of t at which the mutual information attains maximum (I
M).
Hierarchical clustering of single neuron over the 7 days (Fig. 3c for PNs; Fig. 3d for INs) and analyses of the associated changes in t
opt.(Fig. 3e) confirmed sub-groups of PNs that responded differently to training. Of all 131 PNs analysed, one subgroup (named Type 1 neurons, including neuron A in Fig. 3a,b, 14/131 or 10.7% of PNs from five rats) showed robust I
Mregardless of the day of training (Fig. 3c, Type 1, see Supplementary Fig. 5b for neurons from one representative rat) and had constant t
opt.(Fig. 3e, left panel). For these type 1 neurons, a rapid increase in I
Mand relatively constant t
opt.was already apparent on the first training day (Supplementary Fig. 5c, neuron A and ex. 2; Supplementary Fig. 5d,e, Type 1). Thus, they carried robust information about forelimb movement velocity right from the beginning of, and throughout motor training. In contrast, another subgroup of PNs (named Type 2 neurons, including neuron B in Fig. 3a,b, 61/131 or 46.6% of PNs from five rats) exhibited progressive increase in I
Mof different degrees (Fig. 3c, Type 2; see Supplementary Fig. 5b for neurons from one rat), and interestingly, was always associated with a reduction in t
opt.after the first training day (59/61 of type 2 PNs exhibited reduction in t
opt.on day 7 versus day 1; mean change of t
opt.± s.d. ¼ 84.2 ± 70.5 ms, or 37.3% reduction, Po10 5 , paired t-test, Fig. 3e, middle panel). During the first training day, increase in I
Mfor Type 2 neurons was already evident and t
opt.emerged from random to exhibiting consistent values (Supple- mentary Fig. 5c, neuron B, Supplementary Fig. 5d,e, Type 2). The remaining PNs (named Type 3 neurons, including neuron C in Fig. 3a,b, 56/131 or 42.7% of PNs from five rats) had insignificant I
M(Fig. 3c, Type 3; see Supplementary Fig. 5b for neurons from one rat) and scattered t
opt.throughout training (Fig. 3e, right panel).
Consistent with these observations, analysis of single neuron activity revealed that, after training, type 2 PNs exhibited earlier changes in PETH, demonstrated by a shortening in time until divergence (mean ± s.d. of time until divergence, day 1 session 6:
265.12 ± 85.58 ms, day 7 session 6: 173.13 ± 71.98 ms, Po10 5 , paired t-test, Supplementary Fig. 5f, see Methods). Statistical
Figure 2 | Spike sorting and assessment of long-term stability of single-unit recordings by single microwire array over 7 days. (a) Example of spike
sorting from single microwire array in 7 days, showing the superimposed spike waveforms (upper panel) and the inter-spike-interval histogram (ISIH, lower
panel), and the corresponding identified clusters in the PCs space (far right panel). Clear isolation of units from a given recording channel is indicated by
high, F statistic of MANOVA (F), J3, Dunn validity (Dn) and low Davis-Bouldin (DB) index (see Methods). Note the excluded unit in red, whose spike
waveforms changed cross days, and had shifted ISI histogram and cluster location in PCs. (b) Long-term stability of identified single-units shown in a over 7
days. The unit shown in red with drifting of cluster was excluded. (c) Autocorrelograms of the three isolated units and their cross-correlogram (white). The
presence of refractory periods in the auto-correlograms and absence of refractoriness in the cross-correlogram indicated spikes with clusters marked in
yellow, green and blue were generated by three distinct neurons. The short latency sharp peak in the cross-correlogram (arrow) between the putative
pyramidal neuron (yellow, reference of the cross-correlogram) and the interneuron (green) may indicate mono-synaptic activation. (d) Example of units
exhibiting stable (top, unit 1 in a) or unstable (bottom, unit 4 in a) spike waveform are shown in d. (e) Gaussian mixture distributions fitted to combinations
of the four similarity scores (see Methods) computed from spikes recorded from same neuron (black dots, representing true positive values computed
using recording acquired in difference sessions on the same day, see Methods) or distinct ones (grey dots, computed from recordings from different
channels simultaneously) on the same day corresponding contours: 50% (red), 95% (blue), 99.9% (orange), 99.97% (black) of the distribution. Red and
blues crosses represented recordings classified as stably corresponding to the same or arising from distinct neurons respectively, based on combining the
use of multiple similarity scores with quadratic classifiers (green lines). (f) Cross-day stability of single-unit isolation quality assessed by L-ratio and
isolation distance (n ¼ 158 included units shown in red in e). (g) Cross-day stability of four cluster similarity scores (n ¼ 158 included units shown in
red in e, day 1 session 1 recordings were used as reference).
a
56 success trials 80 failure trials
Day 1 Day 7
−1 0 2.5
Day 1 Day 7
Z score
0
Success Failure 2.5
–1 −1
0 2.5
b
Day 1
Neuron A Neuron B Neuron C
1 0 –1 3 4
2
−1 0 2.5
Z score –2 0 2
–4
–6
Time (s)
–1 1
–5 –3 –2 0 2
–4
–6
Time (s)
–1 1
–5 –3 –2 0
–4
–6
Time (s)
–1 1
–5 –3 –2 0
–4
–6
Time (s)
–1 1
–5 –3 –2 0
–4
–6
Time (s)
–1 1
–5 –3 –2 0
–4
–6
Time (s)
–1 1
–5 –3
FL velocity FL velocity
Day 7
−1 0 2.5
0 2.5
−1
Day
7 6 5 4 3 2 1
c
Euclidean distance
1.5
d
7 6 5 4 3 2 1 0.5
IM (bit x10–1)
e
0
Type 1 7
1 Normal fit Mean = 50.1 ms SD = 116.2 ms N = 14
Normal fit Mean = 48.8 ms SD = 115.6 ms N = 14
7 1
–400 0 500
–400 500
0
opt.on day 7( ms) No. of neuron No. of neuron
DayEuclidean distance
Type 3 Normal fit Mean = 44.6 ms SD = 189.8 ms N = 56
Normal fit Mean = 43.5 ms SD = 189.7 ms N = 56 7
1
7 1
–400 0 500
–400 500
0
No. of neuron No. of neuron
IN 1.2
Type 2
Normal fit Mean = 144.8 ms SD = 66.4 ms N = 61 Mean = 282.1 ms SD = 106.1 ms N = 61 7
1
7 1
–400 0 500
–400 500
0
No. of neuron No. of neuron
‘Type 2’
‘Type 3’
‘Type 2’ ‘Type 3’
‘Type 1’
–2 0 2
–4
Time (s)
–1 1
–5 –3
–6 –2 0 2
–4
–6
Time (s)
–1 1
–5 –3 –2 0
–4
Time (s)
–1 1
–5 –3
–6 –2 0
–4
–6
Time (s)
–1 1
–5 –3 –2 0
–4
Time (s)
–1 1
–5 –3
–6 –2 0
–4
–6
Time (s)
–1 1
–5 –3
Forelimb ‘orient’
Food provided
PN
Normal fit
Neuron A Neuron B Neuron C
–
opt. on day 1 (ms) opt. on day 1 (ms)
opt.on day 7 (ms) opt.on day 7 (ms) opt.on day 7 (ms) opt.on day 7 (ms) opt.on day 7 (ms)
opt. on day 1 (ms) opt. on day 1 (ms) opt. on day 1 (ms)
opt. on day 1 (ms)
Figure 3 | Fine-temporal scale refinement of firing-motor output relationship in a subpopulation of L5b PNs. (a) Three examples of L5b PNs’ peri-event time histograms, aligned by the ‘orient’ position (time ‘0’, white dots). Fifty-six consecutive first reach success and 80 consecutive first reach failure trials are stacked. White arrows indicate the time when food pellets were provided. The correspondent forelimb velocity, are shown overlaid on the top. Neural activities were normalized and expressed as Z score. Neuron A’s firing highly correlated with forelimb action but remained unchanged with training. Neuron B’s firing became correlated with forelimb action after training. Neuron C’s firing did not correlate with forelimb reaching action irrespective of training.
(b) Averaged neural activities of the three L5b PNs shown in a during first reach success (red, mean ± s.e.m.) and first reach failure (blue, mean ± s.e.m.) trials on days 1 and 7. Arrows indicate the time when the neural activity began to diverge (TUD, time until divergence, see Methods). (c) Hierarchical clustering of 131 L5b PNs (recorded from five rats) based on single neuron I
Mduring motor learning. The dendrogram (upper half) depicts Euclidean distance of single PN I
Mvectors across 7 training days, with major subgroups indicated by different colours in the dendrogram. (d) Twenty-seven L5b INs (recorded from five rats) were classified into subgroups by applying the same method of hierarchical clustering of single neuron I
Mas shown in c.
(e) Summary of training-dependent changes of the optimal time lag of I
M(t
opt.for the three major types of L5b PNs (recorded from five rats) classified by
hierarchical clustering. Frequency histograms of individual neuron t
opt.at days 1 and 7 are shown on the top and the right respectively. Sixty out of sixty-one
of type 2 neurons exhibit a decrease in t
opt., which are distributed below the dashed line with unit slope.
significance of single neuron I
Mover 7 days was estimated by bootstrap resampling (Supplementary Fig. 5g, see Methods).
To account for the confounding factor of reduction of motor execution time causing possible apparent shortening of t
opt., we performed additional analyses whereby the variability of duration of the attempts was eliminated by mapping the forepaw trajectory
of individual attempts to the reference expert trajectory by dynamic time warping (DTW), which finds the optimal mapping for each individual forelimb trajectories to the reference trajectory. The mapping found was then applied to the time series data of neural activities and the forelimb instantaneous velocity, and t
optwas then re-calculated. After controlling for the
Actual forelimb velocity Predicted forelimb velocity by SVR
Type 1 day 1 Type 1 day 7
Type 2 day 1 Type 2 day 7
Type 3 day 1 Type 3 day 7
10 s 0.1 m s–1
–0.35 0 0.35
–0.35 0.35
0
–0.35 0 0.35
–0.35 0.35
0
Actual forelimb velocity (m s–1) Predicted forelimb velocity by SVR (m s–1)
Actual forelimb velocity (m s–1) Predicted forelimb velocity by SVR (m s–1)Predicted forelimb velocity by SVR (m s–1) Type 1 day 1
Type 2 day 1
Type 3 day 1
r2 = 7.58×10⁻²
Type 1 day 7
r2 = 0.548
Type 2 day 7
r2 = 0.512
Type 3 day 7
r2 = 8.24×10⁻²
–0.35 0 0.35
–0.35 0.35
0
–0.35 0 0.35
–0.35 0.35
0
c
d
Type 1 Type 2 Type 3a
b
Unit
1
27
SVR
Predicted forelimb instantaneous velocity Actual forelimb instantaneous velocity
20 s 0.1 mm ms–1 20 s
0 1
0.2 0.4 0.6
1 2 3 4 5 6 7
0
r2
0.2 0.4 0.6
1 2 3 4 5 6 7 0
0.2 0.4 0.6
1 2 3 4 5 6 7
0
Rat_67478.2 Rat_60595.2 Rat_66746.1 Rat_67125.2 Rat_58573.1
MSD = 7.68×10⁻³
MSD = 1.65×10⁻² MSD = 7.85×10⁻³
MSD = 1.71×10⁻² MSD = 1.67×10⁻²
**
MSD (m s–1) 0.02
0.01
0
1 2 3 4 5 6 7
Day
1 2 3 4 5 6 7
Day 0.02
0.01
0
0.02
0.01
0
1 2 3 4 5 6 7
Day
*
***
*
–0.35 0 0.35
–0.35 0
–0.35 0 0.35
–0.35 0.35
r2 = 7.84×10⁻² 0
0.35
**
r2 = 0.536 MSD = 8.13×10⁻³
variation in timing of individual reaching attempts, type 1 neurons still exhibited consistent t
opt.(Supplementary Fig. 5h), whereas a shortening of t
opt.was still observed specifically for type 2 neurons (Supplementary Fig. 5i).
L5b neurons predict motor outcome with increasing accuracy.
Given an increase in mutual information between single-unit firing and motor parameters among PNs recruited for the task, we then determined how well motor behaviour variables could be decoded from type 2 neuronal ensemble activities in comparison to type 1 neurons, and if decoding performance from different neuronal subpopulations changes with learning. We employed support vector regression (SVR) to perform time series forecasting of forelimb instantaneous velocity (Fig. 4a) and forelimb displacement (Supplementary Fig. 6a–c) (see Methods). For each neuron, we performed single neuron SVR decoding using activities within a time window preceding velocity and found that the optimal window size that enabled the highest prediction accuracy (t
SVR) was invariably greater than or equal to t
opt.(Supplementary Fig. 6d;
also see Methods). To maximize prediction accuracy, we used preceding population activities within a time window covered by the maximum t
SVRamong the neuronal population for prediction of instantaneous velocity. Decoding accuracy was quantified by Pearson’s correlation coefficient (r 2 ) and mean squared deviation between the actual and decoded forelimb velocities (Fig. 4b–d) and displacements (Supplementary Fig. 6a–c). Type 1 neurons activity predicted forelimb velocity with the highest fidelity throughout training (Fig. 4d, left panel). Decoding accuracy from type 2 neuron activities, in contrast, was training-dependent, whereby significant and progressive improved decoding of forelimb velocity from these neurons could be obtained throughout the 7 training days (Fig. 4d, middle panel). Consistent with a lack of change in information about motor parameters over the 7 days of motor learning, type 3 neurons remained non-informative about forelimb velocity (Fig. 4d, right panel).
To assay tuning stability of the different types of neurons, we used SVR trained on the data of each day for prediction of movement velocity on the previous day. For type 1 neuron ensembles, SVR trained on each day had similar prediction accuracies for same-day and previous-day velocity prediction (Supplementary Fig. 6e,f, Type 1). Interestingly, for type 2 neuron ensembles, SVR model trained on data from each day had slightly higher prediction accuracies for previous-day velocity than same- day data (Supplementary Fig. 6e,f, Type 2). These results indicate that both type 1 and type 2 neurons exhibited information and tuning stability, and suggest ongoing consolidation of coding by type 2 neurons during motor training.
Learning induces task-specific correlation structures in L5b. As learning-induced changes in neuronal correlation and population activity pattern in M1 upstream layers that provide excitatory drive to L5b have previously been reported 22,24 , we next investigated how joint-neuronal firing statistics in L5b may be shaped by learning. To exclude the possibility that the cross-trial variability of neuronal activities reflects merely the changes in forelimb kinematics, we controlled for the forelimb trajectory variability by selecting first reach success trials with actual trajectories closely approximating the reference expert trajectory from each individual day (criteria: 30 randomly selected first reach success trials with trajectory deviation within mean ± s.d. of cumulative Euclidean distance after DTW, see Methods) and restricted the pairwise cross-correlation analysis only to the period from the time of ‘food provided’ to ‘complete’ state. We observed that type 1 neurons exhibited clear correlated activities on day 1 of training and the correlation structure was robustly maintained throughout the 7 days (mean ± s.e.m. of correlation coefficient in day 1 session 1: r 2 ¼ 0.257 ± 0.051; day 1 session 6:
r 2 ¼ 0.268 ± 0.061, P ¼ 0.886; day 3 session 6: r 2 ¼ 0.258 ± 0.067, P ¼ 0.986; day 7 session 6: r 2 ¼ 0.263 ± 0.057, P ¼ 0.632; all compared to day 1 session 1, one-way repeated measures ANOVA, 14 pairs of type 1 neurons from five rats, see Fig. 5a for six pairs of type 1 PNs from one representative rat). In contrast, among type 2 neurons which were originally weakly correlated, clusters of neurons with correlated activities emerged in the first day of motor learning and the correlation structure was further strengthened during later phase of training (mean ± s.e.m. of correlation coefficient in day 1 session 1:
r 2 ¼ 0.037 ± 0.009; day 1 session 6: r 2 ¼ 0.047 ± 0.007, P ¼ 0.164;
day 3 session 6: r 2 ¼ 0.128 ± 0.018, P ¼ 0.006; day 7 session 6:
r 2 ¼ 0.154 ± 0.016, P ¼ 8.45 10 4 ; all compared to day 1 session 1, one-way repeated measures ANOVA, 348 pairs of type 2 neurons from five rats; see Fig. 5a for 66 pairs of type 2 PNs from one rat). On the other hand, type 3 neurons did not show robust structured activity correlation throughout the training period. Assessment of the overall similarity of correlation matrix across 7 training days of the type 1 and type 2 PNs (Fig. 5b) and INs (Supplementary Fig. 7a,b) from all rats suggested the emergence of task-specific neural engram among these neurons.
We also computed correlations for type 1 and type 2 neurons using spontaneous activities recorded when the animal was not executing the task, and found that only the similarity of correlation matrix for type 2 neurons was slightly strengthened towards the later period of training (type 1: day 1 session 1:
r 2 ¼ 0.045 ± 0.015 versus day 7 session 6: r 2 ¼ 0.055 ± 0.011, P ¼ 0.364; 14 pairs of type 1 neurons from five rats; type 2: day 1
Figure 4 | Learning-dependent changes of population prediction accuracy for forelimb instantaneous velocity. (a) SVR decoding of forelimb velocity from neural population activities. For each neuron, the firing histogram (bin size: 12.5 ms, left) was aligned to the behavioural event (27 units from an example animal), and the values was linearly normalized to 0–1 range. The actual forelimb instantaneous velocity (top right) was predicted using SVR by the corresponding population spike events. (b) Representative traces of actual forelimb instantaneous velocity (black) and the SVR model predicted forelimb velocity (red) by three types of neurons classified (type 1 neuron: n ¼ 4; type 2 neuron: n¼ 12; type 3 neuron: n ¼ 11, from an example animal), illustrating the changes in population decoding accuracy during early (day 1) and late (day 7) training sessions. (c) Least squares regression analyses between actual forelimb instantaneous velocity and the SVR model predicted forelimb velocity based on three types of L5b PNs shown in a during early and late training sessions. The Pearson’s correlation coefficient (r
2) and mean squared deviation (MSD) for each regression are shown. Each data point represents the instantaneous velocity of the forelimb trajectory predicted from neural population activity versus the actual velocity of displacement calculated from high-speed camera recording (in 12.5 ms bins). (d) Summarized result of r
2and MSD of predicted and actual forelimb instantaneous velocity by three types of PNs (n¼ 131) recorded from five rats. Upper left panel, day 1: r
2¼ 0.513 ± 0.013, day 3: r
2¼ 0.505 ± 0.010, P ¼ 0.098; day 7: r
2¼ 0.520 ± 0.013, P ¼ 0.492; bottom left panel, day 1: MSD¼ 0.0069 ± 0.00043, day 3: MSD ¼ 0.0073 ± 0.00028, P ¼ 0.370; day 7: MSD ¼ 0.0072 ± 0.00033, P ¼ 0.448. Top middle panel, day 1: r
2¼ 0.067±0.007, day 3: r
2¼ 0.211±0.014, P ¼ 0.006; day 7: r
2¼ 0.483±0.016, P ¼ 1.23 10
4; Bottom middle panel, day 1:
MSD ¼ 0.0161 ± 0.00048, day 3: SD ¼ 0.0130 ± 0.00034, P¼ 0.008; day 7: MSD ¼ 0.0081 ± 0.00035, P¼ 0.002. Top right panel, day 1: r
2¼ 0.061 ± 0.006,
day 3: r
2¼ 0.066 ± 0.015, P¼ 0.587; day 7: r
2¼ 0.073 ± 0.008, P ¼ 0.312. Bottom right panel, day 1: MSD¼ 0.0169 ± 0.00047, day 3: MSD¼ 0.0171 ± 0.00051,
P ¼ 0.282; day 7: MSD ¼ 0.0167±0.00055, P¼ 0.781, all compared to day 1, one-way repeated measures ANOVA, n ¼ 5.
session 1: r 2 ¼ 0.039 ± 0.009; day 7 session 6: r 2 ¼ 0.067 ± 0.013, P ¼ 0.037; 348 pairs of type 2 neurons from five rats; see Supplementary Fig. 7c for 6 pairs of type 1 and 66 pairs of type 2 PNs from the same rat as shown in Fig. 5a; see Supplementary Fig. 7d for overall similarity of correlation matrices across 7 days).
To verify the task-specificity of the correlated activities of the type 2 neurons, after 7 days of training, we switched the animal to another motor skill learning task, the rotarod test, and continued the recordings from the same single-units for 3 more days (Fig. 5c). The rotarod test also requires the participation of
Day 1 session 1 (D1S1) D3S6
D5S6 D4S6
D2S6 D1S6
D6S6 D7S6
Type 1 Type 2
Type 3
Type 1 Type 2
Type 3
r2
0 1
a
D3S6 D5S6 D4S6 D2S6 D1S6
D6S6 D7S6 D1S1
D3S6 D5S6D4S6
D2S6
D1S6 D6S6 D7S6
D1S1
Type 2
b
r2
0 1
e
D8S1 D8S6 D9S6 D10S6
Day 0
100 200 300
Latency to fall (s)
8 9 10
Neural activity recording
c d
r2
0 1 Type 1’
Type 2’
Type 3’
D3S6 D5S6 D4S6 D2S6 D1S6
D6S6 D7S6 D1S1
D3S6 D5S6D4S6
D2S6
D1S6 D6S6 D7S6
D1S1
Type 1
10 1420 2312 21
28 24 31
29 06
09
04 30 22 05
26 27 02
19 16 01 32
11 18 15
17
04 1020 0502 26
23 06 11
21 12
27
14 15 28 18
09 30 22
31 32 19 01
24 29 17
16
PN # PN #
Figure 5 | Emergence of correlation structure of L5b PNs during motor learning. (a) Pairwise cross-correlation matrix of 27 L5b PNs across 7 training days,
recorded from one representative rat during first reach success attempts (controlled for trajectory variance, see Methods). Neurons are ordered (PN #)
according to the sequence of hierarchical clustering shown in Supplementary Fig. 5b. The squares from top to bottom segregate type 1 to type 3 L5b PNs
identified. Increased correlation is evident only among the groups of neurons that show increased I
Mand decrease of t
opt., that is, type 2 neurons. (b) Summary
of the preserved overall similarity of cross-day correlation matrix among type1 and type 2 PNs. Each colour-coded element represented the averaged similarity
index of cross-day correlation matrices from five rats. (c) Paradigm of rotarod running. Rats were trained to run on the rotarod accelerating from 4 to 40
revolutions per minute over 300 s. Each trial ended when the rat fell off or when 300 s was reached. Each animal received six training sessions every day, and
each lasted 10 min with 5-min rest intervals. (d) Latency to fall off the rotarod during training. Animals showed fast improvement in performance on the first
two days and maintained throughout the third day (mean±s.e.m. of latency to fall in day 1 session 1: 62.0±19.1 s, day 1 session 6: 133.0±33.4 s, P ¼ 0.051; day
2 session 1: 132.1 ± 21.7 s, day 2 session 6: 249.0 ± 34.6 s, P¼ 0.007; day 3 session 1: 255.2 ± 25.7 s, day 3 session 6: 269.5 ± 20.3 s, P¼ 0.681, all compared to
day 1 session 1, one-way repeated measures ANONA, 4 rats). (e) Pairwise cross-correlation matrix among the 27 L5b PNs shown in a, but re-ordered for
clustering with high correlation coefficient near the diagonal during 3 days’ rotarod training (day 8 to day 10).
forelimb muscles but in a different context. Gauged by the latency to fall from the rotarod, the animals showed quick improvement on the first two days (Fig. 5d,e). The pattern of activity correlation emerged during forelimb reaching test was not observed when the animal performed the rotarod test, and a different pattern of correlation was apparent during the test (Fig. 5e, 27 PNs from the same neuronal populations in Fig. 5a, ordered for clustering of high correlation coefficient near the diagonal). Our results suggest that the recruitment of a subpopulation of PNs for a task may involve the selection and strengthening of horizontal recurrent
excitatory inputs or shared long range inputs from other areas to L5b PNs that are involved in specific task execution.
Emergence of reproducible spatiotemporal activities in L5b.
Previous data suggest the emergence of more uniform neurody- namics of type 2 neurons during motor training. To elucidate the basal firing activities of type 1 and type 2 neurons and their modulation by motor training, we analysed the spontaneous firing rates of type 1 and type 2 neurons, and quantified neural
–800
a
b
First reach successd
Day 1 Day 4 Day 7
LD 1
–1.6 0 0.6
LD 2
–0.8 0 0.8
LD 3
–0.5 0 0.5
–1.6 0 0.6
–0.8 0 0.8
–0.5 0 0.5
–1.6 0 0.6
–0.8 0 0.8
400 ms –0.5
0 0.5
c
LD 1
–1.6 0 0.6
LD 2
–0.8 0 0.8
LD 3
–0.5 0 0.5
Day 1 Day 4 Day7
First reach failure
0.3
0
0.3
0 LD 1 LD 2
LD 3
LD 1 LD 3
LD 1 LD 3
LD 1 LD 2 LD 3
LD 1 LD 2 LD 3
LD 1 LD 2 LD 3
0 800
–800
Time (ms)
Variance
LD 1 LD 2 LD 3
Day 1 7 0.3
0
0 800
Time (ms) 0.3
0
0 800
–800 Time (ms)
–1.6 0 0.6
–0.8 0 0.8
–0.5 0 0.5
–1.6 0 0.6
–0.8 0 0.8
–0.5 0 0.5
0 800
–800 Time (ms)
0.3
0
0 800
–800
Time (ms) 0.3
0
0 800
–800
Time (ms) Day 1 7
LD 1 LD 2 LD 3
400 ms
Variance
e
300 ms pre action Time
Latent dimension 2 (LD 2)
Latent dimension 1 (LD 1)
Latent dimension 3 (LD 3)
600 ms pre action
t = –300 ms
Forelimb orient
LD 1 LD 2
LD 3
t = 0 ms
Forelimb grasp LD 1 LD 2
LD 3
t = 200 ms
Forelimb retract
LD 1 LD 2
LD 3
t = 300 ms
First reach success First reach failure
LD 2 LD 2
Figure 6 | Illustration of single-trial neural trajectories extracted from population neural activities. (a) The temporals of ten single-trial neural trajectories extracted from first reach success trials by applying GPFA (see Methods) embedded in the top three orthonormalized latent dimensional space (LD1-3) spanning from 800 ms before to 800 ms after the ‘orient’ position, derived from 27 L5b PNs recorded from an representative animal. The black arrows indicate the flow of time series and coloured dots denote different stages of forelimb action. The ellipses indicate the across-trial variability (two s.d.
around the mean) at these states. (b) and (d) Top: Neural trajectories of 30 randomly selected first reach success trials with trajectory deviation within mean ± s.d. of cumulative Euclidean distance from reference expert trial after DTW, and neural trajectories of 30 randomly selected first reach failure trials, derived from 27 L5b PNs’ activities recorded from the same example animal. The flow of time series is colour gradient coded, from blue (start) to red (end).
Bottom: the same neural trajectories shown in three individual latent dimensional space (LD1-3). Arrow indicates ‘orient’ position. (c) and (e) Analysis of
the variance of the neural trajectories in LD1-3, quantified by the diagonal matrix of the covariance ellipsoids, showing progressive reduction in the variance
in first reach success trials (c) but not in failure trials (e) during training.
variance by mean-matched Fano factor (FF) 48 . Type 1 neurons had in general higher spontaneous firing rate than type 2 neurons (Supplementary Fig. 7e, mean firing rate ± s.d., type 1:
9.2 ± 3.5 Hz; type 2: 5.9 ± 4.0 Hz, t-test, P ¼ 0.0054), which suggest that type 1 neurons may more likely be corticope- duncular neurons, while type 2 neurons may more likely correspond to corticostriatal neurons 49 . Apart from a steady I
Mand t
opt., for type 1 neurons a significant decrease in firing variance within a time window near forelimb grasping was already evident during day 1 session 1 (Supplementary Fig. 8a, day 1 session 1, mean-matched FF ± s.e.m., pre-grasp:
2.189 ± 0.133, during grasp: 1.706 ± 0.114, P ¼ 0.021; post-grasp:
2.161 ± 0.125, P ¼ 0.717; all compared to pre-grasp; one-way ANOVA, n ¼ 14). This relationship strengthened rapidly within the first training day and persisted throughout the training period (Supplementary Fig. 8a, day 1 session 6 and day 7 session 6).
For type 2 neurons, emergence of significant reduction of mean-matched FF occurred within the first day of motor training and persisted throughout the training period (Suppleme- ntary Fig. 8b).
To further probe whether motor learning is associated with the emergence of reproducible population activity of L5b neurons during task execution, we applied the Gaussian-process factor analysis algorithm (GPFA) 50 , a dimensionality reduction algorithm, to extract smooth single-trial neural trajectories from PN population activities during individual reaching attempts (Fig. 6a). The neural trajectories were embedded in a three- dimensional space composed by the top three-orthonormalized latent dimensions, which together accounted for 89.4 ± 3.9%
(mean ± s.d., five rats) of the total variance. To control for the potential contribution of increased uniformity of forelimb trajectory to any changes in neural variance observed, we selected first reach success trials with forelimb trajectories closely approximating the reference expert trajectory from each individual day (criteria: 30 randomly selected first reach success trials with trajectory deviation within mean ± s.d. of cumulative Euclidean distance after DTW, see Methods) and extracted neural population activity trajectories from these trials. As training progressed, the neural trajectories progressively exhibited reduction in variance (see Methods) during first reach success trials over the entire 7-day training period (Fig. 6b,c, data from one typical rat, and Supplementary Fig. 9a–d, data from two more rats), despite that the variance of task execution time and forelimb trajectories as well as proportion of first reach success trials reached steady levels (see Fig. 1e,g), but not during first reach failure trials (Fig. 6d,e, 30 randomly selected first reach failure trials on each day). We also computed neural trajectories separately for type 1 and type 2 neurons, and observed that the decreased variance of neural trajectories with training could be attributed to type 2 neurons only (Supplementary Fig. 9e,f, Type 1; Supplementary Fig. 9g,h, Type 2). Therefore, a reduction in neural trajectory variance was not a mere reflection of reduced forelimb trajectory variance, but represents reorganization of L5b population PNs neural activities with motor learning especially during successful execution of desirable movement, a phenomenon largely attributable to more reproducible activities of type 2 neurons.
Physiologically induced synaptic plasticity in L5b. We speculated that the mechanism by which the motor representa- tion is altered in M1 involves the induction and maintenance of experience dependent synaptic plasticity, as hinted by previous studies documenting highly dynamic spine remodelling processes in M1 during motor learning 29,30 . However, it is unknown whether these remodelling processes were associated with
changes in the strengths of synaptic connections. We therefore examined the properties of motor training-induced synaptic plasticity occurring at the output layer neurons, by tracking the changes of FPs evoked and recorded at L5b (Fig. 7a, upper panel).
We applied one-dimensional current source density (CSD) analysis to confirm the location of the current source underlying the FPs recorded (Fig. 7a, bottom panel). Locations of current sinks revealed that stimulation at L5b activated synaptic inputs mainly confined to the same layer, which is consistent with synaptic transmission occurring at the basal dendrites of L5b neurons.
Forelimb reaching motor training (days 1–7) was associated with a rapid and long-lasting potentiation of the evoked FPs in the first few days (Fig. 7b). The ceiling of this physiologically induced LTP was reached typically after day 4. Thus, the profile highly paralleled that of the behavioural learning curve of increasing first success rates (cf. Fig. 1f). When the animal switched to the rotarod running task from days 8 to 10, the evoked FPs were further potentiated (Fig. 7b, mean ± s.e.m of potentiation on day 7: 125.8 ± 1.3%, day 8: 128.2 ± 1.7%, P ¼ 0.013; day 9: 129.9 ± 1.5%, P ¼ 0.004; day 10: 130.3 ± 1.0%, P ¼ 0.003, paired t-test, all compared to day 7, five rats). These results are consistent with the observation of an overall and persistent increase in basal dendritic spine density of L5 neurons with motor learning 51 and strengthening of horizontal connections among them.
To explore potential relationship between single-unit activity and evoked FP, we performed spike sorting for recordings obtained from FP experiments (Supplementary Fig. 10a). As the FP experiments were carried out in animals with only linear electrodes implanted (Fig. 7a, top panel), we therefore only had a limited number of neurons available for this analysis (a total of 3 type 1 neurons and 11 type 2 neurons from 5 rats with sufficiently stable recordings as measured by high-quality spike sorting, highly preserved spike waveform and ISIH). Interestingly, for type 1 neurons, we identified a phase locking relationship whereas type 1 neurons exhibited a peak in peristimulus time histogram, and this phenomenon was apparent already in day 1 and persisted throughout 7 days of training (Supplementary Fig. 10b, upper panels). In contrast, type 2 neurons initially did not have a peak in their PSTH, but after training, they also exhibited locking of firing to FP (Supplementary Fig. 10b, lower panels). These findings suggest that there may be selective strengthening of recurrent connections among type 2 neurons.
Critical role of dopamine in M1 for motor memory formation.
Dopamine is known to be critical in synaptic plasticity 33 and recent studies imply that the mesocortical dopaminergic innervation to M1 is essential for the acquisition of motor skills 34,35 . Thus, to further probe the mechanism of motor memory formation, we investigated the effect of dopamine denervation in M1 on both motor learning-induced LTP and changes in motor representation in our animals. Local dopamine depletion was achieved by 6-hydroxydopamine (6-OHDA) injection into M1 while noradrenergic terminals were spared by desipramine co-injection. The level and specificity of dopamine terminals depletion was verified immunohistochemically (Supplementary Fig. 11a–d).
Under local dopamine depletion, there was still learning-
associated shortening of delay in first attempt during the 7 days of
training. However, in contrast to sham-operated animals, for
which the delay of first reach success trials was significantly
shortened from day 3 onwards (Fig. 7c), significant shortening
of response delay of lesioned animals was only observed from
day 5 onwards (Fig. 7c), suggesting a degradation in learning
performance after local cortical DA depletion. More strikingly, the first reach success rate achieved after training in a single day was not well maintained overnight, and led to repeated
re-learning of the task in the next day (Fig. 7d). As such, the eventual first reach success rate after 7 days of training was substantially lower than that achieved by the sham control
Day 1 – day 7 (forelimb reaching)
Day 8 – day 10 (rotarod running) Stim. Rec. L1
L2/3
L5
L6 Rec.
Stim.
10 ms 700 μV
Time (ms)
10 20 30 50
Depth (mm)
0.2
0.7 1.2 1.7 2.2
40
−2.5 0 2.5
Sink Source
0
700 μV 10 ms Pre day 7 Post day 7 Pre day 1 (baseline)
Sink
Day
Pre 1 2 3 4 5 6 7 8 9 10 100
110 120 130 140
90
Post day 1
50
0 10 20 30 40
1 2 3 4 5 6 7
Sham Lesion
Day
First reach success (%)
1 2 3 4 5 6 7
Day 0
1 2 3 4 5 6
Delay in first reach success (s)
Sham Lesion
600 μV 10 ms Pre day 1 (baseline) Post day 1
Pre day 7 Post day 7 6-OHDA
FP slope (% baseline)
Pre 1 2 3 4 5 6 7
Day 100
110 120 130
90 Sham Lesion
FP slope (% baseline)
Stim. Rec.
(mV mm–2)
a b
c e
d
Figure 7 | Local dopamine depletion impaired training-induced LTP of synaptic inputs. (a) Top, averaged traces of field potentials (FPs) evoked in vivo at multiple sites from L1 to L6 of M1, recorded via 20 recording contacts in a linear microprobe (Rec.). The stimulating electrode (Stim.) was placed at L5, which could activate synaptic inputs to the basal dendrites. Arrows indicated typical FPs recorded at target deep layer 5. Bottom, current source density profiles corresponding to the laminar FPs evoked by stimulating at L5. By activating inputs targeting basal dendrites, the early, negative FP recorded in L5 was generated by direct inward current (that is, the sink, yellow/red). This feature was highly consistent among different animal subjects. (b) Top, FPs were recorded from rats undergoing 7 days of forelimb reaching task, followed by 3 days of rotarod running task. Bottom, potentiation of stimulation evoked-FPs slope when activating basal dendritic inputs in L5. Representative traces of the FPs on days 1 and 7 (pre- and post-training) are shown. All bars represent the mean ± s.e.m (five rats).
(c) Learning-associated shortening in delay of first reach attempt in sham-operated (black, five rats) and 6-OHDA lesioned animals (blue, five rats). Sham
group: mean±s.d. of delay on day 1: 4.416±0.783 s, day 3: 3.362±0.588 s, P¼ 0.038; day 7: 1.118±0.216 s, P ¼ 0.006, all compared to day 1, one-way
repeated measures ANOVA, 5 rats; Lesioned group: mean ± s.d. of delay on day 1: 3.663 ± 0.676 s, day 4: 2.631 ± 0.849 s, P ¼ 0.065; day 5: 2.376 ± 0.778 s,
P ¼ 0.048; day 7: 1.587 ± 0.463 s, P ¼ 0.019, all compared to day 1, one-way repeated measures ANOVA, 5 rats. (d) Comparison of motor skill performance
between sham-operated (black, five rats) and 6-OHDA lesioned (blue, five rats) animals. Data are represented as mean±s.e.m. In contrast to the sham group,
the first reach success rate achieved after each day’s training by the lesioned animals was not well maintained in the next day. (e) Comparing to sham-operated
group (black, five rats), with local dopamine depletion restricted to M1 (blue, five rats), learning-induced potentiation of FPs could not be maintained. Data are
represented as mean±s.e.m.
(mean ± s.d. of first success rate in day 7 session 6: sham:
47.85 ± 4.54%, five rats; lesioned: 38.3 ± 6.48%, P ¼ 0.028, one-way ANOVA, five rats, Fig. 7d). Restoration of dopaminergic tone by administration of levodopa partially prevented degraded motor learning (Supplementary Fig. 11e, mean ± s.d. of first success rate on day 7: 6-OHDA þ vehicle: 34.8 ± 4.2%, n¼ 3 rats, 6-OHDA þ L-DOPA: 41.9 ± 2.9%, n ¼ 3 rats, P ¼ 0.035; sham:
48.1 ± 2.2%, n ¼ 4 rats, P ¼ 0.021; all compared to 6-OHDA þ vehicle group, Kruskal–Wallis H test), while M1 6-OHDA injection after completion of 7-day motor training did not impair further motor performance (Supplementary Fig. 11f), indicating that 6-OHDA injection did not exert its effects via impairing motor control per se. In parallel to these findings, we found that under dopamine depletion, the profile of motor training-induced LTP was severely disrupted. Despite that the training cohort still led to the potentiation of evoked FPs every day, significant
depotentiation occurred overnight, resulting in the repeated cycles of potentiation/de-potentiation throughout the whole training period (Fig. 7e). These observations demonstrate an essential role of dopamine in consolidating newly potentiated synapses in L5b PNs.
If dopamine-mediated consolidation of synaptic plasticity is critical to motor memory formation, one would expect that the emergence of the task-related activities at the single neuron level as well as population level would be affected under dopamine depletion. Indeed, in these animals, while hierarchical clustering of the L5b PNs and INs based on I
Mstill succeeded in classifying sub-groups of neuronal clusters (95 PNs and 19 INs, Fig. 8a–c, four rats), the emergence of neurons with increase in I
Mand shortening in t
opt., classified as type 2 neurons, was much less distinct (Fig. 8c, middle panel, mean ± s.d. of t
opt.¼ 23.4 ± 74.2 ms, corresponding to an average of 11.4% reduction in 45/95
c
Type 1 Type 2 Type 3Normal fit Mean = 71.2 ms SD = 123.8 ms N = 11
Normal fit Mean = 69.7 ms SD = 126.6 ms N = 11
7 1
–400 0 500
Normal fit Mean = 210.7 ms SD = 101.9 ms N = 45 Normal fit Mean = 244.8 ms SD = 105.2 ms N = 45 7
1
7 1
–400 0 500
–400 500
0 0
Normal fit Mean = 47.8 ms SD = 187.6 ms N = 39
Normal fit Mean = 44.5 ms SD = 194.9 ms N = 39 7
1
7 1
–400 0 500
-400 500
0
No. of neuron
7
No. of neuron1 No. of neuron
No. of neuron No. of neuron No. of neuron
a b
Day
7 6 5 4 3 2 1 1.5
Euclidean distance
0 1.4 0.3
Euclidean distance Day 7 6 5 4 3 2 1
‘Type 2’ ‘Type 3’
‘Type 1’
‘Type 2’
‘Type 3’
Day 1 session 1
(D1S1) D3S6
D5S6 D4S6
D2S6 D1S6
D6S6 D7S6
Type 1 Type 2 Type 3
Type 1 Type 2 Type 3
D3S6 D5S6 D4S6 D2S6 D1S6
D6S6 D7S6 D1S1
D3S6 D5S6D4S6
D2S6D1S6 D6S6 D7S6
D1S1
PN r2
0 r2 1
0 1
e
Day 1 Day 4 Day 7
LD 3
LD 2 LD 1
LD 2 LD 1
LD 3
LD 2 LD 1
First reach success LD 3
0.4 0.2 0
Day 1 7
LD 1 LD 2 LD 3
Variance
0 800
–800 Time (ms)
0 800
–800 Time (ms)
0 800
–800 Time (ms)
First reach success
LD 1LD 2LD 3
1.2
–1.2 0 0.8
–0.8 0 0.8
–0.8 0
0.4 0.2 0 1.2
–1.2 0 0.8
–0.8 0 0.8
–0.8 0
0.4 0.2 0 1.2
–1.2 0 0.8
–0.8 0 0.8
–0.8 0 First reach success
400 ms
Day 1 Day 4 Day 7
IM (bit ×10–1)
–400 500
d
f
opt. on day 1 (ms) opt. on day 1 (ms) opt. on day 1 (ms)
opt. on day 1 (ms) opt. on day 1 (ms)
opt. on day 7 (ms) opt. on day 7 (ms) opt. on day 7 (ms) opt. on day 7 (ms) opt. on day 7 (ms) opt. on day 7 (ms)
opt. on day 1 (ms)