4
Research and Development Trends in Energy Crops and Biofuel Conversion Technologies
S eiji M aeda Environment and Energy Research Unit
1 Introduction
To solve global warming problems and ensure sustainable development of the economy, it is necessary to increase the use of renewable biomass resources. The magazine “Science
& Technology Trends”, published articles on the possibilities of bio-energy and the trends in the technological developments, spread and introduction of policies adopted in many countries
[1,2]. In recent years, there have been active movements to accelerate the spread of liquid biofuels as alternative to gasoline and diesel fuel in a large number of countries, for enhancing their energy security, managing high crude o i l pr ices and overcoming gloval warming problems.
Recent ly, i nter n at ion a l cr ude oi l pr ices have risen rapidly and temporarily exceeded US$80/barrel. The increases in prices were due to various factors such as the risk of political instability, the rapid development of BRICs’
economy, and the disr uption of oi l supply infrastructures by natural disasters. Considering that the world production of oil will inevitably reach its peak in the medium or long term, it is most likely that the trend for oil prices to increase will continue. In such a tough situation, most of the transportations such as automobiles, aircrafts and ships continue to depend on crude oil by the reason of no alternatives for economically providing energy.
In many countries, it is generally recognized t h a t i t i s u r g e n t l y n e c e s s a r y t o r e d u c e dependence on oil for transport energy. Thus, much attention is concentrated on research on
energy crops to provide biomass as an energy resource and on low-cost biofuel conversion technologies indispensable for the widespread adoption of bio-energy.
In Japan, where self-sufficiency in food is 40% at most, discussions on biomass use have been limited to the utilization of domestically unused wastes as energy resources, given that any increase in producing biomass as an energy resource would be in competition with food production. Therefore, sufficient study has not been made of the requirements, such as the availability of biomass resources, costs and quality stability, for the large-scale introduction of biofuels as alternatives to crude oil. Japan has started somewhat late in its movement toward the commercialization of biofuels, compared with other countries where such movements are increasingly active.
This article reviews the potential of biofuels as alternatives to crude oil in the world and in Japan, and summarizes the research and development trends for energy crops and biofuel conversion technologies essential to the development of biofuels. In addition, it describes problems encountered in the efforts made in Japan to develop biofuel technologies, and discusses the issues on which future research should focus.
2 Present situation and potential of biofuels as transport energy resources
2-1 Social background to biofuel production
Carbon contained in biomass is derived from
CO
2fixed from the atmosphere while plants are
growing. Biomass could be considered to be a
carbon-neutral energy resource if the release of CO
2into the atmosphere as a result of the combustion of biomass is counterbalanced by the fixing of CO
2as part of the solar energy driven carbon cycle (Figure 1). Then, if the biomass is used as a fuel alternative to fossil resources-based fuels such as crude oil, it is possible to reduce the emissions of greenhouse gases during the life cycle of the biomass, and provide a very effective means to take measures against global warming
[4].
Biomass-based liquid fuels, what are called biofuels, are the most likely of the potential renewable energ y resou rces for tr a nspor t energy to succeed, because it is relatively easy to introduce biofuels, independently or as a mixture with a fossil-based liquid fuel, into existing internal combustion engine and distribution infrastructures. In Japan, annual CO
2emissions
are now 1.36 billion tons-CO
2, of which the emissions from motor vehicles accounts for about 20% , or 2.3 million tons-CO
2[5]. If total CO
2emissions in Japan were reduced by 20% by replacing all fuels for motor vehicles with carbon- neutral biofuels, emissions would decrease to 1.13 billion tons-CO
2, which is lower than the reduction target of 1.23 billion tons-CO
2(6%
lower than the level in 1990).
Amongst biomass-related technologies, there are various combinations of raw materials, conver sion tech nolog ies a nd use pat ter ns (Figure 2). Liquid biofuels are suitable for use as transport energy because of high energy density.
At present, the use of biofuels is mostly confined to agricultural countries which have abundance of low cost energy crops (Figure 3). However, in Japan, which has scanty energy crop resources,
Prepared by the STFC based on Reference
[3]Solar energy
[20 trillion tons oil equivalent]
* Value of land
Absorption by plants [110 billion tons-C]
Respiratory release of CO2 [50 billion tons-C]
Release by decomposition and combustion [60 billion tons-C ]
Atmospheric CO
2[730 billion tons-C ]
CO2 fixation [60 billion tons-C ]
Biomass
[560 billion tons-C]
Biofuel-powered vehicle CO2 Emission from fossil fuels [6 billion tons-C]
Biomass energy utilization
Gasoline-engine vehicle / Diesel-powered vehicle
Fossil fuels
Figure 1 : Atmospheric carbon cycle and carbon-neutral biomass energy
Energy crops
■
Sugar and starch crops
■
Oilseed crops
■
Wood (trees)
■
Grasses
Wastes
■
Sewerage sludge
■
Agricultural, forestry and livestock wastes
■
Black effluents
■
Waste construction materials
■
Waste Foods
Biochemical reactions (saccharification and fermentation)
Esterification and others
Thermo-chemical reactions (gasification and water heating) Combustive reactions
Liquid fuel (biofuel)
Organo-chemical materials
Gaseous fuel
Electricity and heat
Figure 2 : Raw materials and use for biomass-related technologies
Prepared by the STFC based on Reference
[6]biofuels are produced mainly from waste-based resources such as waste construction materials and food oil, and the production of biofuels is extremely limited in regional and quantitative terms.
2-2 Global trends of biofuel promotion policy
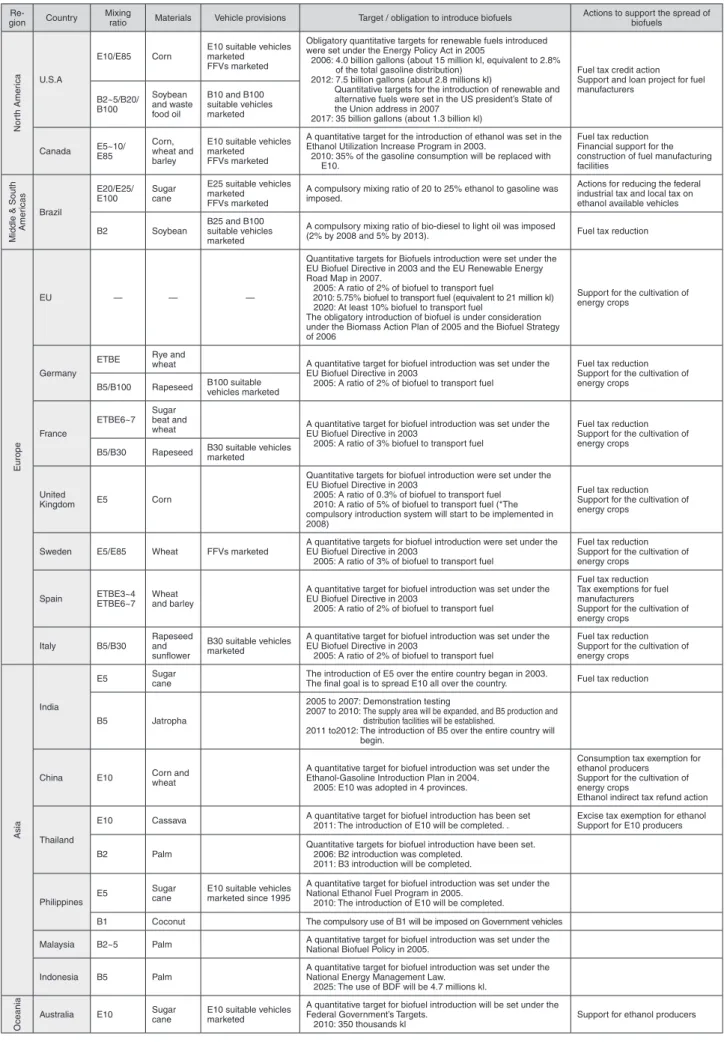
There are many overseas countries where the spread and i ntroduction of biof uels is actively promoted. In these countr ies, not only compulsory quantitative targets for the introduction of biofuels in the medium- and long-term established, but other measures for accelerating the spread of biofuels, including changes i n the ta xation system, are bei ng established (Table 1). In the U.S.A. and the EU, importance is attached to promoting agriculture and forestry, both to ensure energy security and to take measures against global warming. In China, in addition to these challenges, greater impor tance is attached to coping with the increasing energy consumption by the growing economy. I n Br a z i l a nd A SE A N cou nt r ies, priority has primarily been given to industrial development and the eradication of poverty mainly by increasing exports to foreign countries.
As a consequence, these countries are inevitably r e qu i r e d to r e duce t he r e s u lt a nt ad ve r s e influences on the environment such as excessive deforestation of tropical rain forests.
T hus, the pol icies leadi ng to the spread of biofuels had different origins in different countries. However, the policy in each country
clearly considers biofuels to be alternatives to transport energy in the medium- and long- term. It is common to all countries that they have produced crops for energy (energy crops) with economical feasibility, have set quantitative targets for the introduction of biofuels, including compulsory targets, and established a variety of systems supporting the production and spread of biofuels.
In Japan as well, the “Kyoto Protocol Target Achievement Plan”
[7], adopted by the Cabinet Council in April 2005, set a quantitative target of 500 thousand kl-crude oil equivalent for biofuels used in the transpor t sector. The “Biomass Nippon Strategy”
[8], decided by Cabinet Council in March 2006, established the significance and objectives for the introduction biofuels, and has accelerated the implementation of the measures taken to promote the utilization of biofuels. In November 2006, Mr. Abe, Former Prime Minister, ordered an increase in the domestic production of biofuels, from the viewpoints of protecting the global environment and supporting regional development and agriculture. To comply with the Prime Minister’s order, an implementation plan was developed by the “Biomass Japan Comprehensive Strategy Promotion Council” in which the Ministries and Agencies concerned, including the Ministry of Agriculture, Forestry and Fisheries, participated
[9]. The industries concerned in Japan also provided a model for the large-scale production of low cost biofuels as well as their proposals on the roadmap for
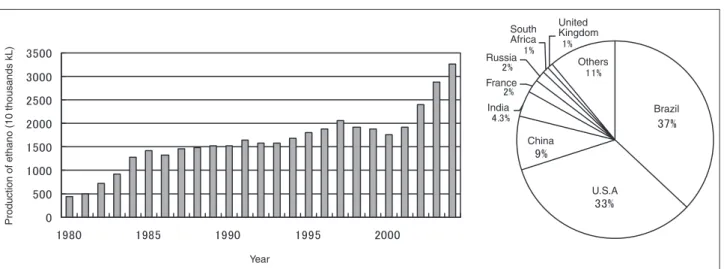
Year
Production of ethano (10 thousands kL )
Brazil
U.S.A China
Others United Kingdom South
Africa Russia France India
Figure 3 : World trend of bio-ehtanol production and each country’s share in 2004
Prepared by the STFC based on Reference
[6]Table 1 : Biofuels introduction policies by country
Abbreviations: E is ethanol, B is bio-diesel, and ETBE is ethyl tertiary-butyl ether. The figures are mixing ratios by volume.
Prepared by the STFC based on Reference
[6]Re-
gion Country Mixing
ratio Materials Vehicle provisions Target / obligation to introduce biofuels Actions to support the spread of biofuels
U.S.A
E10/E85 Corn E10 suitable vehicles marketed FFVs marketed
Obligatory quantitative targets for renewable fuels introduced were set under the Energy Policy Act in 2005
2006: 4.0 billion gallons (about 15 million kl, equivalent to 2.8%
of the total gasoline distribution) 2012: 7.5 billion gallons (about 2.8 millions kl)
Quantitative targets for the introduction of renewable and alternative fuels were set in the US president’s State of the Union address in 2007
2017: 35 billion gallons (about 1.3 billion kl)
Fuel tax credit action Support and loan project for fuel manufacturers
B2~5/B20/
B100
Soybean and waste food oil
B10 and B100 suitable vehicles marketed
Canada E5~10/
E85
Corn, wheat and barley
E10 suitable vehicles marketed FFVs marketed
A quantitative target for the introduction of ethanol was set in the Ethanol Utilization Increase Program in 2003.
20 10: 35% of the gasoline consumption will be replaced with E10.
Fuel tax reduction Financial support for the construction of fuel manufacturing facilities
Brazil
E20/E25/
E100 Sugar
cane
E25 suitable vehicles marketed FFVs marketed
A compulsory mixing ratio of 20 to 25% ethanol to gasoline was imposed.
Actions for reducing the federal industrial tax and local tax on ethanol available vehicles
B2 Soybean B25 and B100
suitable vehicles marketed
A compulsory mixing ratio of bio-diesel to light oil was imposed
(2% by 2008 and 5% by 2013). Fuel tax reduction
EU — — —
Quantitative targets for Biofuels introduction were set under the EU Biofuel Directive in 2003 and the EU Renewable Energy Road Map in 2007.
2005: A ratio of 2% of biofuel to transport fuel
2010: 5.75% biofuel to transport fuel (equivalent to 21 million kl) 2020: At least 10% biofuel to transport fuel
The obligatory introduction of biofuel is under consideration under the Biomass Action Plan of 2005 and the Biofuel Strategy of 2006
Support for the cultivation of energy crops
Germany
ETBE Rye and
wheat A quantitative target for biofuel introduction was set under the EU Biofuel Directive in 2003
2005: A ratio of 2% of biofuel to transport fuel
Fuel tax reduction Support for the cultivation of energy crops
B5/B100 Rapeseed B100 suitable vehicles marketed
France
ETBE6~7 Sugar beat and
wheat A quantitative target for biofuel introduction was set under the EU Biofuel Directive in 2003
2005: A ratio of 3% biofuel to transport fuel
Fuel tax reduction Support for the cultivation of energy crops
B5/B30 Rapeseed B30 suitable vehicles marketed
United
Kingdom E5 Corn
Quantitative targets for biofuel introduction were set under the EU Biofuel Directive in 2003
2005: A ratio of 0.3% of biofuel to transport fuel 2010: A ratio of 5% of biofuel to transport fuel (*The compulsory introduction system will start to be implemented in 2008)
Fuel tax reduction Support for the cultivation of energy crops
Sweden E5/E85 Wheat FFVs marketed A quantitative targets for biofuel introduction were set under the EU Biofuel Directive in 2003
2005: A ratio of 3% of biofuel to transport fuel
Fuel tax reduction Support for the cultivation of energy crops
Spain ETBE3~4
ETBE6~7 Wheat and barley
A quantitative target for biofuel introduction was set under the EU Biofuel Directive in 2003
2005: A ratio of 2% of biofuel to transport fuel
Fuel tax reduction Tax exemptions for fuel manufacturers
Support for the cultivation of energy crops
Italy B5/B30 Rapeseed
and sunflower
B30 suitable vehicles marketed
A quantitative target for biofuel introduction was set under the EU Biofuel Directive in 2003
2005: A ratio of 2% of biofuel to transport fuel
Fuel tax reduction Support for the cultivation of energy crops
India
E5 Sugar
cane The introduction of E5 over the entire country began in 2003.
The final goal is to spread E10 all over the country. Fuel tax reduction
B5 Jatropha
2005 to 2007: Demonstration testing
2007 to 2010: The supply area will be expanded, and B5 production and distribution facilities will be established.
2011 to2012: The introduction of B5 over the entire country will begin.
China E10 Corn and
wheat
A quantitative target for biofuel introduction was set under the Ethanol-Gasoline Introduction Plan in 2004.
2005: E10 was adopted in 4 provinces.
Consumption tax exemption for ethanol producers
Support for the cultivation of energy crops
Ethanol indirect tax refund action
Thailand
E10 Cassava A quantitative target for biofuel introduction has been set
2011: The introduction of E10 will be completed. . Excise tax exemption for ethanol Support for E10 producers
B2 Palm Quantitative targets for biofuel introduction have been set.
2006: B2 introduction was completed.
2011: B3 introduction will be completed.
Philippines E5 Sugar
cane E10 suitable vehicles marketed since 1995
A quantitative target for biofuel introduction was set under the National Ethanol Fuel Program in 2005.
2010: The introduction of E10 will be completed.
B1 Coconut The compulsory use of B1 will be imposed on Government vehicles
Malaysia B2~5 Palm A quantitative target for biofuel introduction was set under the National Biofuel Policy in 2005.
Indonesia B5 Palm A quantitative target for biofuel introduction was set under the
National Energy Management Law.
2025: The use of BDF will be 4.7 millions kl.
Australia E10 Sugar
cane E10 suitable vehicles marketed
A quantitative target for biofuel introduction will be set under the Federal Government’s Targets.
2010: 350 thousands kl Support for ethanol producers
North AmericaMiddle & South AmericasEuropeAsiaOceania
technological development, on research and development organization, and on cooperation with the other Asian countries
[10].
Howe ve r, J ap a n , u n l i ke s o m e ove r s e a s countries, has not yet introduced any biofuel that could compete in terms of cost with conventional fossil fuels. Therefore, obligatory medium- and long-term targets for the introduction of biofuels and incentives for the widespread distribution and adoption of biofuels, including changes to the tax system, have not been established in Japan.
2-3 Potential for supplying biofuels in view of land use availability
In contemplating introduction of biofuels as a full-scale alternative to conventional fossil fuels, it is necessary to take the potential competition over land between biofuels and food crops into consideration. It is predicted that the world population will reach a peak of about 9.2 billion around 2050
[11]. The question is whether the world’s agricultural lands will be able to supply the demands for both biofuel and food production at that time.
Table 2 : Estimations of biofuel supply potential in 2050
Year 1970 2000 2015 2030 2050
World Population 3.7 billion 6.1 billion 7.1 billion 8.1 billion 9.1 billion
Annual demand for cereals per capita 0.33 t/capita 0.34 t/capita 0.33 t/capita 0.33 t/capita 0.33 t/capita Warld’s total annual demand for cereals 850 million t 2,040 million t 2,320 million t 2,680 million t 3,010 million t
Annual yield per area 1.3 t/ha 2.9 t/ha 3.3 t/ha 3.3 t/ha 3.3 t/ha
Necessary area for food producing 650 million ha 670 million ha 700 million ha 810 million ha 910 million ha Required increase in food producing area (over the area in 2000) 240 million ha
Area available for energy production 260 million ha Annual production of ethanol (estimated) 1,030 million kl (a) Case based on predictions by the United Nations
(b) Case assuming increased demand for foods
Year 1970 2000 2015 2030 2050
World Population 3.7 billion 6.1 billion 7.1 billion 8.1 billion 9.1 billion
Demand for cereals per capita 0.33 t/capita 0.34 t/capita 0.35 t/capita 0.37 t/capita 0.41 t/capita World’s total annuals demand for cereals 850 million t 2,040 million t 2,500 million t 3,010 million t 3,760 million t
Yield per area 1.3 t/ha 2.9 t/ha 3.3 t/ha 3.3 t/ha 3.3 t/ha
Necessary area for food producing 650 million ha 670 million ha 760 million ha 910 million ha 1,140 million ha Required increase in food producing area (over the area in 2000) 470 million ha Area available for energy production 30 million ha Annual production of ethanol (estimated) 130 million kl (c) Case assuming increased yield/ha
Year 1970 2000 2015 2030 2050
World Population 3.7 billion 6.1 billion 7.1 billion 8.1 billion 9.1 billion
Demand for cereals per capita 0.33 t/capita 0.34 t/capita 0.35 t/capita 0.37 t/capita 0.41 t/capita World’s total annuals demand for cereals 850 million t 2,040 million t 2,500 million t 3,010 million t 3,760 million t
Yield per area 1.3 t/ha 2.9 t/ha 3.3 t/ha 3.6 t/ha 3.9 t/ha
Necessary area for food producing 650 million ha 670 million ha 760 million ha 850 million ha 960 million ha Required increase in food producing area (over the area in 2000) 290 million ha
Area available for energy production 210 million ha
Annual production of ethanol (estimated) 860 million kl
Prepared by the STFC based on References
[11-14]The total area of land in the world is 145 billion ha, of which present agricultural land accounts for about 10 % of the total area
[12]. A United Nations’ FAO study reports that the total area of agricultural lands may be increased by about 1.8 billion ha
[13]. However, 60% of the increase in agricultural land area will be forests and reserves, and 2/3 of them will be defective in terms of soil quality and topography. Therefore, if these areas are subtracted, it is estimated that the real increase in agricultural land area may be about 500 million ha.
Based on the United Nations’ projections for the demand for cereals, it will be necessar y to increase the food producing area by 240 million ha by 2050 when the world population is expected to reach its peak. Therefore, if the increase of 240 million ha in food producing area is subtracted from the total increase in agricultural land, the biofuels producing area is estimated at 260 million ha in 2050. The potential annual production of ethanol is estimated to be about 1.0 billion kl from this biofuels-producing area, assuming that the biomass productivity is 10dry-t/ha and the ethanol conversion efficiency is 0.4kl/dry-t (Table 2 (a)). The United Nations’
projection assumes that future demands for cereals per capita will be almost the same as at present. However, the figure for future consumption seems to be rather low, considering t he h ig h econom ic g row t h i n developi ng countries. The demand for cereals per capita has increased by 10% for the past 30 years. Supposing that this rate of increase will continue in the future, it is estimated that the potential annual production of ethanol would be decreased to 130
million kl (Table 2 (b)).
There are two possible approaches to ensuring the compatibility of the supply of foods with that of biofuels as described hereinafter. The first approach is to increase the yield of crops per hectare. The estimation above was based on the assumption that increases in the yield per hectare will level off after 2015. The yield of cereals per hectare increased at an annual rate of 3% in the 1960s, and it has increased at an annual rate of 1.5% since 1980s. It is predicted that the annual rate of increase will decrease to 1.1% by 2015
[14]. Assuming that the yield per hectare increases at an annual rate of 1% after 2015, the potential annual production of ethanol in 2050 will be about 860 million kl (Table 2 (c)). It can be expected that this value will be readily attained if the productivity of crops is effectively improved by applying gene modification technologies to crops.
T he second approach i s by est abl i sh i ng innovative biofuel production technologies. In the U.S.A. and the EU, these technologies are generically known as the “second-generation”
biofuel technologies, and research in this field has become increasingly active in recent years (Table 3). This is especially true of research in technologies for converting lignocellulose into ethanol at a low cost. Lignocellulose has not previously been widely used in biofuel production.
Lignocellulose is the main component of the plants cells in woods and caules (woody stems), and has the highest quantitative potential from the viewpoint of energy resources. It is composed mainly of cellulose, hemicellulose and lignin Table 3 : Second-generation biofuels
Type Designation Raw materials Production technologies
Bio-ethanol
1
stgeneration Conventional bio-ethanol Sugar beet (sugar) Cereals (starch)
Hydrolysis (saccharification) + fermentation
2
ndgeneration Cellulose-based bio-ethanol Woods and herbage (Lignocellulose)
Pretreatment
Hydrolysis (saccharification) + fermentation
Bio-diesel
1
stgeneration Fatty acid methyl ester (FAME)
Vegetable oil crops (e.g. rapeseed) Waste food oil
Pressure extraction + ester exchange
2
ndgeneration BTL (Biomass to Liquid) Woods and herbage
(Lignocellulose) Gasification + FT synthesis BHD (Bio-Hydrofined Diesel) Vegetable oil crops & animal fats Hydrogenolysis
Prepared by the STFC based on References
[15-16](Figure 4).
However, while there are simple technologies for conver ting sacchar ides and starches in relatively wide use, there are no practical technologies for converting lignocellulose into ethanol
[4]. If a suitable technology for converting lignocellulose into ethanol is developed, not only the starches and saccharides produced by cereals, but all parts of the plant including their stems and leaves, and also grasses and trees, will be effectively used as raw materials for producing ethanol. Thus, the amount of natural resources available for producing biofuels will be significantly increased. In the U.S.A. and Europe, therefore, much attention is concentrated on research on technologies for converting lignocellulose into ethanol.
2-4 Potential of biofuels in Japan
Here, the potential of biofuels in Japan is considered i n ter ms of qu a ntit y a nd cost.
The Biomass Japan Comprehensive Strategy Promotion Council estimates that it will be possible to produce 6 million kl/year of ethanol using domestic biomass resources in Japan (Table 4). To avoid competition with food production, it is supposed that non-food herbage-based biomass such as straw, and wood-based biomass such as the residual woods in forest lands will be used as raw materials for producing ethanol and that energy crops, such as rice and sorghum, will be grown on currently unused land.
In addition, the case for importing ethanol p r o d u ce d ove r s e a s a s we l l a s p r o d u c i n g ethanol domestically using biomass resources
Cell wall
Plant cell
[Plant cell wall structure]
Microfibril forms a layered mesh
Single microfibril
Higher-order structure of microfibril
Lignin
Hemicellulose Semi-crystal
cellulose Crystal cellulose
Crystal cellulose
Cellobiose Glucose
Cellulose molecule
Figure 4 : Plant fiber structure and lignocellulose
From Reference
[16]Table 4 : Presumption of Japan’s domestic biofuel supply under the Biomass Japan Comprehensive Strategy Promotion Council
Raw materials Predicted Production (FY2030)
Ethanol equivalent kl Crude oil equivalent kl 1. Sugar and starch (by-products in food production processes and sub-
standard agricultural products) 50 thousand kl 30 thousand kl
2. Herbage (such as rice straw and wheat straw) 1,800 to 2,000 thousand kl 1,100 to 1,200 thousand kl 3. Energy crops (such as rice and sugar beet) 2,000 to 2,200 thousand kl 1,200 to 1,300 thousand kl 4. Woods (such as waste construction materials and residual timber from
forest lands) 2,000 to 2,200 thousand kl 1,200 to 1,300 thousand kl
5. Bio-diesel fuels 100 to 200 thousand kl 60 to 120 thousand kl
Total Approx. 6,000 thousand kl Approx. 3,600 thousand kl
From Reference
[9]is considered. A comparison of the two cases is shown in Figure 5. Bio-ethanol fuels which can compete with gasoline in price have already been distributed in the U.S.A. and Brazil, countries which are more advanced in terms of biofuels.
In assessing the economics of importing bio- ethanol fuels from these countries, it is of course necessary to add to their prices the overhead costs of importing and distributing the fuel, customs charges on the imported fuels, and the investment costs for an ethanol distribution i n frastr ucture. However, even when these costs are added to the prices for bio-ethanol fuels produced either in the U.S.A from corn or from sugar cane in Brazil, the lower limit of the estimated price range for ethanol fuels is lower than the gasoline prices in Japan, and prices are sufficiently competitive with the latter. In
contrast, if ethanol is produced in Japan on the same scale as in the U.S.A. and Brazil using wheat as the cheapest edible cereal produced in Japan (at the price of 164 yen/kg), its price is estimated to equal or exceed 450 yen/l excluding gasoline tax. At these prices Japanese produced bio-ethanol would not be cost competitive with gasoline and the ethanol fuels produced overseas.
If ethanol is produced domestically in Japan, using domestic irregular rice not suitable for human consumption as a raw material (at the price of 20 yen/kg), its price without gasoline tax may be almost competitive with the prices for overseas produced ethanol and gasoline. The amount of irregular rice would have been limited in Japan and would not fill up the demand of bio- ethanol fuel. However, if non-edible rice, whose taste and appearance are not taken into account,
Ye n/l
Imported from U.S.A. Imported from Brazil Japan’s domestic production
Corn
(lowest price) Corn
(highest price) Cellulose
(in 2005) Cellulose
(in 2012) Sugar cane (lowest price) Domestic prices of gasoline (upper and lower limits for the past 3 years)
Sugar cane
(highest price) Super-
sorghum Wheat Feed rice Non-edible rice
Gasoline tax
Additional investment in infrastructure Domestic distribution
Costoms
Import and distribution Manufacture
Raw materials
Figure 5 : Breakdown price comparison between import and domestic production of bio-ethanol in Japan [Assumptions used in the calculations]
i) Corn produced in the U.S.A.: The upper and lower limits of the prices for ethanol produced in the U.S.A. (free on oil tank yard) for the past 3 years. Plant capacity: 263 thousand kl/year. Ethanol made in U.S.A was transported by 1.9 DT chemical tankers. $1 = ¥120.
Alcohol customs tariff: 23.8%.
ii) Cellulose produced in the U.S.A.: The costs for raw materials and manufacture are based on the real prices in 2005 and the US Dept. of Energy target values for 2012. The other values are as in Item i) above.
iii) Sugar cane produced in Brazil: The upper and lower limits of the prices for ethanol imported from Brazil (free on oil tank yard) for the past 3 years. The other values are as in Item i) above.
iv) Domestic wheat and feed rice: The costs for raw materials are based on the statistics provided by the Ministry of Agriculture, Forestry and Fisheries. Plant capacity: 36 thousand kl/year.
v) Non-edible rice: Based on a large-scale production model on a reclaimed land located in the Prefecture of Mie. The unpolished-rice harvest process was used. Rice hulls and straw were effectively used. The manufacturing costs are based on the US Dept. of Energy target values for 2012 as in Item ii) above.
vi) Super-sorghum: High-yield “ultra-sorgo” based on Reference
[20]. The manufacturing costs are based on the US Dept. of Energy target values for 2012 as mentioned in Item ii) above.
Prepared by the STFC based on References
[17-20]is mass-produced domestically (at a price of 15 yen/kg) and if effective technologies for using the lignocellulose in the whole rice plant are developed, it is estimated that the price (without gasoline tax) for ethanol produced domestically f r om non - e d i ble r ice m ay b e s u f f ic ie nt l y competitive with the price of gasoline. Thus, the supply of domestic ethanol will be achievable on an economic and profitable basis, if Japan can satisfy the requirements for ethanol production already prevailing in the U.S.A. and Europe;
these include “innovative technologies for conversion of biomass into ethanol”, “the large- scale production of raw materials” and “fuel tax incentive system”.
However, realistically, the ability of Japan to satisfy the requirements for the agricultural lands required for the large-scale production of raw materials, is limited
[10]. The total area of unused agricultural lands which could be available to cultivate energy crops is 390 thousand ha (Table 5), of which about 80% is in small scattered lots not greater than 5 ha in size
[21].
To achieve large-scale introduction of biofuels into Japan, the importation of overseas-produced ethanol must also be considered. However, it should be noted that the ethanol price volatilities in the U.S.A and Brazil have been extremely large, compared with the gasoline prices, for the past three years. The reasons must be that raw materials for ethanol production are limited to corn in the U.S.A and to sugar cane in Brazil, that the production of these materials depends on
regional weather conditions and natural disasters, and the prices of these materials are liable to be volatile as speculation-driven futures markets.
In the U.S.A., R&D efforts have been actively made to develop second-generation biofuel technologies in order to diversif y the range of raw materials, including lignocellulose, for ethanol production and consequently to ensure a stable supply of biofuels at a cost comparable to that for corn-based ethanol.
From the shor t-term viewpoint of energ y secur it y, it is i mpor tant for Japan to make ef for t s to develop a nd d iver si f y domestic energy resources, such as improving the use of conventional fossil fuels, and increasing Japanese interests for developping overseas agricultural land for energy crops. To secure the projects in overseas, there is a long-term need for Japan to increase R&D efforts in developing its own second-generation biofuel technologies that cannot be provided by other countries, especially those rich in biomass resources.
3 Trends and problems in the development of second- generation biofuel technologies
This chapter describes trends in the R& D efforts aimed at overcoming the major barriers to the development of second-generation biofuel technologies. The R&D areas can be roughly classified into following 3 types.
Table 5 : Land use in Japan Mountainous lands 25 million ha
Natural forests 15 million ha
Artificial forests 10 million ha Forests in service 3.3 million ha
Unused forests 6.7 million ha
Flat lands 13 million ha
Agricultural lands 4.7 million ha
Paddy fields 1.6 million ha
Production-adjusted land 1.0 million ha Non-paddy fields and pastures 2.1 million ha Lakes, ponds, rivers and channels 1.3 million ha
Roads 1.3 million ha
Housing lands 1.8 million ha
Others 3.9 million ha
(including 0.39 million ha of unused agricultural lands)
Prepared by the STFC based on References
[22-23]3-1 Energy crop production technology
Energy crops can be roughly classified into cereals, herbage (soft biomass), woods (hard biomass) and oil plants and can be compared in terms of dry matter yield per unit area of land. Within each of these classifications there are several candidates for use as energy crops (Table 6). Unlike edible crops, energy crops are primarily required to maximize dry matter yields per unit input of energy used to grow the crop with the lowest possible production costs;
they do not need to satisfy any requirement for taste, color or shape quality. To minimize the
competition for land between energy crop and edible crop production, it is assumed that energy crops can be produced on less fertile lands than edible crops. There is a large accumulation of research on increasing the production of edible crops and improving their resistance to adverse environmental influences. However, whether or not this accumulated knowledge can be effectively used for the production of energy crops is likely to depend on the weather and soil conditions of agricultural lands supposed to use for energy crops. It is unlikely that energy crops can be produced on the lands that suffer
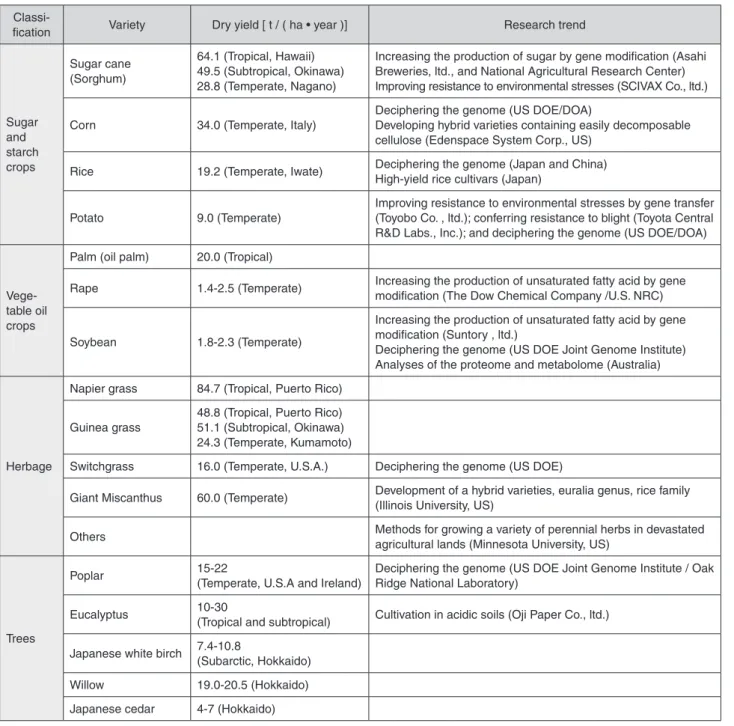
Table 6 : Representative energy crops and research and development trends Classi-
fication Variety Dry yield [ t / ( ha • year )] Research trend
Sugar and starch crops
Sugar cane (Sorghum)
64.1 (Tropical, Hawaii) 49.5 (Subtropical, Okinawa) 28.8 (Temperate, Nagano)
Increasing the production of sugar by gene modification (Asahi Breweries, ltd., and National Agricultural Research Center) Improving resistance to environmental stresses (SCIVAX Co., ltd.) Corn 34.0 (Temperate, Italy)
Deciphering the genome (US DOE/DOA)
Developing hybrid varieties containing easily decomposable cellulose (Edenspace System Corp., US)
Rice 19.2 (Temperate, Iwate) Deciphering the genome (Japan and China) High-yield rice cultivars (Japan)
Potato 9.0 (Temperate)
Improving resistance to environmental stresses by gene transfer (Toyobo Co. , ltd.); conferring resistance to blight (Toyota Central R&D Labs., Inc.); and deciphering the genome (US DOE/DOA)
Vege- table oil crops
Palm (oil palm) 20.0 (Tropical)
Rape 1.4-2.5 (Temperate) Increasing the production of unsaturated fatty acid by gene modification (The Dow Chemical Company /U.S. NRC)
Soybean 1.8-2.3 (Temperate)
Increasing the production of unsaturated fatty acid by gene modification (Suntory , ltd.)
Deciphering the genome (US DOE Joint Genome Institute) Analyses of the proteome and metabolome (Australia)
Herbage
Napier grass 84.7 (Tropical, Puerto Rico) Guinea grass
48.8 (Tropical, Puerto Rico) 51.1 (Subtropical, Okinawa) 24.3 (Temperate, Kumamoto)
Switchgrass 16.0 (Temperate, U.S.A.) Deciphering the genome (US DOE)
Giant Miscanthus 60.0 (Temperate) Development of a hybrid varieties, euralia genus, rice family (Illinois University, US)
Others Methods for growing a variety of perennial herbs in devastated
agricultural lands (Minnesota University, US)
Trees
Poplar 15-22
(Temperate, U.S.A and Ireland)
Deciphering the genome (US DOE Joint Genome Institute / Oak Ridge National Laboratory)
Eucalyptus 10-30
(Tropical and subtropical) Cultivation in acidic soils (Oji Paper Co., ltd.) Japanese white birch 7.4-10.8
(Subarctic, Hokkaido)
Willow 19.0-20.5 (Hokkaido)
Japanese cedar 4-7 (Hokkaido)
Prepared by the STFC based on References
[4,24-29]from extremely dr y weather and those that are deteriorated by salt contamination. On the contrary, lands selected as candidates for energy crop production require soils which are not too acidic or alkaline soils and which have a reliable precipitation level. It is expected that unused agricultural lands which can meet these requirements exist around the world. In the future, it is urgently necessary for Japan to establish the requirements (in terms of weather and soil) that domestic and international lands must be suitable for production of energy crops, and to identify the targeted lands that meet these requirements for efficient research activity.
T h e r e a r e t wo m a i n r e s e a r c h a r e a s o f improving energy crop dry matter production.
One is the molecular biological approach to understanding the nutritive mechanisms of crops in research conducted to improve plant varieties so as to be adaptable to deteriorated lands. Recently, a research team in the University of Tokyo investigated the nutritive mechanism of iron in deteriorated soil, and published a report on the development of a high-productivity crop by gene modification. The report attracted widespread attention
[23].
T he s econd approach i s to i mprove t he su it abi l it y of va r ieties of crops for use i n commercializing the technology used to convert lignocellulose into ethanol. Specifically, research
in the U.S.A. has actively focused on increasing the dry matter yields of cereal plants other than their edible parts and on modifying the structures of plants to make them more easily converted to ethanol.
3-2 Lignocellulose-to-ethanol conversion technologies [3,4]
To m a nu f a c t u r e bio - e t h a nol f u el s f r om lignocellulose, it is necessary to add several processes to treat the plant material before the fermentation step used to produce ethanol (Figure 6). These processes are required to produce the starches and saccharides that are fermented into ethanol and include pre-treatment to unravel plant fibers, a process to convert cellulose and hemicellulose to saccharides (saccharification), and a process to remove lignin unnecessary for the fermentation to ethanol.
Sugar provided by conventional sugar and starch crops consists mainly of C6 saccharides such as glucose. If lignocellulose is saccharified, however, the product contains C6 saccharides and C5 saccharides such as xylose in the ratios of 2:1-3:1. Some of the conventional ferments have the disadvantage of not being able to ferment C5 saccharides, while others may restrict the fermentability of C5 saccharides in the presence of C6 sacchar ides. T hus, the conventional technologies cannot effectively use the saccharic
Herbs
Woods
Lignocellulose
Cellulose
Sugar cane Starch
Saccari- fication
Corn and other plants
Hemicellulose
Lignin
Pre-treatment (separation) Distillation and deh ydratio n
Sacchar ification F er m entation Ethanol
C6 Saccha-
rides
C5 Saccha-
rides
Thermal effective use
Conventional ethanol production technology
Figure 6 : Lignocellulose-to-ethanol conversion processes
Prepared by the STFC based on References
[4,10]components of lignocellulose.
A s a r e s u l t , p r e s e n t c o m m e r c i a l i z e d technologies cannot produce lignocellulose based bio-ethanol fuels in a manner competitive with fossil fuels in terms of energy efficiency, production costs and environmental load.
I n r e v i e w i n g v a r i o u s t e c h n o l o g i e s f o r converting lignocellulose into ethanol, the key factors in identifying and optimizing the best technology are (1) higher efficiency and lower cost of the pre-treatment and saccharification
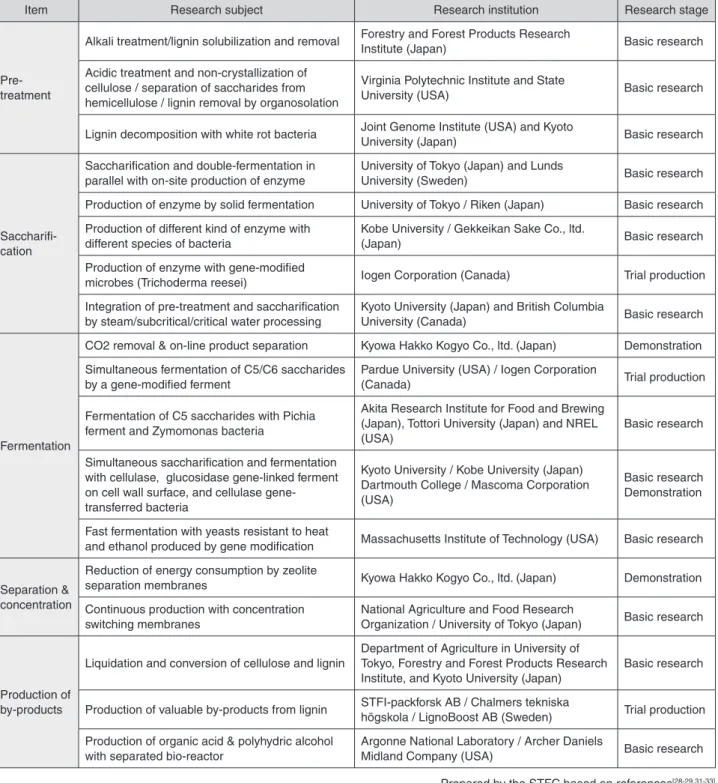
processes and (2) h igher ef f icienc y i n the fermentation process. Therefore, these factors have been reviewed (Table 7).
To achieve the twin goals of higher efficiency and lower cost of the pre-treatment for the saccharification processes, the conventional acid hyd rolysi s process i s bei ng repl aced with a promising new technique, “enzymatic saccharification” (Figure 7). The new technique can decompose cellulose by using speci fic enzymes, cellulases, under moderate conditions
Table 7 : Research on second-generation conversion technologies for lignocellulose-based ethanol fuels
Item Research subject Research institution Research stage
Pre- treatment
Alkali treatment/lignin solubilization and removal Forestry and Forest Products Research
Institute (Japan) Basic research
Acidic treatment and non-crystallization of cellulose / separation of saccharides from hemicellulose / lignin removal by organosolation
Virginia Polytechnic Institute and State
University (USA) Basic research
Lignin decomposition with white rot bacteria Joint Genome Institute (USA) and Kyoto
University (Japan) Basic research
Saccharifi- cation
Saccharification and double-fermentation in parallel with on-site production of enzyme
University of Tokyo (Japan) and Lunds
University (Sweden) Basic research
Production of enzyme by solid fermentation University of Tokyo / Riken (Japan) Basic research Production of different kind of enzyme with
different species of bacteria
Kobe University / Gekkeikan Sake Co., ltd.
(Japan) Basic research
Production of enzyme with gene-modified
microbes (Trichoderma reesei) Iogen Corporation (Canada) Trial production Integration of pre-treatment and saccharification
by steam/subcritical/critical water processing
Kyoto University (Japan) and British Columbia
University (Canada) Basic research
Fermentation
CO2 removal & on-line product separation Kyowa Hakko Kogyo Co., ltd. (Japan) Demonstration Simultaneous fermentation of C5/C6 saccharides
by a gene-modified ferment
Pardue University (USA) / Iogen Corporation
(Canada) Trial production
Fermentation of C5 saccharides with Pichia ferment and Zymomonas bacteria
Akita Research Institute for Food and Brewing (Japan), Tottori University (Japan) and NREL (USA)
Basic research Simultaneous saccharification and fermentation
with cellulase, glucosidase gene-linked ferment on cell wall surface, and cellulase gene- transferred bacteria
Kyoto University / Kobe University (Japan) Dartmouth College / Mascoma Corporation (USA)
Basic research Demonstration Fast fermentation with yeasts resistant to heat
and ethanol produced by gene modification Massachusetts Institute of Technology (USA) Basic research
Separation &
concentration
Reduction of energy consumption by zeolite
separation membranes Kyowa Hakko Kogyo Co., ltd. (Japan) Demonstration
Continuous production with concentration switching membranes
National Agriculture and Food Research
Organization / University of Tokyo (Japan) Basic research
Production of by-products
Liquidation and conversion of cellulose and lignin
Department of Agriculture in University of Tokyo, Forestry and Forest Products Research Institute, and Kyoto University (Japan)
Basic research
Production of valuable by-products from lignin STFI-packforsk AB / Chalmers tekniska
högskola / LignoBoost AB (Sweden) Trial production Production of organic acid & polyhydric alcohol
with separated bio-reactor
Argonne National Laboratory / Archer Daniels
Midland Company (USA) Basic research
Prepared by the STFC based on references
[28-29,31-33]to produce saccharides, and are more energy efficient than acid hydrolysis. Strains of bacteria which could produce useful cellulases have been detected among the bacteria present in the internal organs of plant-eating animals and the bodies of white ants. Fungi producing cellulases are common in leaf mold. Gene modification technologies have been used in attempts to improve the efficiency of enzyme production
[3].
T h e d i s c o v e r y o f t h e c e l l u l o s o m e , a n exocellular multiprotein complex specialized i n cel lu lose deg r adation, lead to resea rch becoming increasingly focused on the use of gene modification technology in the creation of complex plural enzyme function modules r e q u i r e d i n t h e ce l l w a l l d e co mp o s i t i o n process
[37].
To a c h i e v e a h i g h e r e f f i c i e n c y i n t h e fer mentation process, fer ments wh ich can simultaneously ferment C5 and C6 saccharides have been subjected to gene modi f ication technology linking a sacharifying enzyme with the surface layer of a second enzyme, with the aim of developing ferments which have a high resistance to ethanol and heat, and which can
simultaneously undertake both saccharification and fermentation.
In the U.S.A. greater importance has been attached to the use of molecular genetics (Figure 8) to rapidly improve the productivity and reduce the cost of using enzyme technologies (Figure 9). To obtain new useful microbes, enzymes and metabolic routes, and to establish the enzymatic hydrolysis method, R& D effor ts have been actively made to understand the genome/protein/
metabolic mechanism linkages and to create a database of these mechanisms by using rapid analyzers and simulation techniques.
For example, a large enzyme manufacturer and the National Renewable Energy Laboratory (NREL) in the U.S.A published a report on the results of research aimed at understanding the interaction of cellulose and the enzyme (cellulase), par ticularly the active point of decomposition in the high- order str ucture of cellulose, with the intention of producing more ac t ive cel lu l a s e s at a lower cost
[16 ]. Today, a venture business supported by the US Department of Energy (DOE) is conducting preliminary testing prior to launching into the
Structure of endoglucanase (EG) Structure of cellobiohydrolase I (CBH I)
Core domain
Reduction end
Linker Cellulose linking domain
Cellulose microfibril
Glucose
Cellobiose glucosidase
Cellobiohydrolase
Decomposition Decomposition
Non-reduction end
(non-crystalline) Crystalline section Crystalline section Reduction end (non-crystalline) Endo-glucanase
Non-crystalline section
Cellobiohydrolase
Cellobiose glucosidase
Glucose
Figure 7 : Cellulase enzymes and the bio-chemical cellulose decomposing mechanism
Prepared by the STFC based on References
[3,34-35]industrial production of cellulase and cellulosic ethanol. The knowledge obtained from these R& D efforts is now being fed back into the research aimed at improving plant varieties so that they are more easily decomposed.
3-3 Bio-diesel fuel-related technologies
Fatty acid methyl ester ( FA ME) produced from plant oils is now used as a bio-diesel fuel (BDF) and is actively commercialized, mainly in Europe and East South Asia. However, FAME has disadvantages in that it is prone to oxidization
Selling pr ice fo r ethanol ($/gallon)
Enzyme
Conversion
Yield, 65 gallons/t
Raw material
Raw material, $53/t
Present situation Future targets
Raw material, $45/t Raw material, $30/t The current
lowest price,
$2.26/gallon
Yield, 75 gallons/t
Yield, 94 gallons/t Target cost,
$1.07/gallon
in 2012 Target cost,
$0.59/gallon in 2020
Figure 8 : US Dept. of Energy target costs for cellulosic ethanol
From Reference
[36]Dept. of Energy Joint Genome Laboratory
Analysis of genome sequences in microbes and plants used for lignocellulose conversion
Genomes define biological structures and functions on all scales ranging from genes to the ecosystem
Production of protein Analysis and production of the cell wall structure encoded in its genome
Molecular machine Understanding of molecular machine formation process and functions
Proteomics
Understanding of the in vivo cell mechanism of responding to an environmental signal
Cell system
Research on the predictive understanding of cells and their community
Ecosystem
Community
Cell
Molecular machine
Protein
Gene Microbial genome
Figure 9 : Molecular biology research on bio-ethanol production in the U.S.A (DOE)
From Reference
[36]and it has a low stability during storage. In addition, the properties of this fuel depend on the source plant oils and fat materials used in its manufacture. Some materials are so easily solidified that they cannot be used during winter in regions at medium and high latitudes. Thus, FAME presents many disadvantages in terms of distribution, which prevents the widespread use of this fuel.
In developi ng second- generation biof uel technologies, the main challenge is to convert a variety of plant oils and fat materials into BDF that has stable properties. The second-generation BDF technologies which are now proposed are roughly divided into 2 types, Biomass to Liquid (BTL) and Bio-Hydrofined Diesel (BHD) (Figure 10). In recent years, the industrial practicality of BHD technology has been demonstrated and the technology is approaching the commercialization stage earlier than the lignocellulose-to-ethanol conversion technology.
3-4 Comparison of research trends in countries by analysis of published research papers
The number of scientific and technological papers published on biofuel-related technologies has rapidly increased in all countries since 1990. T he nu mber of papers publ ished on research on ethanol, BDF and energy crops has been highest in the EU-15 countries and the U.S.A. (Figure 11). The difference between the number of publications of the EU-15 countries and the U.S.A. and that of all other countries has rapidly increased, especially since the 1990s. In the U.S.A., the amended Clean Air Act, which stipulates the obligation of adding ox ygen-
containing compounds to vehicle fuels to reduce carbon monoxide emissions, was enforced in 1990 and since then the demand for ethanol has rapidly increased
[39]. It is apparent that this act was a major factor influencing the increase in research activity into biofuels since the 1990s.
In China, the number of papers published has increased rapidly since 2000. As a result, the number of papers published on research on bio- ethanol, BDF and energy crops was higher in 2006 in China than in Japan. In China, priority has been given to research and development of biofuels under the “National Project for High- Technology Research and Development Program of Ch i na (8 63 P rog r a m)”, i mplement ation of which started in Januar y 1986
[40 ]. Under the “Ethanol-Mi xed Gasol i ne Development Project” introduced in the “10
th5-Year Plan” in 2001, a model project for introducing ethanol- blended gasoline was implemented and the law supporting the project was established. Under the “11
th5-Year Plan” in 2006, renewable energy development was introduced as the priority area in the National Energy Strategy. The Chinese Government also en forced the “Renewable Energy Law of the People’s Republic of China” in 2006, ahead of the other Asian countries, and the policy of raising the share of renewable energy, especially biomass, up to 16% of the total supply of primary energy by 2020 was established under the “Middle and Long-Term Development Plan of Renewable Energies”
[41]. In this context, it is probable that research on biofuels will become increasingly active in China.
In Brazil and Canada, research is focused on mainly bio-ethanol production. In recent years, however, research on BDF has also been more
(a) Biomass to Liquid (BTL) (b) Bio Hydrofined Diesel (BHD)
Biomass (Coal) FT Syn-thesis
(N at ur al g as )
Gasifi- cation and decom- position
FT Syn- thesis
Kerosene distillate
Light oil distillate
P alm oi l (P etroleum-
based mater
ials)
Hydro- genolysis
LPG
Gasoline distillate Kerosene distillate Light oil distillate
Figure 10 : Comparison of the two second-generation bio-diesel fuel technologies
Prepared by the STFC based on Reference
[38]actively pursued.
A comparison by region has been made in the number of papers published on the various disciplines in lignocellulose-to-ethanol conversion technologies. This shows that, while Japan, the U.S.A. and the EU are almost level pegging in the fields of chemical engineering and applied chemistry, the U.S.A. and the EU are outstripping Japan in the fields of biotechnology, molecular biology and microbiology (Figure 12). Although Japan was considered to be strong in the field of microbiology, especially fermentation
[42,43],
it has not applied this strength sufficiently to research on lignocellulose-to-ethanol conversion technologies.
The U.S.A. accounted for the majority of the research institutions that published the greatest numbers of papers in each field. However, it should be noted that Lunds University in Sweden and the University of British Columbia in Canada ranked above US research institutions in the field of lignocellulose-to-ethanol conversion technologies (Table 8). It is notable that the two universities have not only conducted advanced
Number of papers
USA Japan Canada China Brazil EU-15 countries
(a) Bio-ethanol
Year
Number of papers
USA Japan Canada China Brazil EU-15 countries
Year (b) Bio-diesel
Number of papers
USA Japan Canada China Brazil EU-15 countries
(c) Energy crops Year
![Figure 2 : Raw materials and use for biomass-related technologies Prepared by the STFC based on Reference [6]](https://thumb-ap.123doks.com/thumbv2/123deta/6927065.2265924/2.892.215.680.883.1134/figure-materials-biomass-related-technologies-prepared-stfc-reference.webp)


![Figure 5 : Breakdown price comparison between import and domestic production of bio-ethanol in Japan [Assumptions used in the calculations]](https://thumb-ap.123doks.com/thumbv2/123deta/6927065.2265924/8.892.84.811.508.936/figure-breakdown-comparison-domestic-production-ethanol-assumptions-calculations.webp)