Apartment Building through IM & VR
著者 Jun Imaizumi
journal or
publication title
International Review for Spatial Planning and Sustainable Development
volume 5
number 1
page range 45‑54
year 2017‑01‑15
URL http://hdl.handle.net/2297/46730
doi: 10.14246/irspsd.5.1_45
45
International review for spatial planning and sustainable development, Vol.5 No.1 (2017), 45-54 ISSN: 2187-3666 (online)
DOI: http://dx.doi.org/10.14246/irspsd.5.1_45
Copyright@SPSD Press from 2010, SPSD Press, Kanazawa
Assessment of the Process for Designing an Apartment Building through IM & VR
Jun Imaizumi
1*1 UC-1 Development Group 1 Analysis Support Team, FORUM8 Co., Ltd.
* Corresponding Author, Email: [email protected] Received: Jan 22, 2016; Accepted: Oct 26, 2016
Key words: Design tool, Simulation, Computational Fluid Dynamics (CFD), Virtual Reality (VR), Cloud Computing type VR, Building Information Modeling (BIM)
Abstract: An increasing amount of attention worldwide has been diverted into using Building Information Modeling (BIM) tools and simulations via BIM models in the field of architecture. BIM modeling and the effective use of various types of numerical and quantitative simulation and analysis are used throughout architectural processes. Stakeholders of various parties can be better informed about projects and may offer their feedback in a more effective and rapid manner to foster better, but also speedy, decision-making, hence this type of technology is so important. In this paper, various types of software and solutions based on Information Modeling (IM) and Virtual Reality (VR) are utilized in the design of a company dormitory. Simulations via a BIM model are performed and a cloud-based 3D Virtual Reality is used for consensus building. This paper examines the detailed process of the project, the effectiveness of feedback on the design, and the process of reaching consensus. In addition to what has already been done or what is currently available, this paper also presents a summary of what will be offered in the future in terms of BIM modeling, environment simulation, and VR simulation, collectively.
1. INTRODUCTION
An increasing amount of attention worldwide has been diverted into using Building Information Modeling (BIM) tools and simulations via BIM modeling in the field of architecture. BIM modeling and the effective use of various types of numerical and quantitative simulation and analysis are used throughout architectural processes. Stakeholders of various parties can be better informed about projects and offer their feedback in a more effective and rapid manner to foster better, but also speedy, decision-making, hence this type of technology is so important.
A company dormitory (FORUM8 Takanawa House) is planned to be
constructed at Takanawa-3-Chome, Shinagawa-ku, located near Shinagawa
Station which is accessible by train, approximately 10 minutes from Tokyo
Station. The site on which the company dormitory building is planned to be
constructed has an area of 170.27m
2and is located within one of the
residential zones of Central Tokyo. The apartment building (company dormitory) will have a total floor space of 400m
2with three floors above ground and one underground floor, and will accommodate nine residents in total. In addition, some public empty spaces are currently planned to be reserved for business meetings/presentations.
In this paper, various types of software and solutions based on Information Modeling (IM) and Virtual Reality (VR) will be utilized during the design process. Simulations via a BIM model will be performed and a cloud-based 3D Virtual Reality is used for consensus building. In the design process, BIM modeling, wind analysis, energy analysis, construction simulation, flood/evacuation simulation, examination of the design using 3D VR, and open discussion via Cloud Computing type VR for consensus building were planned and put into practice. In addition, the implementation of Building Environment and Energy Management System (BEMS), or Smart House, technology is also under consideration.
Recently, many researchers have focused their development or application of IM and VR on urban planning and design. For example, Shen and Kawakami (2010) proposed an online urban aesthetic design and visualization application. Lorentzen, Kobayashi, and Ito (2009) reported case studies incorporating a 3D VR system. Fukuda et al. (2011) examined the usability of a cloud-based VR as an urban planning support tool. Imaizumi, J (2010) and Imaizumi, J. et al. (2011) reported a design process using BIM, VR and other simulations for competition. Shen et al. (2013) proposed an Urban Design Support System based on 3DVIA software and Google Earth to support urban design. Wang, Yan, and Liao (2013) proposed low carbon design and planning concepts in urban planning. Guan et al. (2013) reported usage of point cloud data in a cloud computing environment.
Having introduced the existing research, it can be argued that a 3D VR has the potential to bring several major changes to the architectural design and consensus building process.
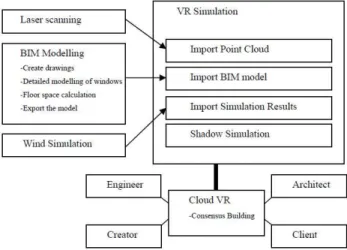
Therefore, this paper will examine the detailed processes of a project, the effectiveness of feedback on the architectural design, and the process in reaching consensus. In addition to what has been done or currently available, this research will also suggest a summary of what will be offered in the future in terms of BIM modeling, environment simulation, and VR simulation, collectively. Figure 1, below, illustrates the workflow for the apartment building.
Figure 1. The workflow of Design Process through IM and VR
Imaizumi 47
2. BIM MODELING
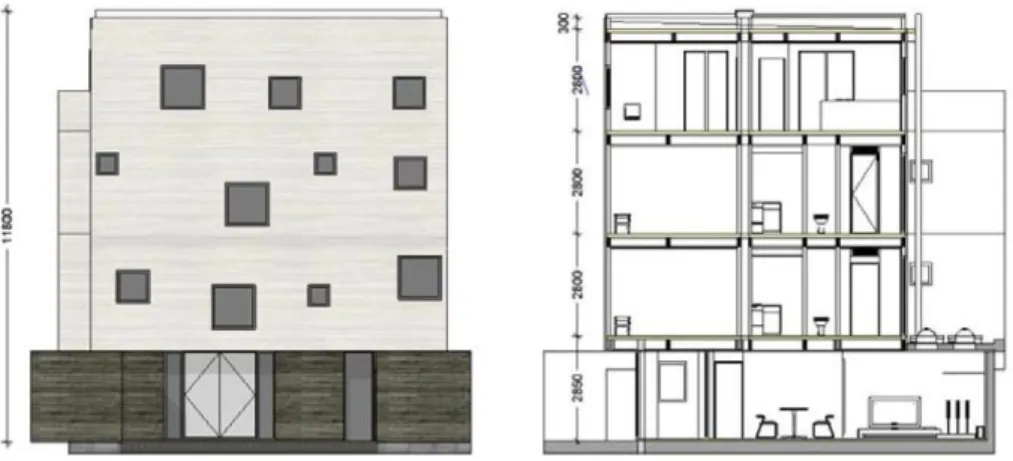
As part of BIM, the building was constructed using an integrated BIM solution, Allplan (developed by Nemetschek Allplan Deutschland GmbH), and designed by IKDS (Ikeda Kokubun Design Studio). Figure 2 shows a rendered image of the building.
Figure 2. Rendered image of the appearance of the building
2.1 Creating floor plan, section and elevation views of the building
Based on the 3D BIM model, the floor plan, section and elevation views were automatically created. 3D modeling can also be performed with the same intuition derived as if drawing a floor plan. Section and elevation views were created using the “Associative view” function. Figure 3 shows elevation and section views of the building. However, when creating the section map was attempted, two technical difficulties with the software were observed. If the associate view of a file contains another associate view, or if the scales are different, the walls on the further side of the section map, as well as the windows on the wall, are not properly displayed.
Figure 3. Elevation and section views of the building that are automatically generated by Allplan
2.2 Font BIM modeling and calculation
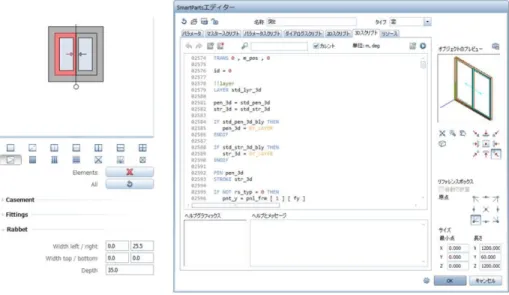
In this research, we used dedicated BIM tools, “Wall” and “Door, Window” in Allplan for the 3D modeling. In the case of windows, we also made use of the more flexible customization function, SmartPart, and provided detailed information to the design studio. In the SmartPart editor window, various elements such as a window’s frame, sash, direction of opening, or material, can be customized, to create a customized design.
Furthermore, by editing the scripts in SmartPart, the shape can also be altered at will. Most window design tools do not support the “double sliding window” that is more common-place in Japan. Figure 4 illustrates the editing window when changing the script in SmartPart, complete with the direction of the opening in accordance to the standards proposed by Japan Institute of Architects, via script editing.
Figure 4. Editing window when changing the script in SmartPart
2.3 Calculation of the legal floor space
Numerical calculations are performed by loading and customizing a
client report definition file template (.rdlc) from the Microsoft Visual Studio
Report Viewer, directly in Allplan. The numerical calculation is used mainly
for counting or computing the number of objects placed, the volume and the
surface area of the 3D object. In our project, we attempted to calculate the
floor area ratio to be used for calculating the legal floor space later. To do
this, we made some rooms and grouped them together into different groups
with Allplan’s “Room” function, and calculated the area of every group. We
also had edited the report definition file so that the rentable and non-rentable
areas are both displayed as shown in Figure 5. The “Room” function also
allows room to be defined by measuring its outer frame. Using these
functions, we have demonstrated that the data required for building
certification applications, such as the area of the firewall, net floor area, or
rentable area, can be generated and effectively used for rental services.
Imaizumi 49
Figure 5. A report customized for floor area calculation
2.4 Data export and coordination
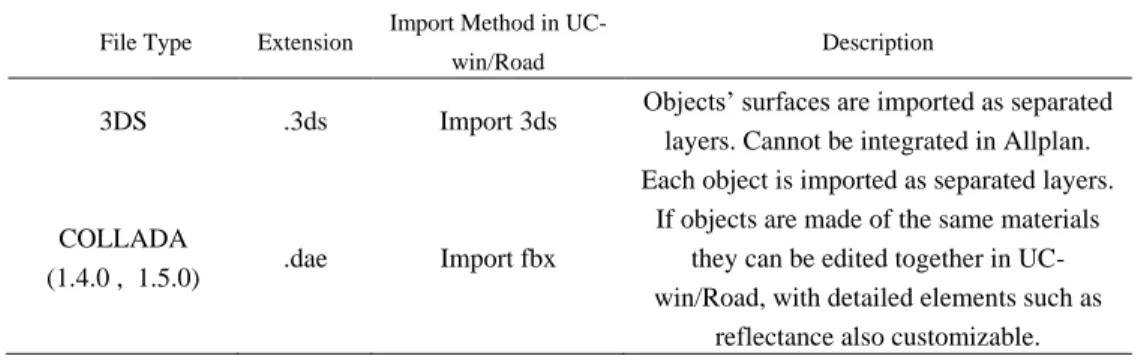
The model data created in Allplan can be imported into the Real-time Interactive 3D VR Simulation and Modeling Software UC-win/Road under the following format (see Table 1).
Table 1. Model data coordination between Allplan and UC-win/Road File Type Extension Import Method in UC-
win/Road Description
3DS .3ds Import 3ds Objects’ surfaces are imported as separated layers. Cannot be integrated in Allplan.
COLLADA
(1.4.0 , 1.5.0) .dae Import fbx
Each object is imported as separated layers.
If objects are made of the same materials they can be edited together in UC- win/Road, with detailed elements such as
reflectance also customizable.
If an object’s surface file (*.surf) or related picture files contain Japanese
text in the file names, then the .dae object itself or the texture may not be
imported properly. Also, if using texture exported from .3ds, then the texture
file name needs to be under eight half-width letters or numbers.
However, it should be noted that it is advisable to not have surfaces intersect or placed too close to each other when creating data inside Allplan.
In some cases, when such intersections are intended to represent multiple layers in the walls, in a 3D VR setting this may cause the surfaces to either clip through each other or cause fluttering.
3. ENVIRONMENTAL SIMULATION AND VR SIMULATION
3.1 Wind Analysis
Wind analysis was performed through simulation at an urban scale to verify how the prevailing wind changes its course and blows into the site.
The 3D geometry of the surrounding pieces of terrain, roads and buildings built by the 3D VR software were loaded into OpenFOAM, an all- purpose Computational Fluid Dynamics (CFD) tool, in order to perform wind analysis. As the time required to complete the wind analysis depends on the extent of the area to be analyzed and the size of the grids, an analysis was performed on a wide area extending 400m from North to South and 250m from West to East in the first phase, and then a more detailed analysis was performed by limiting the range to the area covering the building site alone in the second phase.
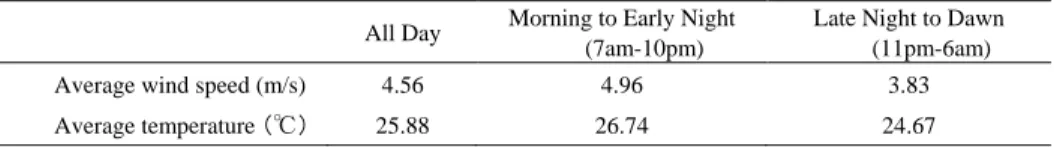
In the first phase, prevailing wind in the month of July (when the outside air can be substituted for an air conditioner to be used as draft or for natural ventilation), based on data from the Japan Meteorological Agency, was analyzed to determine its wind direction and average velocity, which were northward and 3.83 (m/s) as shown in Table 2, and the wind analysis was performed based on the table. Figure 6 shows the frequency of occurrence during sleeping hours (11pm - -6am), in July.
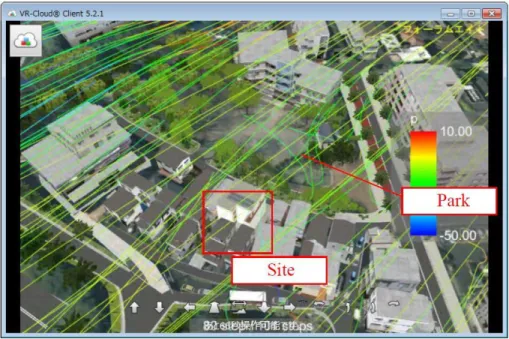
The results of the wind analysis were imported to the 3D VR space built by UC-win/Road for visualization. Figure 7 shows the image of results imported by 3D VR. There is a park north of the construction site. Since a park forms a depression amidst a group of buildings, the wind will tend to slow down as it reaches the building. This tendency was confirmed in the visualization. The second phase is planned for the near future.
Table 2. Wind speed and temperature in July, at Haneda
All Day Morning to Early Night (7am-10pm)
Late Night to Dawn (11pm-6am)
Average wind speed (m/s) 4.56 4.96 3.83
Average temperature (℃) 25.88 26.74 24.67
Imaizumi 51
Figure 6. Frequency of occurrence during sleeping hours (11pm-6am), in July
Figure 7. Phase One wind analysis (shown using VR-Cloud)
3.2 Sunshine and Shadow Simulation
Before acquiring the land, a sun shadow simulation was performed to
ensure the shadow of a high-rise building under construction adjacent to the
dormitory would not have any detrimental effects. While on paper this was
done and submitted during the winter solstice, in a VR setting the date and
time can be manipulated at will. This grants us the advantage of reviewing
sunlight and shadow regardless of the actual date. Figure 8 illustrates the sun
shadow simulation in VR.
Figure 8. Evaluation of sunshine and shadow
3.3 Point-cloud Modeling
3D laser scanning technology has often been used to get the point cloud model of buildings (Zhang et al., 2015). In order to further take into account other various elements inside VR, a 50m terrain mesh data was loaded into UC-win/Road, which was then used to build buildings and roads surrounding the construction site and position the surrounding trees in their correct geographic location based on onsite surveys and observations, all on top of the loaded terrain, to reproduce the surrounding environment realistically. Furthermore, point cloud data consisting of approximately 3 million points collected by 3D laser scanners from the surrounding area were loaded into UC-win/Road to be used as an accurate map on which to place models, or as a guide in understanding the terrain of the site and its surroundings as they are in the real world, as well as the detailed physical relationship between the site and the existing surrounding buildings. As for neighbouring fences, numerical values measured using one of the functions of the 3D laser scanner which can measure the distance between any two given points were used as a guide in BIM modeling. Figure 9 illustrates the measurement of a point cloud and the 3D model from the measured values.
Figure 9. Neighboring fence’s height is reflected in the BIM model
Imaizumi 53
3.4 Coordination via VR-Cloud
Simulation engineer, VR creator, company staff as client, and an architect who designed this building all utilized the VR-Cloud to have a proactive discussion amongst one another.
The building model was then reflected into the 3D VR cloud solution software, VR-Cloud, to achieve a higher degree of communication with the design studio over topics such as surrounding environments and wind analysis. Three different exterior design proposals were discussed and ultimately one was selected, as well as numerous variations to the internal design of the building, while editing and applying any changes or feedback directly into the VR-Cloud server in real-time. It is also possible to invite employees who may be living in the building to offer their opinions.
Essentially, this is a case of an unprecedented new process of design project planning, information sharing, and consensus building. Figure 10 shows different proposals of the external design.
Figure 10. Evaluation of the external design. Three different proposals and the one selected for adoption.
4. CONCLUSIONS
With BIM software, Allplan and its SmartPart script editing, as well as the customization of report templates, we were able to successfully design and recreate a Japanese-styled architecture in this case study. By successfully having imported models into UC-win/Road, we were also able to create some modeling tips that can be applied to future Allplan projects.
Furthermore, we have also demonstrated a hub software that is capable of providing numerous different types of simulation software data.
By having BIM aiding in the creation of a more efficient project planning
process, the time saved due to this higher efficiency can be reallocated into
further refinements to the original design to accomplish a project that is high
in added-values. While in this case study we only ended at the design phase, we have demonstrated how it is possible to achieve numerous complicated design considerations via IM and VR solutions. It can be argued that the bigger the scale of the project, the more the benefit that could be gained via such a solution.
The interactive VR software UC-win/Road has performed a pivotal role in the visualization of individual simulation and analysis results. With a 3D recreation of the simulation, it is much easier for us to relate it to reality and to have a better picture of what may truly result. Furthermore, since all simulations are done in real-time without delay, it is much easier to formulate feedback or comments. When further combined with a cloud- based VR, in this research, we have essentially accelerated the process of consensus building between various parties of stakeholders. The cloud-based VR system mentioned here will be further used during construction phase, as well as even after completion, and will have its 3D VR data updated according to each new status or proposal. While a cloud-based VR allows anyone the easy navigation throughout a virtual world, finding an intuitive way to display numerical or written data has been an area worth further investigation. We plan to develop a newer interface and features for displaying such information in future versions of the software.
REFERENCES
Fukuda, T., Taguchi, M., Shimizu, A., & Sun, L. (2011). "Capability of a Distributed and Synchronized Discussion by Using Cloud Computing Type Vr for Townscape Design".
Journal of Architecture and Planning (Transactions of AIJ), 76(670), 2395-2401.
Guan, H., Li, J., Zhong, L., Yongtao, Y., & Chapman, M. (2013). "Process Virtualization of Large-Scale Lidar Data in a Cloud Computing Environment". Computers & Geosciences, 60, 109-116.
Imaizumi, J. (2010). "Leveraging Vr Technology for Bim Design Process". Proceedings of The Association for Computer-Aided Architectural Design Research in Asia (CAADRIA), Hongkong.
Imaizumi, J., Ota, N., Taguchi, M., Tatsumi, M., Hirata, T., Kai, Y., . . . Kobayashi, Y.
(2011). "Build Live Tokyo2010 Teamf8w16 Media Art Center".
Lorentzen, T., Kobayashi, Y., & Ito, Y. (2009). "Virtual Reality for Consensus Building:
Case Studies". Proceedings of International Symposium on Smart Graphics, pp. 295-298.
Shen, Z., & Kawakami, M. (2010). "An Online Visualization Tool for Internet-Based Local Townscape Design". Computers, Environment and Urban Systems, 34(2), 104-116.
Shen, Z., Lei, Z., Li, X., & Sugihara, K. (2013). "Design Coordination Regarding Urban Design Guidelines Using Google Earth". International review for spatial planning and sustainable development, 1(3), 53-68.
Wang, H., Yan, X., & Liao, Q. (2013). "Integrating Low-Carbon Concepts in Urban Planning: Practices in Xiamen and Implications". International review for spatial planning and sustainable development, 1(3), 19-40.
Zhang, Y., Ying, Z., Shen, Z., Nishino, T., & Chen, X. (2015). "3d Laser Scanning Technology-Based Historic Building Mapping for Historic Preservation". International review for spatial planning and sustainable development, 3(2), 53-67.