53
International review for spatial planning and sustainable development, Vol.1 No.3 (2013), 53-68 ISSN: 2187-3666 (online)
Copyright@SPSD Press from 2010, SPSD Press, Kanazawa
Design Coordination Regarding Urban Design Guidelines Using Google Earth
Zhenjiang Shen1*, Zhenhan Lei1, Xuefei Li1, Kenichi Sugihara2
1 School of Environment Design, Kanazawa University
2 Gifu Keizai University
* Corresponding Author, Email: [email protected] Received 23 June 2012; Accepted 28 February 2013
Key words: Google Earth; Digital City; Urban Planning Guideline; User Understanding;
Virtual Reality
Abstract: Our study targeted representative urban design guidelines to enhance public understanding. In particular, we concentrated on developing a tool for stakeholders to improve their understanding of urban design guidelines determined by related laws and regulations. In this paper, we suggest that Google Earth can not only display a detailed district plan of the urban design guidelines or related documents but can also offer a possible method for stakeholders to experience the planning site from anywhere via the Internet.
Stakeholders can refer to other planning projects on Google Earth at the same time. Thus, urban design guidelines can be more intuitive and dramatic to both professional planners and stakeholders.
1. INTRODUCTION
In this work, we employed Google Earth as a visualization tool to represent planning and design guidelines of an urban planning site in order to improve the presentation of planning alternatives for public understanding and design coordination with stakeholders. Design coordination through public participation is very important to the success of an urban planning project since any project will ultimately become part of the life of the public (Kingston et al., 2000; Warren-Kretzschmar and Tiedtke, 2005). The earlier and more involved the public in an urban planning project, the more likely the project will succeed. Greater public participation in the planning process is a political goal in European countries that citizens have grown to expect (Hetherington et al., 2007).
In European countries, local authorities are increasingly required to make urban planning data available electronically, primarily over the Internet (Märker and Pipek, 2000). The use of computer science technology has been proven to enhance public participation in the urban planning process (Lai et al., 2011) by expanding the quality and quantity of interaction between planners and the public. The Internet is undoubtedly the best way of sharing urban planning information and the best platform for participation.
Traditionally, the communication of planning proposals was facilitated by the use of paper-based planning drawings in planning meetings. More recently, urban planning documents have been produced in read-only digital
formats such as PDF and made accessible over the Internet. Some urban planning tools such as computer-aided design (CAD) and geographic information systems (GISs) have allowed planning designs to be published as electronic maps, searchable drawings, and other auxiliary documents. The conventional methods above cannot offer sufficient ways for users to experience all of the aspects of the planning sites. Virtual reality (VR) can also be used to represent planning sites on the Internet as reference material for stakeholders. With the latest developments in virtual globe technology, it is now possible to develop a seamless and continuous multi-scale 3D visualization platform to share urban planning information in the public participation process. Both professionals and the general public are used to visual approaches (Wu et al., 2010).
A computerized virtual environment containing 3D visualization and animation can accurately present a specific imaginary feature to the general public (Laurini, 2000). Whyte et al. (2000) presented a process to transpose CAD data into virtual reality data and pointed out several related issues, such as formats for data exchange, commonalities and differences between CAD and VR, and optimization of translated VR models. Dollner et al.
(2008) used a 3D virtual environment to display the planning of a public transportation system. They used digital elevation models and aerial photography to build the terrain and laser scanning techniques to build the architecture model. Some navigation tools were built to let the user interact with the virtual environment to see the world from a different viewpoint.
Many studies are currently researching applications of VR systems using Web technology for planning support. In the past ten years, although designers mostly used drawings and planning documents in business, they have gradually started to use virtual reality (VR) technology to facilitate citizen understanding of the content of urban design guidelines, visualize more design concepts and better design details, and provide greater fun in this field (Shen, 2003). Shen et al. (2010) also completed a WEB VR system simulating the district landscape of Nanao City. The Urban Planning Exhibition Hall in Expo’ 2010 at Shanghai applied their unique VR system to exhibit the urban design guidelines of the city to the public/citizens so that the people can interact with each other in it, share their experiences, and leave their feedback (Gao, 2010; Styliani, 2009). In addition, stakeholders can discuss among themselves or with the designers about the virtual world of the city provided by the VR system (Masatoshi and Takafumi, 2008) through the Internet.
In the planning design process, users can exchange their ideas more easily and accurately by using a virtual environment on the Internet. With effective communication processes, it is possible to enhance public participation as well. As discussed above, the virtual model is effective at improving the information flow and helps disseminate technical knowledge to the public. The implementation of a hydraulic design project in some public hearings resulted in increased interactivity between stakeholders and improved communication efficiency for public participation by the VR system (Jiang et al., 2003). On the one hand, stakeholders without a professional background in planning and design can learn the content of the urban plan and post opinions. On the other hand, designers and planners can improve their design works based on feedback from the stakeholders.
In recent years, virtual globe-based 3D Web visualization technology has matured to change the way we interact with spatial data. The public can use their home computers and access the virtual globe through the Internet,
which provides the public a new communication platform and expands public participation in the entire planning process, from brainstorming to the completed project (Drummond and French, 2008). Virtual globe-based visualization has become popular with the general public. It is logical to use virtual globe technology for urban planning information sharing in the future.
Google Earth is virtual globe software and a new potential system with some functions similar to a VR system. As a three-dimensional globe, Google Earth includes all the cities of the world. It is difficult for a conventional VR system to share VR datasets of different cities in the same virtual world (Meguro et al., 2003; Hamilton et al., 2001). Google Earth, which was released in 2005, is now widely used by the general public and researchers. Wu et al. (2010) discussed the technical issues of developing a virtual globe-based 3D visualization framework for publicizing urban planning information using Web services and service-oriented architecture (SOA) to support visual planning model sharing and interoperability with Google Earth. Although Google Earth has potential with regard to planning practices, so far there have been only a few reports on the improvement of public participation in urban planning using Google Earth. Thus, we address utilizing the functions of Google Earth for public participation in planning practice by illustrating more planning and design guidelines.
This paper proposes a virtual globe-based 3D visualization environment on the Internet to publish and share urban planning information for public comprehension and participation. We attempted to employ Google Earth to improve stakeholders’ understanding of urban design guidelines compared with conventional planning documents and drawings. The remainder of this paper is organized as follows. Section 2 describes the research approach details. Section 3 discusses how to represent design guidelines using Google Earth. In Section 4, a brief conclusion is given, and future work is discussed.
2. RESEARCH APPROACH
The present work examined Datong Newtown, China, as an example of typical planning guidelines for the Newtown development project in China.
Our study did not consider details on developing the urban design guidelines; we used the proposed guidelines to visualize the planning concept in this area.
The urban design guideline concept in China originates from detailed urban planning and design in the 1980s. In order to solve problems with rapid urban expansion and construction during this time, some regions in China began to emulate foreign city designs to produce the roots of the guidelines (Gao, 2007). Nowadays, the content of the guidelines is relatively complete and contains the following main 11 aspects: building style and special features, urban land use, urban integral space pattern, public green space system, urban landscape system, historical culture protection and utilization, urban road space, urban activities and support, architectural and environmental space, key area, and incentives (Kong, 2007). All 11 aspects are part of the comprehensive urban design guidelines in China.
In contrast to a VR system, the Google Earth platform shares a database of information from around the world; we can visualize an urban project over the entire globe and not just within the limited project area. This feature makes Google Earth inherently superior at expressing and sharing urban design guidelines of the world, which aid stakeholders’ understanding
by comparing different projects in the virtual world. We utilized Google Earth to represent some urban design guidelines in the Datong region to reveal how efficient it can be to visualize the documents. The whole work comprised three components. First, we proposed urban design guidelines that were developed for the Datong region and discussed the flexible application of Google Earth. In this step, we examined existing urban design guidelines to determine the content for visualization. Second, we discussed how to use Google Series software to visualize the design guideline. Third, we used Google Earth to test our dataset. In the future, it will be necessary to open up the dataset to stakeholders and collect their feedback on the effectiveness of representing urban design guidelines using Google Earth.
We did not discuss user feedback at this stage.
The guidelines for Datong Newtown chosen in this research focus on natural environment protection for sustainable development. Therefore, our work on visualizing this urban design guideline involved environmental design guidelines and conventional urban design guidelines, including those for construction, road networks, and land use. In order to utilize the multiple functions of Google Earth, we tried to fully utilize the superiority of multimedia to express the urban design guidelines and replace vague parts with our new explanations.
Using Google Earth to download 3D GIS topography
Google Earth is 3D GIS software; it is rich in geographic information presented in map formats, and its virtual three-dimensional version was originally called Earth Viewer 3D. It maps Earth by superimposing images from satellite imagery, aerial photography, and GIS 3D global. It is possible to fetch 3D GIS topography as a basement to create a virtual city model using Google SketchUp.
Using Google SketchUp to produce a 3D model
Many city models already exist in Google Earth. After editing these models on downloaded topography, we can use Google SketchUp to upload them onto Google Earth.
Adding conventional multimedia such as text, images, and links of cities in Google Earth as references
For some guidelines that are hard to express with a 3D model, we can use texts and charts to add them directly to Google Earth. We can then add conventional multimedia such as outdoor scene photos, audio files, and movie clips along with other information to present the design guidelines in Google Earth.
Using this method, we can have all kinds of multimedia, such as text, images, and photos, to support 3D models that represent urban design guidelines in Google Earth. We can involve all of the previous media in the platform for Google Earth. The completed Keyhole Markup Language, Zipped (KMZ) file format can be used for browsing, watching, commentary, and modification as long as users have a computer with Google Earth software and are connected to the Internet.
Testing and application of urban design guidelines
There are two conventional methods to show urban design guidelines using this system: showing them to the stakeholders with a projector or touch screen and publishing them through the Internet.
Google Earth has a 3D model database called the Google 3D Warehouse platform. There are many models and information in it about all of the cities’ architecture and scenery. Although it has not been verified, it might be one of the biggest free building 3D model databases in the world.
Architects and planners update the models and related information in the database every day. The completed Google Earth database can be shared with users around the world on this platform.
3. USING GOOGLE EARTH TO EXPRESS URBAN DESIGN GUIDELINES IN DATONG REGION
For Datong Newtown, we reveal three detailed guidelines using Google Earth: traffic, architecture, and environment guidelines. By combining the three guidelines in Google Earth, the space appears more realistic and is easier to understand than reading documents and drawings on each guideline independently. This effect is discussed in the following subsections. The guidelines presented in our work are not the proposed planning guidelines by the campaign planning teams in the local design competition organized by the local government. In the local design competition, most design guidelines come from Western countries; thus, the guidelines utilized in this work are not based on the Chinese planning system.
3.1 Traffic Guidelines
Topography map for site layout and traffic network
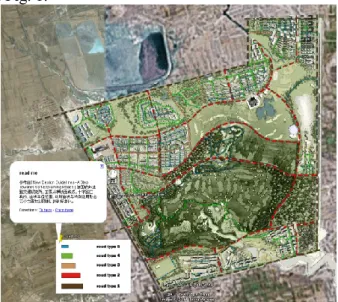
All of the content for our design guidelines comes from New Design Guidelines—A Step towards Self-Explaining Roads (German Federal Transportation Research Institute), in which urban roads are divided into 21 different types according to cross-sectional constitution, intersection form, road corner radius, largest cubes, and special use form. In this study, we divided all of the main roads in the Datong region into five types and visualized them in Google Earth. The overall topography map and traffic network map are shown in Fig. 1. To present the planning document of road types, a picture in the 3D world of Google Earth is embedded in the bottom left corner of Fig. 1.
Figure 1. Traffic guidelines for urban traffic network in Google Earth
The urban design guidelines were developed based on a site plan using topography maps, which is intuitive for illustrating the design requirements of the entire site layout. Thus, we need to add the site planning as an overlay to the topography map in Google Earth. Topography maps are characterized by being always extremely close to the ground and undulating. We used the image overlay adding pattern from Google Earth to directly overlap fabricated images onto available topography conditions in Google Earth;
this is easier than the expression in a VR system.
Details of all types of urban roads—3D model and combination of texts and charts
In the previous VR system, the 3D model can be shown with related papers and html links. However, Google Earth can use its connecting mechanism to place the 3D model and related materials together and promote stakeholders’ understanding through reading and listening.
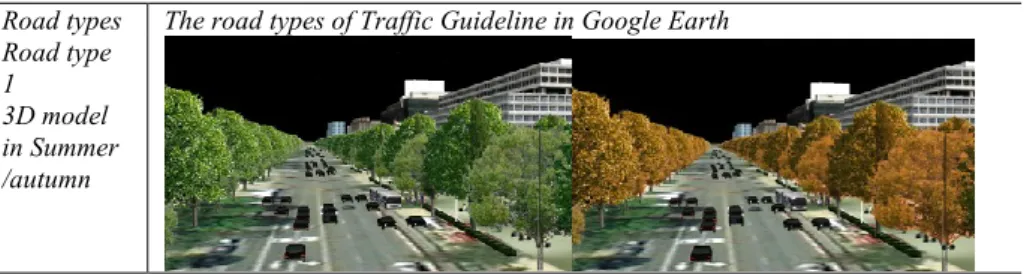
Table 1 presents the 3D models of sample roads and detailed illustrations with texts and charts. The 3D models in Google Earth are easier and more straightforward to be understood than is the traditional combination of texts and charts when designers explain the planning materials of traffic networks. More pictures of the road section and plane can be added as auxiliary information, as shown in Table 1.
Google Earth uses real-time rendering technology, so the datasets of the 3D model can be changed instantly. Either VR or virtual globe changes the vision angle freely, and the 3D model’s datasets can be changed conveniently. Designers can change the vision angles freely during the model-making stage, and animation and rendering can be done after the designer fixes the vision location or vision route. Google Earth can display any angle from the model-making stage to the final exhibition stage.
Although it is not easy for the stakeholders themselves to create the models, designers can now import enough sets of 3D data into Google Earth according to current regulations for urban design guidelines. As the [Road type 1 3D model in summer/autumn in Tab.1], users can exchange datasets and show the urban image for different road types; this allows stakeholders convenient access to the correct information on different road types in the design guidelines.
Table 1. Traffic guidelines in Google Earth
Road types The road types of Traffic Guideline in Google Earth Road type
1 3D model in Summer /autumn
Road type 2 3D model
Explanatio n for Road types
Planning documents for road design embedded in the 3D world of Google Earth
Road type with planar graph and section drawing
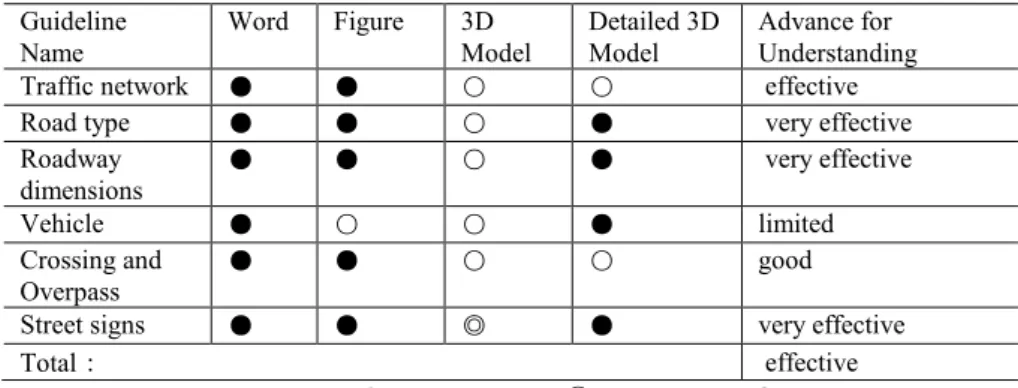
The traffic guidelines reveal a completely new exhibition effect embedded in the 3D world of Google Earth. An analysis table is presented on the effectiveness of Google Earth at representing traffic guidelines. As shown in Table 2, traffic guidelines received an “effective” result. This means that more than half of the guidelines can be understood effectively with Google Earth. However, when more and more images are added, a problem of locating the guideline illustration images emerges; the images frequently overlap with the 3D models. In particular, when people are viewing the model from a certain distance, most of the 3D models on the ground overlap and cannot be seen. Thus, we need to locate the images for architecture and environment guidelines properly: the former has few pictures, but the latter has many.
Table 2. Results of displaying traffic guidelines in Google Earth Guideline
Name
Word Figure 3D Model
Detailed 3D Model
Advance for Understanding
Traffic network ● ● ○ ○ effective
Road type ● ● ○ ● very effective
Roadway dimensions
● ● ○ ● very effective
Vehicle ● ○ ○ ● limited
Crossing and
Overpass ● ● ○ ○ good
Street signs ● ● ◎ ● very effective
Total: effective
Not to be used or Poor results: ○ Normal results: ◎ Good results: ●
3.2 Architecture Guidelines
The architecture guidelines used for Datong Newtown are mainly from the urban design guidelines from the White Flint master plan and downtown design guide in Los Angeles. It focuses on regulations for massing, surface, base wall height, step-back or podium setback, and other architecture issues.
We already discussed the topography and 2D maps previously; extra 3D datasets to represent buildings are necessary for the architecture guidelines.
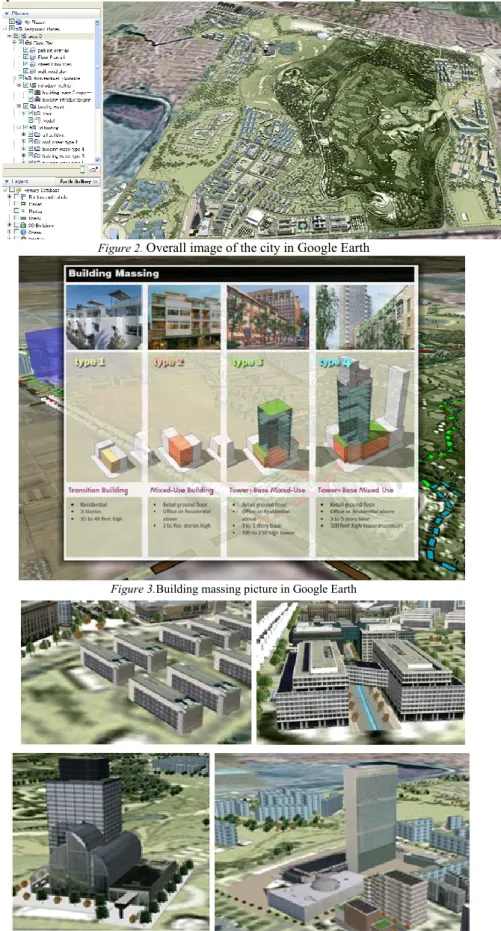
Fig. 2 shows the architecture guidelines in detail.
Building type and massing—images and 3D model
The building type and massing and building facade image are discussed here. Building massing restricts the construction density, building plot ratio, etc. Building facade images refer to outside colors, shapes, and neighboring facilities of the building.
First, we employed pictures to present documents for architecture guidelines on building type and massing. For the traffic guidelines, we embed the guidelines in the 3D world of Google Earth; a different presentation method is used for the architecture guidelines. Fig. 2 shows a
“My Places” icon on the left side of the Google Earth main window. Users need to find the architecture guideline sub-item in the “My Places” icon and find the “building introduction.png” file. They double-click this file to see the content of the picture in the right window of Google Earth. The background 3D model can serve as an additional illustration for the picture.
For traffic guidelines, we embedded pictures in the 3D world of Google Earth; here, it is difficult to control the direction and position to read the content of the guidelines. Thus, this method resolves the previous issue with traffic guidelines. When a user exits the photo mode, he/she can still freely browse in the space. This is a VR-style illustration of a street-view 3D model with a PowerPoint presentation. This method combines the advantages of the two techniques to make understanding of the urban design guidelines intuitive for stakeholders. If the user would like to know more, relevant links are available for further experience. In short, double-clicking the photo on the left side and controlling the window on the right side make it easier for stakeholders to check the content of the guidelines in planning documents. As shown in Fig. 3, we can express the guidelines for four types of buildings in terms of names, sizes, building plot ratios, construction density, functional regions, and rough effect simulation pictures.
When users exit the photo mode in Google Earth, they can see the locations of different types of buildings in the 3D models by using the
transparent squares with the same color as the building types. This is convenient for users in finding the locations of the four types of buildings.
Fig. 4 shows the architecture 3D model for the four types of building samples and the combination effects with the surrounding environment.
Figure 2. Overall image of the city in Google Earth
Figure 3.Building massing picture in Google Earth
Figure 4. Building type samples in Google Earth
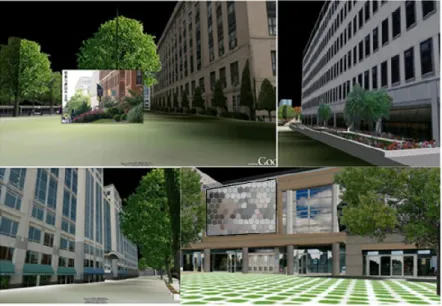
Building facade image and street furniture—3D model
As shown in Fig. 5, the urban building style is more intuitively visualized using images and 3D models. With delicate and accurate models in very realistic environment scenery, a high-quality visualization effect can be achieved.
Street furniture is mainly rendered from figures and photos using a simple 3D model. We do not necessarily create each complex 3D model for non-critical areas, and there is not enough memory to display so many 3D models in a common personal computer.
Figure 5. Building facade image in Google Earth
From all the works introduced above, the use of Google Earth to express architecture Guidelines is more intuitive than the use of previous formats because it is more suitable to use the 3D model to illustrate architecture. A questionnaire on the architecture guidelines received positive responses from the respondents, as shown in Table 3. The 3D model effect is more vivid than common VR systems because of the correct coordination information and surrounding urban and nature environment of the virtual globe around the planning site, but it is not as realistic as high-quality renderings done using Autodesk 3ds Max software. By using Google Earth, designers can also see whether a building can coordinate well with the city landscape from a wide view instead of considering the building alone.
Table 3.Result of Architecture Guideline Guideline Name Word Figure 3D
Model
Detailed 3D Model
Advance for Understanding
Building height ● ● ● ◎ very effective
Plot ratio and
building coverage ● ● ○ ○ very effective
Setback/ property line ◎ ● ○ ◎ effective
City General
impression ○ ◎ ● ● very effective
Sky line ◎ ◎ ● ○ good
Building Types ◎ ○ ○ ● effective
Architectural style ● ○ ○ ● very effective
Public space ◎ ● ○ ● effective
Building appendages ● ○ ◎ ● very effective
Main section ◎ ◎ ● ● very effective
Not be used or Poor results:○ Normal results:◎ Good results:●
3.3 Environment Guidelines
Environment guidelines focus more on regulation details than do the previous two guidelines; the focus is partly on the environmental effects of building material and thermal environmental changes, the wind corridor map, and so on; this makes them complicated to illustrate. The environment guidelines in this study were obtained from the heat island plans from the Japanese Ministry of Environment. In total, 19 heat island technologies that use low-cost technology to effectively reduce the temperature of the urban environment are described. We used 14, which are presented in Table 4.
Partial items of environmental effect—3D model, multimedia, and topography map
Used alone, 3D models are not enough for stakeholders to understand all the content of environmental guidelines. Thus, we try to represent them using not only 3D models but also multimedia expression, including cross- section pictures and other illustrations. The complete data are presented in Table 5.
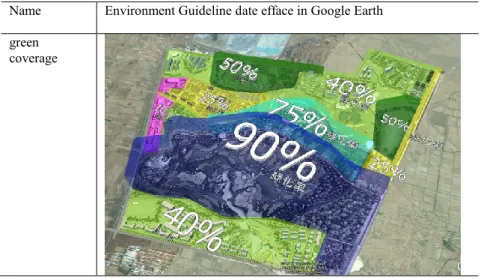
As shown in Table 4, green coverage—the region covered by different colors—has strict restrictions on vegetation coverage. The blue region is 90%, the cyan blue one is 75%, and the green one is 40%. This is an approach to showing the geographic division using a topography map, which is similar to the work we did for traffic guidelines.
As shown in Table 4, the flexible application of pictures and 3D models for river wind/breeze can help visualize the environmental effect on the planning site. When users double-click the items in the sidebar “My Places”
on the left side of Google Earth, Google Earth will skip to its location; users can then read all the detailed information in the photo model with the detailed 3D model. This is the same method we used for the architecture design guidelines. It is also possible to link more pictures to the buildings, street furniture, and ground surface as auxiliary information, as shown in Table 4. This method was used to present the traffic guidelines.
Table 4. Environment guidelines in Google Earth
Name Environment Guideline date efface in Google Earth green
coverage
River wind/breeze
Roof greening
Avoid thermal paving and water retention of Paving
Spray device
surface temperature
In Table 4, roof greening is easily visualized by the 3D model and pictures to show the effect of roof plants and solar disruption. It is possible to link the shape of the roof greening and picture of the guideline to explain the roof greening effect. Accordingly, Guideline Nos. 2, 3, 5, and 6 in Table 5 are easy to understand and are used in the same way in Google Earth.
However, there are still parts that are difficult to present in a 3D model, such as avoid thermal paving and water retention of paving in Table 5. For pedestrian streets, designers consider water retention, surface water channels, and spray devices for paving in the central part in the street that cannot be covered by trees in order to control the surface temperature to be comfortable for the human body. We created a 3D model of the cross section to show the structure of the pavement, but this alone cannot show people how it works. We think that this is one of the difficult aspects of the guidelines to illustrate in Google Earth. Guideline Nos. 9–14 in Table 5 also have similar problems. We added the construction materials in the 3D models of Google Earth to improve user understanding. Although it is technically possible, it is still difficult to locate those 3D models in Google Earth; this will be one of our future study topics.
Thermal environmental change—sandbox
We employed the “sandbox” plug-in to illustrate the less intuitive elements numbers. As shown for the surface temperature of the ground in Table 5, different translucent colors were used to display the uneven ground.
In this case, the surface temperature was reduced by three countermeasures:
grass-planting bricks in the parking lot, spraying water, and tress on the street. The reduction in temperature can be displayed by different colors;
meanwhile, the translucent shapes accurately show the positions of different surface temperatures.
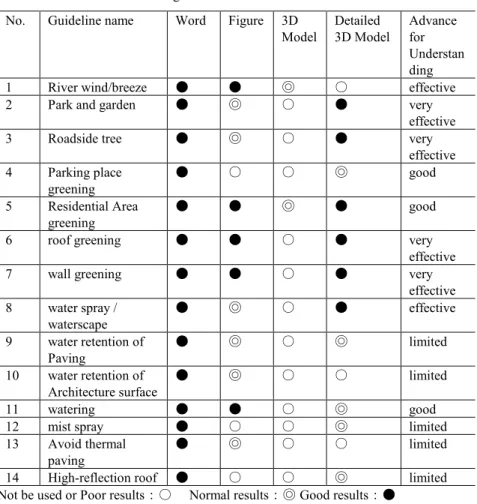
From the items in the heat island guidelines, not all of the environment guidelines are suitable for visualization in a 3D model. The results of the questionnaire regarding environment guideline results had quite a few responses of “hardly” effective, as shown in Table 5. However, since all of the text and graphs can be imported into Google Earth, it is possible to integrate all multimedia materials to present the guideline. Compared with conventional formats, Google Earth is more effective at helping stakeholders learn about the environment guidelines by illustrating the planning information in 3D models.
Table5.Results of environment guidelines
No. Guideline name Word Figure 3D Model
Detailed 3D Model
Advance for Understan ding
1 River wind/breeze ● ● ◎ ○ effective
2 Park and garden ● ◎ ○ ● very
effective
3 Roadside tree ● ◎ ○ ● very
effective 4 Parking place
greening
● ○ ○ ◎ good
5 Residential Area greening
● ● ◎ ● good
6 roof greening ● ● ○ ● very
effective
7 wall greening ● ● ○ ● very
effective 8 water spray /
waterscape
● ◎ ○ ● effective
9 water retention of Paving
● ◎ ○ ◎ limited
10 water retention of Architecture surface
● ◎ ○ ○ limited
11 watering ● ● ○ ◎ good
12 mist spray ● ○ ○ ◎ limited
13 Avoid thermal paving
● ◎ ○ ○ limited
14 High-reflection roof ● ○ ○ ◎ limited
Not be used or Poor results:○ Normal results:◎ Good results:●
4. CONCLUSIONS
A virtual globe-based and Web service-oriented architecture was proposed in this paper to provide a distributed 3D urban planning information sharing environment for public participation. This virtual globe- based system architecture facilitates public participation through the visualization of urban planning projects at any scale and from any viewpoint.
End users can rapidly inspect an urban planning design from the macro- vision to micro-details with their personal computers.
In this research, a set of completed urban design guidelines imported most of the data, such as topography, texts, charts, images, and 3D models, into Google Earth. The topographic map, photo mode, and plug-in sandbox functions in Google Earth were utilized to develop the visualization tools for presenting the guidelines. According to our present work, most of the content of urban design guidelines can be imported into Google Earth.
Google Earth has extraordinary exhibition capabilities in comparison to previous traditional formats. Using Google Earth to visualize urban design guidelines can surely improve the stakeholders’ understanding of this part.
There are additional advantages to using this tool. First, the information can be shown locally by projectors or a touch screen to stakeholders. This method reveals the value of a common VR system. Second, the dataset of urban design guidelines can be uploaded into Google 3D Warehouse so that distant stakeholders can download it anytime and anywhere on the Internet and give feedback or chat by using communication software such as Skype.
Third, people around the world can access the guidelines through the Internet as reference materials for urban design in local cites. Although we did not complete the study on a multi-user Web environment, we will focus on Google Earth application programming interface (API) technology in the future. We hope that in the near future, this completed dataset can be multi- user, interactive, shared, and recorded according to the regulations of WEB 2.0 using the globe background of Google Earth.
ACKNOWLEDGMENTS
This research has received supports from JSPS research grants for Scientific Research C (Proposal No. 22560602).
REFERENCES
Dollner, J., Konstantin, B., Henrik, B. (2008). “Virtual 3D city models as foundation of complex urban information spaces”, in 13th International Conference on Urban Planning and Regional Development in the Information Society GeoMultimedia, Vienna, Austria, 19-22.
Drummond, W.J., French, S.P.F. (2008). “The future of GIS in planning: Converging technologies and diverging interests”, Journal of the American Planning Association, 74 (2), 161-174
Gao, C. (2010). “Looking to the future development of virtual reality by Online Expo Shanghai”, Today Panorama of Modern Sciences, 75.
Gao, Y. (2007). “A discussion of American urban design guidelines and revelation to China”, City Planning Review, 31(4), 49-50.
Hamilton, A., Trodd, N., Zhang, X., Fernando, T., et al. (2001). “Learning through visual systems to enhance the urban planning process”, Environment and Planning B: Planning and Design, 28, 833-845.
Hetherington, R., Farrimond, B., Clynch, P. (2007). “Interactive web visualization of proposals for site developments”, In Proceedings of Information Visualization, 2007. IV '07. 11th International Conference (613-622). Zurich, Switzerland, July 4-6, ISBN: 0- 7695-2900-3.
Jiang, B., Huang, B., Vasek, V. (2003). “Geovisualisation for planning support systems”. In S. Geertman, J. Stillwell (Eds.), Planning support systems in practice (177-191). Berlin:
Springer-Verlag.
Kingston, R., Carver, S., Evans, A., et al. (2000). “Web-based public participation geographical information systems: An aid to local environmental decision-making”, Computers, Environment and Urban Systems, 24 (2), 109-125.
Kong, X.Y. (2007). “A method of comprehensive Urban Design Guidelines”, Southeast University Master's degree thesis.
Kretzschmar, W., Tiedtke, S. (2005). “Trends in real-time landscape visualization and participation”. In P. Paar, I. Bishop, E. Lange (Eds.), What role does visualization play in communication with citizens? - A field study from the interactive landscape plan. E.
Buhmann, (156–167), Heidelberg: Wichmann Verlag.
Lai, J.S., Chang, W.Y., Chan, Y.C., Kang, S.C., et al. (2011). “Development of a 3D virtual environment for improving public participation: Case study -The Yuansantze Flood Diversion Works Project”, Advanced Engineering Informatics, 25(2), 208-223.
Laurini, R. (2000). “Computer systems for public participation, The Virtual Permanent Conference of the "Sommet des Villes de la Méditerranée"”, Oct, 2000.http://www.gisig.it/vpc_sommet/CD_Sommet/ws3/sommario_ws3.htm >
Masatoshi, N., Takafumi, A. (2008). “Development of Design Database System by Virtual Reality: Design Support Using Multimedia on Internet. Summaries of technical papers of Annual Meeting Architectural Institute of Japan”, F-1, Urban planning, building economics and housing problems, 925-926.
Märker, O., Pipek, V. (2000). “Computer-supported participation in urban planning from the viewpoint of “Communicative Planning Theory””. In Proceedings of IFIP 8.5 working conference on advances in electronic government (pp. 43-58). Zaragoza, Spain.
Meguro, K., Yoshimura, M., Takase, Y., et al. (2003). “Development of Integrated Information System for Disaster Management”, In Proceedings of the 2nd International Symposium on New Technologies for Urban Safety of Mega Cities in Asia, International Center for Urban Safety Engineering, 339-344.
Shen, Z.J., Kawakami, M., Kishimoto, K. (2003). “Study on development of on-line cooperative planning and design system using VRML and JAVA – A case study on public park planning and design”, The 8th international conference on computers in urban planning and urban management (CUPUM), in CD-ROM, Sendai.
Shen, Z.J., Kawakami, M. (2010). “An online visualization tool for Internet-based local townscape design”, Computers, Environment and Urban Systems, 34(2), 104-116.
Styliani, S., Fotisb, L., Kostasa, K., et al. (2009). “Virtual museums, a survey and some issues for consideration”, Journal of Cultural Heritage, 10(4), 520-528.
Whyte, J., Bouchlaghem, N., Thorpe, A., McCaffer, R. (2000). “From CAD to virtual reality:
modelling approaches, data exchange and interactive 3D building design tools”, Automation in Construction, 10, 43-55.
Wu, H.Y., He, Z.W., Gong, J.Y. (2010). “A virtual globe-based 3D visualization and interactive framework for public participation in urban planning processes”, Computers, Environment and Urban Systems, 34(4), 291-298.