熊本大学学術リポジトリ
Flow Injection Analysis of Acid and Base using Thermo‑Sensitive Resistance Coils
journal or
publication title
Journal of Flow Injection Analysis
volume 12
number 1
page range 66‑76
year 1995‑06
その他の言語のタイ トル
感温抵抗コイルを用いる酸と塩基のフローインジェ クション分析
URL http://hdl.handle.net/2298/11008
J. Flow Injection Anal., Vol.12, No.l (1995)
Flow Injection Analysis of Acid and Base using ThennoHSensitive Resistance Coils
Kei TbDA*. Senju IWATA. Isao SANEMASA and Toshio DEGUCHI
Department of Chemistry, Faculty of Science,
Kumamoto University, KuroJkamJ, Kumamoto 86O, Japan
ABSTRACT
A flow injection analysis of acid-base by detecting neutralization heat is proposed. A injected sample (acid or base), combined with a carrier (deionized water), was mixed with a reagent (base or acid) stream. A change in the solution temperature was detected by passing the solution, immediately after mixing, through a stainless steel capillary tube around which a thermo-sensitive resistance was coiled. The temperature of carrier was used as a reference;
Hydrochloric acid solutions of 0.003 to 0.2 M could be determined at a rate of 120 samples/h. Using this system,determination in weak-acid and weak-base system could also be performed. Thermo-sensitive resistances used in this work were completely free from corrosion, and effects of the ambient temperature and
the sample diffusion in the detector were minimized.
Introduction
Acid—base titrations popular in analytical chemistry usually employ indicators to detect the end—point. A new-type mixer has been proposed to
facilitate flow injection titration analysis.1 The color change of indicator,
however, is of no use for colored sanple solutions. In this case,a fH-sensitive glass electrode is suitable to detect the pH change, but a specially designed flow cell is needed for the determination.2 Md re over, it is difficult to clearly detect end-points of weak acid-weak base titrations due to their gentle pH jumps. In order to overcome these difficulties, some workers have made use of neutralization heat to detect end-points.3~e These thermcmetric titrations however, were made under batchwise conditions. In the batch method particular attentions should be paid to an external heat.
A thermometric titration coupled with a FIA technique,which sometimes called flow enthalpimetry, has been recently proposed.7'10 Hard design used for flow enthalpimetry and their applications are described in detail.11 Because of its high sensitivity to a heat change,a thermistor, which resistance changes steeply according to temperature,was used in these studies to detect the heat of neutralization. The thermistor, however, is liable to be corroded,
because it is placed inside a tube through which an acidic or alkaline solution is continuously passing. The thermistor coated with glass may be used to
protect against corrosion, but the heat-capacity of such sensor becomes large and moreover, the tube should be large enough to include the sensor. The output
signal of the thermistor—type detector depend on ambient temperature because the relation of resistance and temperature is not linear. And ambient temperature compensation using reference thermistor is difficult beeause of the variedness of their temperature coefficient of resistance.
In this work, a system to detect the heat of neutralization with thermo—
sensitive resistances was proposed. Using this system,the effect of ambient temperature on heat measurements was reduced and,because the heat was measured outside the tube, the sensor was completely free from corrosion.
67 -
EXPERIMENTAL
Heat detector
The structure of the heat detector part used in this work is shown in Fig.
1. Thermo-sensitive resistance wire was coiled around a stainless steel 304 capillary tube (o.d. 0.88 X t 0.15 X 100 mn) ;the number of coil was controlled so as to get the resistance of ca. 1 kQ. The resistance wire was made of Ni (7(K) and Fe (3(K), its diameter was 0 18 ± 2 w,resistance ratio was 240 ± 10 Q/feet at 25#C,and its temperature coefficient (TCR) was 4400 ppo/C* The wire was coated with 4 ± 1 pm poly-imide (Toreneese #3000,Tore) to insulate. The ends of the wire were barked by a sandpaper (#1000) and soldered to a electric circuit.
JUL
1B
Fig. 1 Structure of heat detector
A:PTFEtube (i. d. 0. 5 X 50 mtf, B:Fe-Niwire.
C : stainless steel capi I lary (o. d. 0. 88 X t 0. 15 X 50 mr) D: nut, E: union connector
Apparatus
The schematic diagram used in this work is shown in Fig. 2. The flow system wa3 constructed of FIFE tubing (2 nm o.d. and 1 mn i.d.). The carrier (deionized water) and reagent (base or acid) solution were made to flow
continuously by applying nitrogen pressure of 0.5 ~ 1.0 kgf/cnfG (4.9 ~ 9.8 X
10* Pa) to each reservoir (600 or 1000 ml PVREX glass separable flask) ; the flow rate was regulated by a needle valve made of tetraf luoroethylene-perf luorovinyl
ether copolymer (PFA type mini needle flare LFN-2,Iuchi-Seieido) attached to the outlet of each reservoir. Sample solution was introduced to a sample loop of 60 ul by syringe sucking. The detector, shown in Fig l,was connected to the carrier line before a sample injector; this serves as a reference detector (REF). At the downstream of a mixing point where the carrier and the reagent
were to be mixed, another detector was connected; this serves as a working detector (SEN). The distance between the mixing point and the center of the detector (SEN) was 150 mm. The water bath used in this work was not thermostated. Sample,carrier, and reagent solutions are after being passed through each heat—exchange coil of 1 m length made of the PIPE tubing to attain a constant temperature equal to that of the water bath.
N2 sample
WASTE
WATER BATH
reagent
Fig. 2 Schematic diagram of the FIA system
R : pressure regulator, NV : needle valve, HE : heat—exchange coil, SI : sample injector, SL : sample loop,
REF: reference detector, SEN: working detector
- 69 -
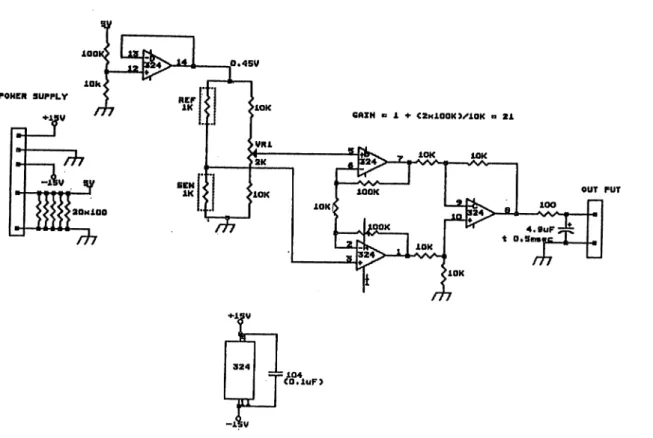
Detection circuit
The circuit to detect a temperature change is shown in Fig. 3. Two detectors, SEN and HER were combined to a Wheat stone bridge. The change in this bridge balance was monitored. The voltage applied at the head of the bridge was only 0.45 V. In an amplification of difference part, an instrumentation
amplifier with three operational amplifier units was used to obtain a good accuracy. An amplification ratio was about X 21. The bridge balance was adjusted by a variable resistor (YR1). In order to reduce the signal-to-noise ratio, a pass—condenser (0.1 /iF) was connected to the power supply of the operational amplifier, and the integral circuit,which time constant was 0.5 msec, was attached to the output terminal. In the combination of the sensor and the
circuit described above, the output signal was changed about 10 mV when the coil temperature changed by 1°C.
POME* SUPPLY
GAIN o I + CZxlOOtO/'lOK a 21
OUT PUT
+JLSV
324
EL.
-15V
.luF>
Fig. 3 Detection circuit for thermometric determination
Reagents
All of the reagents used in this investigation were of guaranteed grade, and deionized water was used as the diluent or the carrier. The base solutions
were standardized by sulfamic acid,and the acid solutions were standardized by this base solution using conventional titration. These solutions were degassed before use to prevent cavitation at the flow control valves,
RESULTS AND DISCUSSION
The voltage applied to the bridge head was regulated to be 0.45 V This low voltage produced a relatively small final signal output,but was neverthless chosen to reduce self—heating of SEN or REF. The supplied power under this condition to the temperature-measuring resistance was only 50 flNtwhich was
estimated to correspond to a neutralization heat of an 1.5 X 1CT5 MHC1 sample
injected withNaCH solution. This estimation shows that the resistor self—
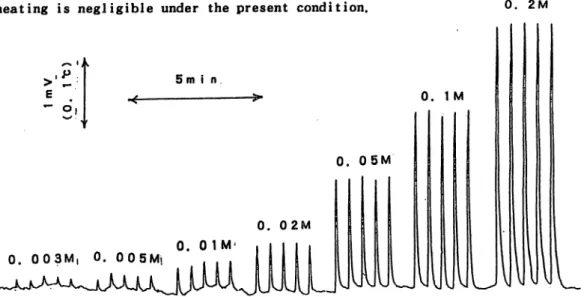
heating is negligible under the present condition. °- 2M
5m i n
0. 1M
0. 05M
0. 02M 0. 003M, 0. 0 0 5M. 0. 01M
Fig. 4 Flew signals obtained in HCI sanple-NaCH reagent system sample : 0. 003 ~ 0. 2 M HCI. reagent : 0. 2 M NaOH 1ml/min carrier • dejoftized water 4 ml/min
- 71 -
An example of the present thermal FLA is shown in Fig.4. The height of output signal,which corresponds to the change in temperature before and after mixing HOI of different concentration with a NaCH solution of constant concentration (0.2 M in this case), was changed according to HCI concentration in the range of 0.003 to 0.2M. The calibration curve obtained was not linear, but
somewhat curved downward. This is probably due to a heat radiation to air, which may occur around the sensor. The detection limit estimated from the
calibration curve was 0.002M (&4t=3). The output signal was rather small in our detection system,but, the signal-to-noise ratio was also relatively small owing to that any mechanical pumping system was not employed and to that the pass-condenser and the integral circuit worked effectively. The pumping system is an important factor to detect such a small temperature change as a few to several hundreds of mC. A plunger—type pump,even though equipped with back
pressure coils and dumper tubes, could not be used because of its high mechanical noise.
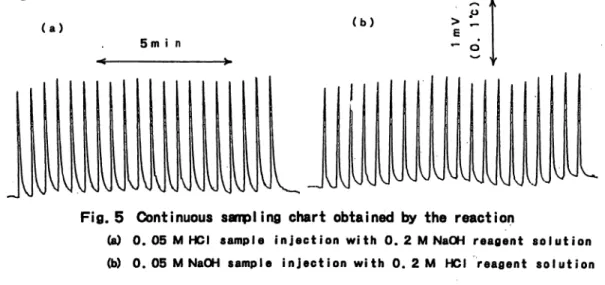
At the optimum condition,a relative standard deviation for 20 sampling
cycles of 0 05MHD1 was within 2.0 % and a sampling rate was 120 cycles/hr.
Also* in the NaCH determination by H21,similar results were obtained as shown in Fig. 5.
(b) > t
(a)
5 m i n
VVVV VV V V VVV V VV VVV VV VV VV V VV
Fig. 5 Continuous sampling chart obtained by the reaction
(a) 0. 05 M HCI sample injection with 0. 2 M NaOH reagent solution (b) 0. 05 M NaOH sample injection with 0.2M HCI reagent solution
Resistance (R) of thermistor as a function of temperature (T) is expressed as follows*.
R = Ro exp B(l/T0 - 1/T) (1)
where,P^ is resistance at the reference temperature T^ and B is a constant. On the other hand, resistance of a metal resistor, the detector used in this work, is shown as follows:
R = R0 {1+C(T-TO)} (2)
where C is a TCR. We can see, from Eqs. 1 and 2,that thermistor is more sensitive to a temperature change and, therefore,also means that thermistor is liable to produce a relatively large output error, because the relation of temperature and resistance is not linear. We made a simulation on the assumption that an 0.2 °C change in a solution temperature occurs by a neutralization react ion, and 1^ and B(or C) values are completely same between SEN and REF. In this simulation we employed as F^, 10 kQ for thermistor and 1 kQ for resistor coil,3500 as B,and 4400 ppny'C as C; these are value of normal thermistor or the value of the
resistor used in this work. Output errors thus simulated are shown in Fig.
6, from which we can see that a thermistor—type detector is affected more seriously by ambient temperature.
In general, thermistor is used in a tube directly dipped in an acidic or alkaline solution. In tsuch
20
15-
3T 10-
| 5-
£ 0
-5-
-15
-20
\ therr tetor
. \\
metal resistor
\
circumstances, the detector is easily corroded moreover, the output signal tends to be affected by a flow
10 15 20 25 30
Ambient temperature (°C)
Fig.6 Comparison between metal resistor and thermistor
Simulation datas were calculated in follow conditions delta t : 0.2°C
metal resistor: RQ1kohm, TCR 4400ppm/°C, thermistor :R01Okohm, B 3500
- 73 -
confusion,or sample diffusion,because the dipped sensor measures temperature at the point in the flow, and the inner diameter of the tube is larger to include the thermistor. The resistor coil—type detector used in this work measures the mean temperature of the capillary, around which the thenno—sensitive resistance was coiled. When the detector is longer, it seems difficult to detect fast
solution parameter change. But, this problem can be dissolved by increasing flow rate and decreasing diameter of the capillary. Also, a long detector has a better signal stability than dipping type that is easily affected by flow- confusion. The inner diameter of the sensor could be designed smaller than that of thermistor. Consequently, the sample diffusion in the detector could be decreased to get a better sensitivity and a faster sanpling rate.
An example of application of the present thermal FIA to the weak-acid and
weak—base system is shown in Fig. 7. Acetic acid solutions of 0.01rO.2 M were
successfully determined by an amnonia of 0.2 M. The peak heights were slightly
lower than the data obtained in this acid determination by strong-base NaCH.
The detection limit was 0.003M.
5m i n
0. 2M
0. 1M
0. 05M
0. 02M 0. 0 1 M
VJVJ VJVJ
Fig. 7 Chart obtained in weak-acid and weak-base system
Sample : Q 01-Cl 2 M acetic acid reagent : Q, 2 M ammonia 1ml/min carrier : deionized water 4m\/m\n
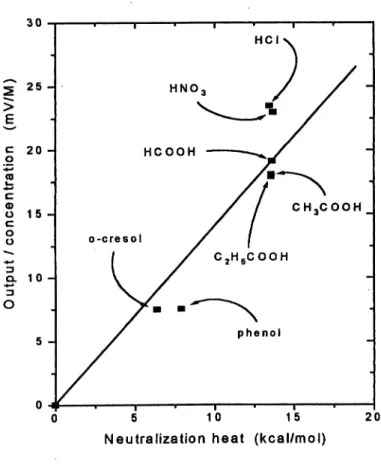
It was found,using different acids of 0.1M and a NaCH solution of a
constant concentration (0.2M), that the output signal per an unit acid
concentration in M was nearly proportional to the neutralization energy,12
derived under infinitely diluted conditions as shown in Fig.8. This means that when runs are made under identical conditions, the slope of calibration exhibits
an inherent value characteristics of the type of acid to be determined.
30
25 -
c 20
o
*-«
CO
<D o 15 c oo
13
O 10 -
5 -
HCI
HNO
HCOOH
CH3COOH o-cresol
phenol
0 5 10 15 20
Neutralization heat (kcal/mol)
Fig. 8 Relationship between neutralization energy and output
Acids of 0. 1 M were determined by 0. 2 M NaOH
- 75 -
Conclusion
Rapid determinations of acid or base were demonstrated using thermal FIA system. The system can be easily produced for oneself. A wide application of the system is expected.
References
I. J. Toei, Y. Saigusa and N. Baba, / Flow Injection AnaJ., 3, 27 (1986).
2 T. Imato and N. Ishibashi, Anal. Scl.% 1, 481 (1985).
3. H. Linde, L. B. Rogers and D. N. Hime. AnaJ. Chem.% 25, 404 (1953).
4 J. Jordan and T. G. Alleman , Anal. Chem., 29, 9 (1957).
5. J. Jordan and W. H. Dunbaugh , Anal. Chan. , 31, 210 (1959).
6. B. C. Tyson, W. HLNfcCurdy and C. E. Bricker, Anal. Chan., 33, 1640 (1961).
7. W. E. Linden, M. Bos, H. H. Heskanp and H. Wilms, Fresenlus' Z. Anal. Chem.%
329, 440(1987).
8. H. Berge and R. Lamnert, Chem. Techn.% 40, 305 (1988).
9. S. Fujieda and W. Zhang Anal. <&/., 10, 889 (1994).
10 I. Satoh, J. Flew Injection Anal., 8, 111 (1991).
II. R. S. Schifreen, Chem. Anal., 79, 97 (1985).
12. Kagaku Blnran, Chemical Society of Japan, Maruzen, 1975, 979.
$ **> yr
*+ 'J T^SStMt LXm^tio 0. 003*^0. 2MCDJ1 2
,« • ,,,7 1 O7 IQQ^
(Received Felruary 27, 1995)