EXPERIMENTAL STUDY ON MITIGATION OF
LIQUEFACTION‑INDUCED GROUND DEFORMATION BY USING GRAVEL AND GEOSYNTHETICS
著者 ヘンドラ セティアワン
著者別表示 Hendra Setiawan journal or
publication title
博士論文要旨Abstract 学位授与番号 13301甲第4835号
学位名 博士(工学)
学位授与年月日 2018‑09‑26
URL http://hdl.handle.net/2297/00053081
doi: 10.2208/jscejseee.73.I_704
Creative Commons : 表示 ‑ 非営利 ‑ 改変禁止 http://creativecommons.org/licenses/by‑nc‑nd/3.0/deed.ja
DISSERTATION ABSTRACT
EXPERIMENTAL STUDY ON MITIGATION OF LIQUEFACTION- INDUCED GROUND DEFORMATION BY USING GRAVEL AND
GEOSYNTHETICS
Graduate School of
Natural Science and Technology Kanazawa University
Division of Environmental Design
Student ID Number: 1524052018 Name: Hendra Setiawan
Chief Advisor: Prof. Masakatsu MIYAJIMA Date of Submission: June, 2018
Abstract
Earthquakes in liquefaction-prone areas are usually followed by the ground deformation triggered by liquefaction. This paper aims to study the influence of geosynthetics along with gravel usage on the liquefaction-induced ground deformation, both horizontal and vertical displacement by conducting a series of shaking table tests. This influence is analyzed by measuring pore water pressures, acceleration, and ground deformation due to shaking process. The results of a series of 1-g shaking table tests which have been conducted are as follows: by using gravel and geosynthetics type I (friction angle 23.4o), the lateral spreading reduced by around 23%, and the settlement decreased up to 36% and 32% in the loose and dense sand conditions, respectively.
Furthermore, by utilizing gravel along with geosynthetics type II (friction angle 30.2o), the horizontal displacement lessened by 45%, and ground subsidence lowered by 54.5% in the loose sand area, and 32% in the denser ones. In addition, the differential settlement between loose sand and dense sand zones reduced as well, by around 38% by using gravel and geosynthetics type I and up to 62% applying gravel in conjunction with geosynthetics type II.
1. Introduction
Liquefaction is one of the phenomena which occur in the saturated loose sand layer during an earthquake. It takes place when the pore water pressure reaches a certain value which is close to the total stress of a soil. One of the consequences that can occur is structures built on top or within the liquefied ground may fail due to ground settlement.
Landfilled ground occasionally liquefies due to a large-scale earthquake and triggers deformations on the ground surface and undermine construction on it, for example, the road (Takahashi et al. 2015). This phenomenon occurred because the liquefied layer is having low strength when shocked with large amplitude seismic waves, caused large movements to the road surface, and as a result, deformation of the road surface took place. Nevertheless, even though the road surface was composed of asphalt and roadbed and had high-strength if the ground under the road surface is liquefied, the strength (shear rigidity) of the road surface will be decreased and deformation will occur.
Ground displacement can be divided into two parts, namely horizontal displacement, and vertical displacement. Lateral spreading is the term used to refer to the development of horizontal ground displacement due to earthquake-induced liquefaction, in the case of even small free ground surface inclination (e.g., 1o-3o) or small topographic irregularities, e.g., river and lake banks (Valsamis et al. 2010). This phenomenon also occurs on mild slopes underlain by loose sands where a shallow water table is present. Such soil deposits are prone to excess pore water pressure generation, liquefaction and consequently lateral displacement during seismic excitations (Bartlett and Youd, 1992).
Furthermore, the extent of deformation is influenced by several factors, one of which is the relative density (Dr) of the ground. When earthquake-induced liquefaction occurs in the areas with different density, ground differential settlement can take place and may cause damage to constructions built on it, such as the building tilted and roads become uneven/bumpy. Moreover, in the severe condition and significant differential settlement appears, this can lead to, for example, impassable roads. However, for the important roads, such as main roads, emergency evacuation routes, and roads connected to important facilities, it is necessary to ensure the accessibility of these vital roads during earthquakes. For that reason, it is necessary to restrain liquefaction- induced differential settlement by an economical method and simple to be implemented.
There are much research has been carried out to investigate the liquefaction phenomenon after the two main earthquakes in 1964, which are Niigata earthquake, Japan, and Alaska earthquake, United States, since the impact of liquefaction on the built environment was introduced to the geotechnical engineering community, in particular, related to the liquefaction-induced settlement.
Ueng et al. (2010) presented that significant volume changes occur only when there is liquefaction of sand. Otherwise, the settlement is very small. Correspondingly, Maharjan and Takahasihi (2013) reported the results of dynamic centrifugal tests conducted to investigate the liquefaction mechanism in non-homogeneous soil deposits. In the following year, Maharjan and Takahashi (2014) conducted a study of the liquefaction-induced deformation of earthen embankments on non-homogeneous soil deposits and found that the embankment resting on non-homogeneous soil deposits suffer more damage compared to the uniform sand foundation of same relative density.
Among the variety of liquefaction countermeasure methods proposed, the use of gravel, geosynthetics, or geosynthetics in conjunction with gravel attracted some attention due to their effectiveness and relatively low cost. This method is thought to be a good technique to mitigate liquefiable soil problems. As presented by Murakami et al. (2010), a combination of geosynthetics and gravel in order to restrain liquefaction in embankments, focused on the vertical displacement of the embankments. The result showed that the settlement of the embankments decreased by nearly 35% by using gravel and geosynthetics. They concluded that the use of geosynthetics sandwiched between gravel would have high resistance against bending deformation due to the overburden load of the embankment. Even though this method does not overcome the occurrence of liquefaction completely, it does alleviate the excessive deformation such as settlement and lateral movement. Accordingly, some other research also showed a corresponding results, for example by use gravel presented by Orense et al. (2003), Morikawa et al. (2014), and Chang et al.
(2014), and geosynthetics utilized reported by Vercuil et al. (1997), Boominathan and Hari (2002), and Noorzad and Amini (2014).
This study highlights the performance of the gravel along with geosynthetics in order to reduce liquefaction-induced ground displacement, both horizontal and vertical displacement, by a series of shaking table tests. The effectivity of gravel and geosynthetics was evaluated through the ground displacement occurred on the ground surface.
2. Experimental Set Up
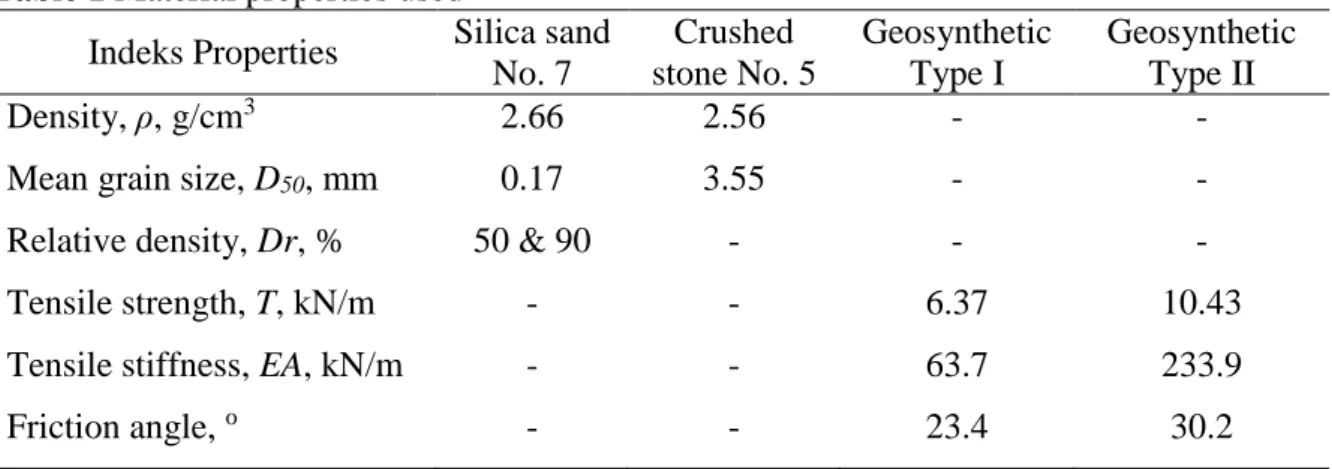
The sand container was used has dimensions of 150 cm length, 75 cm width, and 75 cm height, and built from galvanized steel and acrylic/Plexiglas. The sand used in this research was silica sand No. 7. The remedial measures used were gravel and geosynthetics. Crushed stone No. 5 was used to form a model of a gravel layer of 6 cm thick. Furthermore, a sheet of model geosynthetics made of polyethylene placed at the bottom, in the middle, and at the top of the gravel layer. Also, geosynthetics with different friction properties also used to determine the effect of geosynthetics friction on ground deformation. Properties of the materials used (silica sand No. 7, crushed stone
No. 5, and geosynthetics type I and type II) in this series of tests can be seen in Table 1. The photograph of the model geosynthetics used is shown in Figure 1. In this series of tests, input harmonic wave used were as follows: frequency 5 Hz, a target maximum input acceleration of around 80 cm/s2, and a shaking duration time of 15 seconds.
2.1 Horizontal Displacement Experiments
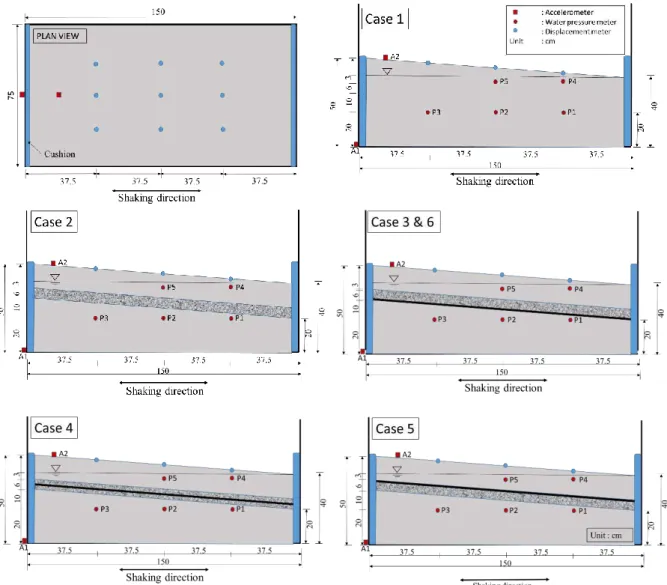
Figure 2 shows the plan view and the cross-section of the unreinforced model (Case 1), reinforced with gravel (Case 2) and gravel accompanied by geosynthetics (Cases 3 - 6) along with the layout of accelerometers, water pressure meters, and displacement meters. The ground in the model composed of a liquefiable sand layer with a relative density around 50% and a mildly sloping ground surface of around 4o.
Table 1 Material properties used
Indeks Properties Silica sand No. 7
Crushed stone No. 5
Geosynthetic Type I
Geosynthetic Type II Density, ρ, g/cm3
Mean grain size, D50, mm Relative density, Dr, % Tensile strength, T, kN/m Tensile stiffness, EA, kN/m Friction angle, o
2.66 0.17 50 & 90
- - -
2.56 3.55
- - - -
- - - 6.37 63.7 23.4
- - - 10.43 233.9 30.2
Figure 1 Geosynthetics used; (a) Type I, (b) Type II
Figure 2 Plan view and cross-section lateral spreading experiments
2.2 Vertical Displacement Experiments
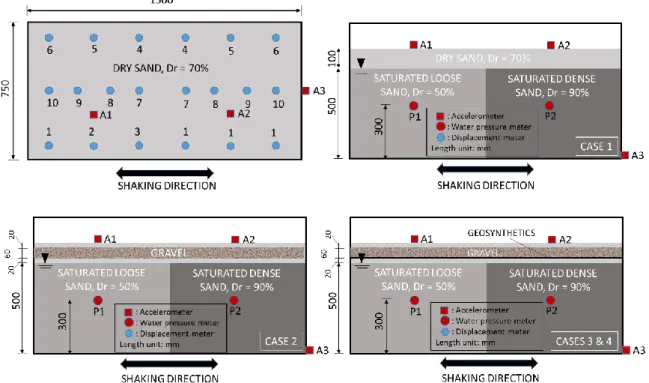
Figure 3 shows the plan view, and the cross-section of the unreinforced model (Case 1), reinforced with gravel (Case 2) and gravel accompanied by geosynthetics type I and type II (Cases 3 and 4) along with the layout of accelerometers, water pressure meters, and displacement meters.
The ground in the model composed of a liquefiable layer with a relative density around 50%, non- liquefiable part with relative density 90% in dense condition, and dry sand on the ground surface.
Figure 3 Plan view and cross section vertical displaacement experiments
3. Experiment Results and Discussion
A summary of the main data measured during the shaking table test such as excess pore water pressures and lateral ground movements are presented and discussed.
3.1 Horizontal Displacement Experiments A. Pore Water Pressure
Pore water pressures were observed by installing five pore water pressure transducers at two different levels. P1, P2, and P3 were located below the gravel layer, around 20 cm from the bottom of the sand container, while P4 and P5 were sited above the gravel layer about 37 cm from the bottom of the sand container. Excess pore water pressure measured were converted to excess pore water pressure ratio by dividing excess pore water pressure with initial vertical effective stress (σv’). Excess pore water pressure ratio time histories are shown in Figures 4.
Figure 4 Pore water pressure ratio of horizontal displacement experiments
According to the graph, the pore water pressure ratio acquired from Case 3, which is geosynthetic put at the bottom part of the gravel layer, resulting in the lowest pore water pressure ratio compared to other cases, for all transducers (P1 –P5). This is assumed due to by placing geosynthetic under the gravel, the two materials remain united during shaking, even becoming more coherent, and resulting in maximum results in reducing pore water pressure and accelerate the dissipation process.
B. Lateral spreading
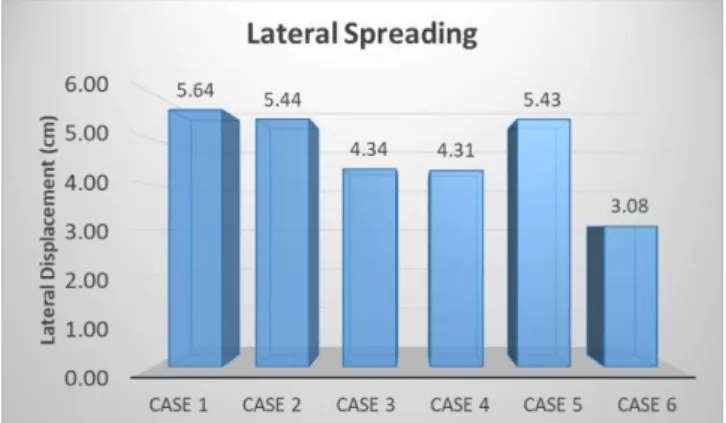
Lateral displacement was measured through nine points on the ground surface for five different states; no countermeasure (Case 1), gravel only (Case 2), and geosynthetic type I placed at the bottom of the gravel (Case 3), in the middle (Case 4), at the top of the gravel (Case 5) and geosynthetic type II put at the bottom of the gravel layer (Case 6). In order to simplify understanding, the lateral displacements measured are averaged as shown in Figure 5.
Figure 5 Averaged ground surface lateral spreading
It can be observed that based on the average values of the lateral displacement measured, the presence of the proposed mitigation measures could reduce lateral displacement in varying amounts. The good results were obtained in cases 3 and 4, where the deformation was reduced more than 20% compared to case 1. Conversely, lateral deformation obtained in case 5, as well as case 2, are only slightly decreased compare to case 1, around 4%. To determine the effect of geosynthetic with different friction characteristics with the previous type, a shaking table test using geosynthetic type II placed at the bottom of gravel performed (Case 6). Geosynthetic type II is placed under the gravel layer because based on previous testing using geosynthetic type 1, although lateral movement obtained between geosynthetic laying at the bottom (Case 3) and in the middle of gravel (Case 4) give the same results, but the measurement of pore water pressure in the Case 3 gives the lowest pore water pressure of all cases. By using geosynthetic type 1 with a friction angle of 23.4o, the lateral spreading obtained is 4.34 cm (decreased by 23% compared to Case 1),
while using geosynthetic type II that has a friction angle of 30.2o, lateral spreading occurred only 3.08 cm (reduced around 45% compared with case 1). The coherence of the gravel layer with its high permeability and high tensile strength provided by geosynthetics were considered as the main reason for this good result. Since the tension generated in the geosynthetics restrain the deformation of the gravel layer and integrally behaves like a board, this reinforcement could reduce the liquefaction-induced lateral deformation that occurred on the ground surface.
3.2 Vertical Displacement Experiments A. Pore Water Pressure
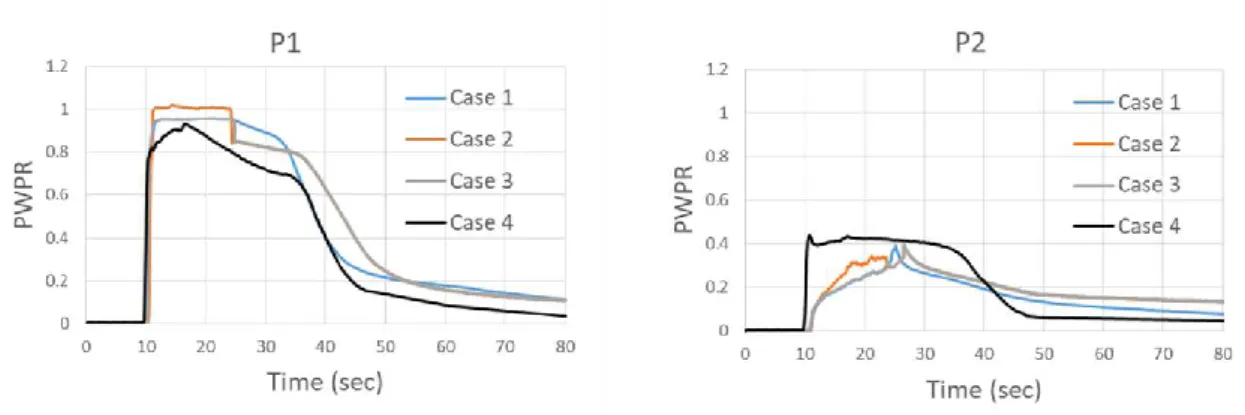
Pore water pressure was observed by installing two pore water pressure transducers at 30 cm from the bottom of the sandbox, either for the loose sand or dense sand parts. Excess pore water pressure measured was converted to pore water pressure ratio (PWPR) by dividing excess pore water pressure with initial vertical effective stress (σv’). Pore water pressure ratio time histories are shown in Figure 6.
Figure 6 Pore water pressure time histories of vertical displacement experiments
Generally, the results obtained show an insignificant difference in all cases, both for P1 and P2. As can be seen in Figures 4.6, for water pressure meter placed in the loose sand zone (P1), although the maximum PWPR obtained is around 1 for Case 2, but the maximum value in Cases 1 and 3 is also immensely close to 1, around 0.97, which indicate that liquefaction occurred. In Case 4, the maximum PWPR is only slightly lower and showed a faster water pressure dissipation, compared to other cases. Correspondingly, as shown in Figure 4.7, for the dense sand state (P2), the maximum PWPR acquired is almost similar for all cases of about 0.4, even though the highest PWPR in Case 4 is little higher compared to other cases. These results signify that no liquefaction occurred in this zone.
B. Ground Acceleration
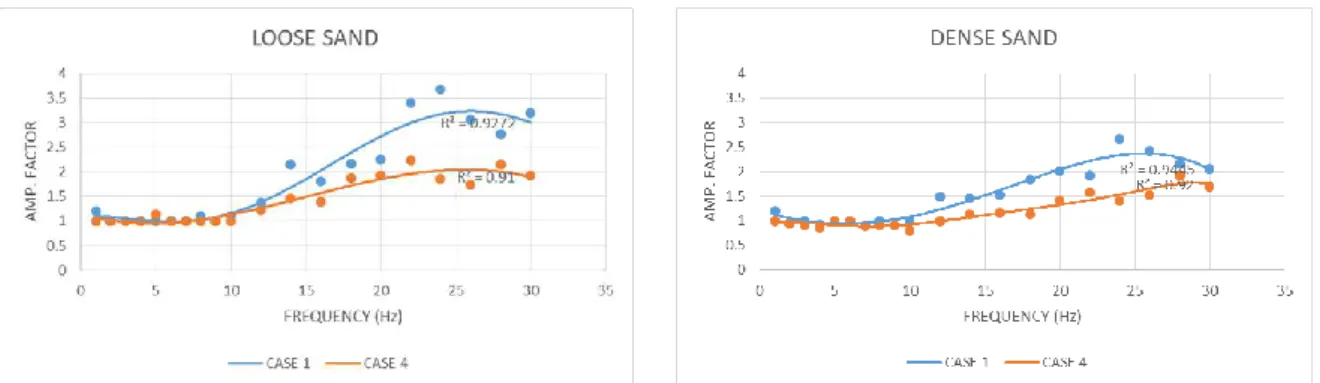
To determine the impact of gravel and geosynthetic use on ground acceleration, both on the loose and dense sand, a series of additional tests were performed. The results of this test will be
analyzed and will be determined by changes of amplification factors on each test. The amplification factor is the ratio between the amplitude acceleration measured at the ground surface divided by the amplitude of the input acceleration on each test performed. Only 2 cases will be tested on this test, namely case 1 and case 4. Figure 7 shows the value of the resulting amplification factor ratios in loose sand condition (A1) and dense sand condition (A2). From this figure, it appears that for the loose sand conditions, the amplification decreases by about 38%, from about 3.7 in Case 1 to 2.3 in Case 4. Similarly, in dense sand conditions, although not as significant as loose sand conditions, amplification factor also decreased by about 30%, from 2.7 in case 1 to 1.9 in case 4. According to the results above, it is confirmed that gravel and geosynthetics that used in Case 4 effectively reduce the amplification factor of the ground, both in the loose and dense conditions.
Figure 7 Ground amplification factor of vertical displacement experiments
Figures 7 also revealed that the effect of gravel and geosynthetic to reduce the acceleration amplification was found more significant in the dense soil conditions than that of the looser one.
In the high-density sand, the maximum amplification factor ratios for Case 4 are around 1.9, whereas for Case 1 approximately 2.3. This can be attributed to the more efficient interaction between gravel, geosynthetics, and sand grains at high density. It is speculated that the thickness, apertures, the roughness, and tensile strength of the geosynthetics constituted a stronger interlock with the high-density soils than that of looser one due to loose sand corresponds to a higher void ratio and larger pore diameters. Furthermore, it can also be concluded that the soil density has a significant effect on the acceleration amplification. The looser soil conditions result in larger amplification which thought due to the higher void ratio of the looser soils.
C. Ground Settlement
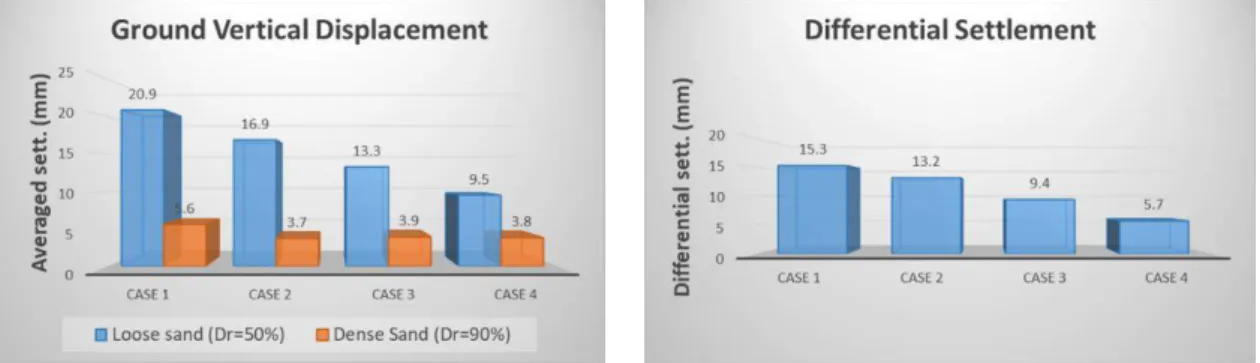
The vertical ground displacement occurred through ten different points at the ground surface was measured. To simplify understanding, the displacement values are averaged, and the results can be seen in Figure 8. It can be observed that based on the averaged vertical ground displacement measured, the presence of the proposed mitigation could reduce vertical displacement in various
amounts, for example, by use gravel only (Case 2), in the loose sand condition, the settlement was decreased around 4 mm, from 20.9 mm to 16.9 mm, and reach approximately 1.9 mm for the dense condition, from 5.6 mm to 3.7 mm. Moreover, by applying gravel and geosynthetics type I (Case 3), the displacement was reduced up to 7.6 mm and 1.7 mm in the loose sand and dense sand conditions, respectively. Maximum results are shown on reinforcement with gravel and geosynthetics Type II, which the ground settlement lowered around 11.4 mm in loose sand condition and 1.8 mm in the dense sand state, compared to Case 1.
Furthermore, the differential settlement between non-liquefiable and liquefiable zones is compared, as shown in Figure 8. In the Case 1, the settlement difference is 15.3 mm, while in Case 2 is 13.2 mm, which means decreased 2.1 mm. The differential settlement is reduced up to 5.9 mm and 9.6 mm in Case 3 and Case 4, respectively.
The coherence of the gravel layer with its high permeability and high tensile strength provided by geosynthetics were considered as the main reason for this good result. Since the tension generated in the geosynthetics restrain the deformation of the gravel layer and integrally perform like a rigid plate with high permeability, this reinforcement could reduce the settlement that occurred on the ground surface. Since the tensile strength and the tensile stiffness of geosynthetics Type II that used in Case 4 is higher compared to type I, this type of geosynthetics could restrain the deformation of the gravel and sand better than Type I, resulting in lower ground vertical displacement compared to geosynthetics Type I that used in Case 3.
Figure 8 Averaged ground settlements and differential settlements
4. Conclusions
In order to measure the effectiveness of gravel and geosynthetics remediation to reduce the liquefaction-induced lateral spreading of liquefiable soils, a series of shaking table tests were performed. The test results showed ground improved with geosynthetics type II (with friction angle 30.2o) placed under the gravel layer produced the maximum reduction of lateral ground deformation compared to other cases, decreased by around 45% compared to no countermeasures
model. Furthermore, the settlement of the ground surface decreased by around 54% in the liquefiable zone and up to 32% in the non-liquefiable zone. It is also observed that the differential settlement between liquefiable sand and non-liquefiable in the same condition decreased by about 62%.
References
Boominathan, A. and Hari, S. (2002) Liquefaction strength of fly ash reinforced with randomly distributed fibers, J.
Soil Dynamics and Earthquake Engineering 22, pp. 1027-1033.
Chang, W. J., Chang, C. W. and Zheng, J. K. (2014) Liquefaction characteristics of gap-graded gravelly soils in K0
condition, J. Soil Dynamics and Earthquake Engineering 56, pp. 74-85.
Maharjan, M. and Takahashi, A.(2013) Centrifuge model tests on liquefaction-induced settlement and pore water migration in non-homogeneous soil deposits, J. Soil Dynamics and Earthquake Engineering 55, pp. 161-169.
Maharjan, M. and Takahashi, A.(2014) Liquefaction-induced deformation of earthen embankments on non- homogeneous soil deposits under sequential ground motions, J. Soil Dynamics and Earthquake Engineering 66, pp. 113-124.
Morikawa Y., Maeda K. and ZHANG F. (2014) Effectiveness of Crushed Tile in Countermeasure Against Liquefaction, Journal of GEOMATE, Vol. 7 No. 1 (S1. No. 13), pp. 1003-1008.
Murakami, K., Kubo, M., Matsumoto, T. and Okochi, Y. (2010) Study on the effect of deformation control embankment during liquefaction by using geosynthetic sandwiched between gravel, Geosynthetics Engineering Journal, Vol. 25, pp. 133-140.
Noorzad, R. and Amini, P. F. (2014) Liquefaction resistance of Babolsar sand reinforced with randomly distributed fibers under cyclic loading, J. Soil Dynamics and Earthquake Engineering 66, pp. 281-292.
Orense, R. P., Morimoto, I., Yamamoto, Y., Yumiyama, T., Yamamoto, H. and Sugawara, K. (2003) Study on wall- type gravel drains as liquefaction countermeasure for underground structures, J. Soil Dynamics and Earthquake Engineering 23, pp. 19-39.
Setiawan, H., Serikawa, Y., Nakamura, M., Miyajima, M., Yoshida, M. (2017) Structural damage to houses and buildings induced by liquefaction in the 2016 Kumamoto Earthquake, Japan. Journal of Geoenvironmental Disasters 4:13. DOI: 10.1186/s40677-017-0077-x.
Takahashi, A., Seki, S., Pramadiya, A., Kurachi, Y., Aung, H. and Kubo, M. (2015) Dynamic centrifuge model tests for a liquefaction-induced deformation control method by utilizing geosynthetics, The 50th Geotechnical Research Presentation (Sapporo).
Ueng, T. S., Wu, C. W., Cheng, H. W., and Chen, C. H. (2010) Settlements of saturated clean sand deposits in shaking table tests, J. Soil Dynamics and Earthquake Engineering 30, pp. 50-60.
Vercuil, D., Billet, P. and Cordary, D. (1997) Study of the liquefaction resistance of saturated sand reinforced with Geosynthetics, J. Soil Dynamics and Earthquake Engineering 16, pp. 417-425.
Zeybek, A. and Madabhushi, S. P. G. (2017) Influence of air injection on the liquefaction-induced deformation mechanisms beneath swallow foundations, J. Soil Dynamics and Earthquake Engineering 97, pp. 266-276.