Phase transition and dynamics of water confined in nanoscale spaces
著者 宮東 達也
著者別表示 Miyatou Tatsuya journal or
publication title
博士論文本文Full 学位授与番号 13301甲第4477号
学位名 博士(理学)
学位授与年月日 2016‑09‑26
URL http://hdl.handle.net/2297/46579
Creative Commons : 表示 ‑ 非営利 ‑ 改変禁止 http://creativecommons.org/licenses/by‑nc‑nd/3.0/deed.ja
i
博士論文
Phase transition and dynamics of water confined in nanoscale spaces
金沢大学大学院自然科学研究科 物質科学専攻
学籍番号 1123132311 氏名 宮東達也
主任指導教員名 水野元博 提出年月 H28 年7月
ii
Table of contents
Chapter 1 Introduction ... 1 1. Water confined with various mesoporous silica ... 1 2. Water confined with mesoporous silica SBA-16 ... 3 3. Water in sodium chloride aqueous solution confined with mesoporous silica SBA-16 ... 4 4. Hydration water in proteins crystal ... 4 Chapter 2 Experimental detail ... 7 1. Sample preparations ... 7 2. NMR measurements ... 8 3. Differential Scanning Calorimetry (DSC) ... 9 Chapter 3 Nuclear Magnetic Resonance (NMR) ... 12 1. Simulation of solid-state 2H NMR spectrum ... 12 2. NMR spin-lattice relaxation time (T1) ... 15 3. NMR spectral density in the case of correlation time distribution ... 16 Chapter 4 Water confined with mesoporous silica SBA-16 ... 17 1. DSC analysis of phase changes of water confined in SBA-16 ... 17 2. NMR spectrum of SBA-16 pore water ... 18 3. Rotational correlation time obtained by 2H NMR T1... 25 4. Conclusion ... 29 Chapter 5 Sodium chloride aqueous solution confined with mesoporous silica SBA-16 ... 30 1. Salts concentration inside pore obtained by NMR signal intensity ... 30 2. DSC analysis of sodium chloride aqueous solution confined with SBA-16 ... 31 3. 2H NMR spectrum of sodium chloride aqueous solution confined with SBA-16 ... 33 4. Rotational correlation time obtained by NMR T1 ... 37 5. Conclusion ... 42 Chapter 6 Hydration water of proteins crystal ... 43 1. 2H NMR spectrum and T1 ... 43 2. 2H NMR partially relaxed spectrum ... 47 3. Conclusion ... 50
iii
Chapter 7 Conclusion ... 51 Reference ... 52 Acknowledgment ... 58 Appendix ... 59
1
Chapter 1 Introduction
Chapter 1 is introduction of this dissertation entire. This dissertation discusses the physico-chemical property of water confined with nanoscale spaces. In section 1, general property of water confined with various mesoporous silica is described. Additionally, previous research about water confined with various mesoporous silica is presented.
Confined water discussed in this dissertation fall into three categories. They are water confined with mesoporous silica SBA-16, water in sodium chloride aqueous solution confined with mesoporous silica SBA-16, and hydration water in the proteins crystal, respectively. The introduction of individual topic is described in greater detail in the following sections. Chapter 2 shows experimental detail containing sample preparation, solid-state NMR measurements and the rest. Chapter 3 shows basic principle of NMR, which is main experimental tool in this dissertation. Measurements and theory used in this dissertation is mainly described. Chapter 4-6 show results, discussions and conclusions of three individual topics. Chapter 7 shows conclusion of this dissertation entire.
1. Water confined with various mesoporous silica
Since the development of well-defined porous silica with programed pore shapes and
sizes, there has been marked progress in research on the freezing process of pore water [1, 2, 3, 4, 5, 6, 7, 8, 9, 10] [11, 12, 13, 14, 15, 16]. When free liquid water is statically
cooled to below the melting point, 273.2 K, it suddenly freezes at ~232 K, and is termed homogeneous nucleation freezing [17]. The spontaneous conversion to ice was observed just below the homogeneous nucleation temperature (HNT) for water microdroplets ( ~10 μm in diameter). In pores, freezing of water is much more complicated in nature, and depends upon pore structure (cylindrical or spherical), size, and connection and, if the pore is connected with external water, the nature of pore surfaces [6, 13, 15]. When water is confined to the cylindrical silica pores (d<3.8 nm), it freezes at temperatures predicted by the Gibbs-Thomson (GT) relation (Equation 1-1), independent of the presence of external water [6, 9].
where T0 is the melting temperature of bulk ice; TR is the melting temperature of water frozen in the effective cylindrical pores of radius Ref (=R-σ: R, pore radius; σ, unfrozen water layer thickness at the solid-liquid interface), and ν is the molar volume of water
Equation 1-1
ef I II
0 I II R
0
1 2
R H
T T v
T T
2
which is assumed to be constant during the change inphase. △γII-I and △HII-I are the changes in interfacial free energy and enthalpy during the melting of ice (I) to liquid water (II), respectively. Melting temperature is very similar to freezing temperature.
When pore size is larger than 3.8 nm and pore water is not connected to external water, GT relation does not hold. If pore water is not connected to external water, freezing temperature is lower than that predicted by the GT relation but certainly greater than the homogeneous nucleation temperature (HNT) of 232 K; see Figure 1-1.
Freezing of pore water in pores smaller than ~2.0 nm has not been detected by thermodynamic and structural analyses [9, 11]. Using narrow MCM-41 pores, the low temperature property of unfrozen water has been actively studied, and the transition from high density liquid (HDL) water to low density liquid (LDL) water, which were predicted from the actual phases of high density amorphous ice and low density amorphous ice, was substantiated [7, 11]. However, the liquid-liquid phase transition has been observed only in small cylindrical pores, in which crystal growth is strongly sterically limited. Thus it is suggested that crystallization (crystal growth) of the observed LDL phase is hindered.
There are already a number of physico-chemical studies related to this phase transition that used X-ray diffraction, neutron diffractions, NMR, FTIR, thermodynamics, etc [4, 7, 11, 14, 18, 19] [20, 21, 22, 23, 24, 25, 26, 27, 28, 29]. However, those results were explained by the effect of the interfacial property of the pore surface.
Another porous system that has been used to investigate super-cooled liquid water is
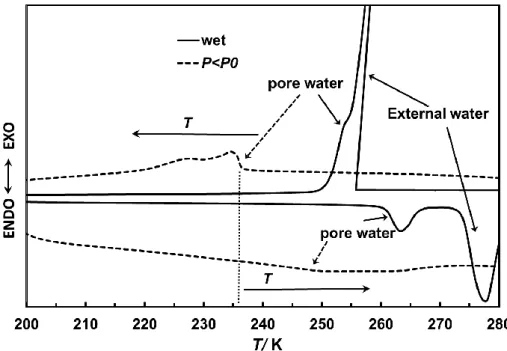
Figure 1-1 DSC curves of D2O fully and partially confined in MCM-41(C22).
3
cage-like porous silica (e.g. SBA-16 [30, 31], KIT [32] and FDU [33]) in which pore water is frozen constantly at ~232 K (HNT) independent of pore size less than d=8.9 nm [13]. These spherical pores are large enough for an ice crystallite to grow from the smallest embryo stage of ~4.0 nm [10, 34]. Although there have been a number of studies on the utility of chemical reactions as a catalyst [35, 36, 37, 38, 39, 40, 41], it is rare to find detailed studies on the nature of the liquid [42].
2. Water confined with mesoporous silica SBA-16
SBA-16 (SBA=Santa Barbara) is a certain type of mesoporous silica reported by Zhao et. al. [43]. SBA-16 has the three-dimensional pore structure (See Figure 1-2) [44]. SBA- 16 has the characteristic spherical mesopores. In addition to the main spherical pores, there are interconnecting channels and micropores, the corona in SBA-16. Thus, the properties of materials involved in this type of porous system must be analysed by accounting for these additional pore components. The pore size of mesopore and the amount of micro pore is controllable by changing the synthesis condition [45, 46, 47].
Before now, there has been many works about SBA-16 containing the application to absorptive medium, catalyst etc. for the good of the controllability of pore shape [48].
With the aim of such application, it is important how the molecules of solute or solvent exist inside mesopores and micropores. In the case of SBA-16, the diffusivity of n- heptane, cumene and mesitylene was confined with the pore was investigated previously [49].
The present study uses solid NMR to study the rotational property of water, D2O and H2O included in SBA-16 samples having different pore characteristics. NMR was previously used for cryoporometry on this sample and showed the existence of throat (interconnecting channel) and cage-like pores [50]. However, no detailed study on the nature of pore water exists.
Figure 1-2 The image of mesoporous silica SBA-16 [106].
4
3. Water in sodium chloride aqueous solution confined with mesoporous silica SBA-16
In the actual application (catalyst, biology, and so on), the system consisting of a single component molecule is rare case. The actual system is almost always more complicated (e.g. multicomponent solution). Then, the property of solution confined with nanoscale spaces is very interesting. The thermodynamics and dynamic property of aqueous solution confined with nanoscale spaces was studied by computer simulation [51, 52, 53, 54, 55], thermal analysis [56, 57], neutron scattering [58], NMR [59] and so on. The vitrification of sodium chloride aqueous solution was induced by the nanoscale confinement [56]. In the case of SBA-16, the proton transport in dilute electrolyte solution confined with SBA- 16 was investigated previously [60]. In the case of pure water, water confined with SBA- 16 freeze at nearly homogeneous nucleation temperature (HNT) [13]. As adding alkali halide (e.g. sodium chloride) to water, HNT of this bulk aqueous solution decrease until around 195 K with increasing the salt concentration [61]. It is not clear how freezing of aqueous solution confined with nanoscale space is different from that of bulk.
In the present work, the state of sodium chloride aqueous solution confined with SBA- 16 was investigated as function of concentration. First, the actual sodium concentration in the pore was determined from the ratio of 23Na NMR signal intensity and 2H NMR signal intensity. Next, the freezing and melting of aqueous solution in the pore was investigated by DSC and 2H NMR spectrum. The rotational correlation time of water molecules in the pore was investigated by 2H NMR T1. The correlation time of reconfiguration of water near sodium cation was investigated by 23Na NMR T1. The combination of 2H NMR T1 and 23Na NMR T1 can show the dynamics of water molecule as function of distance from sodium cation. The freezing mechanism of aqueous solution and the dynamics of water as changing the salts concentration in the pore of SBA-16 was discussed.
4. Hydration water in proteins crystal
The changes in the structure and dynamics of proteins are caused by glass transition and these changes are directly related to the biological activity of proteins [62, 63, 64, 65].
Figure 1-3 shows the structure of bovine serum albumin (BSA). The glass transition of BSA-water system has been investigated by thermal analysis [66, 67]. A sample quenched from 300 K down to 80 K showed a jump in heat capacity indicating a glass transition temperature Tg of 170 K. When the sample was annealed at 200-240 K, the relaxation effects resulted in three glass transition temperatures: Tg = 110, 135 and >180 K. The
5
glass transition above 180 K is considered to originate from a rearrangement in the motion of the disordered region of the protein. Based on dielectric measurements, the corresponding glass transition was observed at 200 K [68, 69]. The transition accompanying the change in the dynamics of protein and hydration water, also known as the dynamic transition, was found at about 200 K [62, 63, 64, 65]. The glass transitions at Tg = 110 and 135 K are considered to be caused by a rearrangement in the motions of primary hydrate water forming a direct hydrogen bond with the protein and part of the internal water localized in the opening of a protein’s structure, respectively. Thus, for hydrated proteins, the dynamics of hydration waters plays very important roles in the glass transition. Therefore, detailed analysis of the dynamics of hydration waters around the glass transition is important to investigate the physical properties of proteins.
Previously, the relations between the dynamics of hydration waters and the glass or dynamical transition were investigated by various methods [68, 69, 70, 71, 72, 73, 74, 75, 76, 77].
NMR is an effective method to study molecular dynamics and local structures in hydrated proteins [78, 79, 80, 81, 82, 83, 84, 85, 86, 87] [88, 89, 90]. There have been several investigations of the structure and dynamics of BSA using NMR [87, 90]. To investigate the dynamics of water molecules, solid-state 2H NMR is especially efficient, since the rate and mode of reorientational motions of molecules can be analyzed strictly from the line shape of a broad-line spectrum and T1 [91, 92, 93, 94, 95, 96, 97, 98, 99, 100] [101]. Thus far, the dynamic properties of hydration waters in elastin, collagen, and myoglobin have been analyzed using 2H NMR (T1) [102, 103, 104]. Although the deuteration causes a slight change in its bonding properties, the glass transition behavior and dynamics of water were little affected by deuteration [77]. In the present work, we tried to apply simulation analysis of solid-state 2H NMR spectra to BSA to obtain more detailed information of the dynamics and structure of hydration waters and to clarify the relations between these two properties and glass transitions. Simulation of 2H NMR broad-line spectra, including distribution of the motions of water molecules, was performed. Changes in the motional mode, rate and D-O-D angles of hydration waters in BSA with decreasing temperature were investigated using the simulation analysis of 2H NMR broad-line spectra and T1.
6
Figure 1-3 The structure of Bovine Serum Albumin(BSA) [Protein Data Bank Japan (PDBj) PDB ID 3V03]
7
Chapter 2 Experimental detail
The details of experiments performed in this dissertation is shown in Chapter 2. Section 1 shows the sample preparations for various measurements. Section 2 and Section 3 shows experimental condition of various measurements.
1. Sample preparations
1-1. Water confined with SBA-16
SBA-16 samples were formed as in a previous study [13] (See Figure 2-1). Sample names are as follows: SBA-16(t), where t is the temperature (℃) for the preparation of hydrothermal treatments. Pore properties were determined by N2 adsorption at the temperature of liquid nitrogen and H2O adsorption at 298.2 K. Pore diameters of pore(cage) are: 6.0 nm for SBA-16(45), 7.0 nm for SBA-16(65), 7.8 nm for SBA-16(80), 8.0 nm for SBA-16(100), and 11.0 nm for SBA-16(120). The pore parameter of SBA-16 prepared in this study is shown in Table 2-1. The samples prepared at ambient conditions were partially hydroxylated with H2O to form surface OHs. Accordingly, for 2H NMR measurements, they were thoroughly deuterated as follows. After evacuation by using a turbomolecular pump, samples were exposed to saturated D2O vapor at room temperature overnight. This process was repeated twice more, followed by suspension in liquid D2O.
This sequential D2O treatment ensured thorough exchange from the surface of the OH type to that of the OD type. In order to introduce D2O into the OD type sample, it was suspended in liquid D2O and internal air in the pores was extracted by evacuation of the suspension to introduce D2O instead. Samples were precipitated from suspension in the NMR sample holder.
1-2. Sodium chloride aqueous solution confined with SBA-16
The sample used here was SBA-16(80) prepared in previous section. The diameter of pore(cage) was 7.8 nm as previously shown. Prepared SBA-16 powders became mixed with deuterated sodium chloride aqueous solution (0.5 M, 1.0 M, 2.0 M, 4.0M), then the solution was introduced into the pore by expelling any remaining air. The sample for 2H NMR was sealed in a glass tube 6 mm in diameter and about 25 mm in length. The sample used by 23Na NMR and a part of 2H NMR was sealed in a polypropylene tube 5 mm in diameter and about 30 mm in length. The excess solution coexisted around SBA-16 powders in a sample tube.
1-3. Hydration water in proteins crystal
8
Bovine serum albumin(BSA) was obtained from Wako Pure Chemical Industries. BSA powder hydrated with D2O was prepared by repeated recrystallization three times from D2O. The hydration level of samples was determined from the observed mass change of dried samples. Although the contents of small particles such as salt ions potentially present may give uncertainness, the hydration level of samples was estimated as h = 0.26 (h: gram of water per gram of protein). The sample was sealed in a glass tube 6 mm in diameter and about 20 mm in length.
2. NMR measurements
2-1.2H NMR
The NMR apparatus used in the case of SBA-16 series and in the case of protein crystals were JEOL ECA 300 and Chemagnetics CMX-300, respectively. The 2H NMR frequencies were 45.282 MHz (JEOL ECA 300) and 45.825 MHz (Chemagnetics CMX- 300), respectively. The JEOL NMR probe was used. The sample temperature was controlled with a nitrogen-gas-flow temperature controller (JEOL VT1A). 2H NMR spectrum was conducted by the quadrupole-echo method. The spin-lattice relaxation time T1 was measured by the inversion recovery method. To avoid the effect of external water or solution, a saturation recovery sequence was employed. The 2H NMR T1 for frozen ice was sufficiently long, because of slow molecular reorientation [101]. Thus, the NMR signal from frozen ice outside pore was eliminated by the saturation pulse train. The 2H NMR partially relaxed spectrum was observed by a sequence (90˚-τs-)n-τr-90˚x-τe-90˚y-τe- τacq which contain a quadrupole echo method and a saturation recovery method. Here, τs, n, τr, τe, and τacq are the interval of saturation pulse, the number of saturation pulse, the wait time for spin relaxation, and interval of echo and acquisition time. In the case of SBA-16 series, the 90˚ pulse width, τe, τs, and n were 2.8 μs, 20 μs, 2 ms and 40, respectively. The wait time τr was selected five times as long as T1 of the fastest relaxation component. In the case of protein crystals, the 90˚ pulse width, τe, τs, and n were 2.7 μs, 20 μs, 0.1 ms and 5, respectively. Temperature dependence of the NMR signal intensity due to the fraction of spin polarization was corrected under Curie's law. The simulation of 2H NMR spectrum was performed by homemade Fortran programs using double precision [100].
2-2.1H NMR
The used apparatus was JEOL ECA 300. The resonance frequency of 1H NMR was 294.988 MHz. The JEOL static 1H NMR probe was used. The pulse sequence DEPTH2 was used for background suppression. The 90° pulse width was 1.6 μs.
9
2-3.23Na NMR
The resonance frequency of 23Na NMR was 78.030 MHz. The same NMR probe used at 2H NMR was used here again. The resonance frequency of the probe was switched by replacing the stick of the condenser. The 23Na NMR spectrum was observed by a single pulse method. 23Na NMR T1 was measured by the inversion recovery method. To avoid the effect of external solution, a saturation recovery sequence was employed. The 23Na NMR partially relaxed spectrum was observed by a sequence (90˚-τs-)n-τr-90˚-τacq which contain a single pulse method and a saturation recovery method. The 90˚ pulse width of liquid-state was 1.9 μs. τs and n were 2 ms and 40, respectively. The wait time τr was selected in a manner completely analogous to 2H NMR. 23Na NMR Chemical shift were expressed as values relative to 3.0 M deuterated sodium chloride aqueous solution.
2-4.Sodium concentration measurement by using NMR
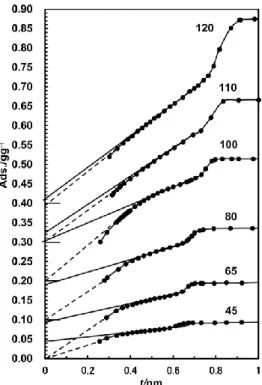
The standard curve between 23Na NMR signal intensity (INa) / 2H NMR signal intensity (ID) and number of sodium cation (NNa) / number of deuterated water molecule (ND2O) was made by measuring the deuterated standard sodium chloride aqueous solution (NNa/ND2O = 0.073353, 0.03631, 0.01790, and 0.009090).(See Figure 2-2) The deuterated standard sodium chloride aqueous solution was prepared by mixing a certain mass of sodium chloride and heavy water. The sodium chloride (special grade) and heavy water (D, 99.9%) were obtained from Wako Pure Chemical Industries and Cambridge Isotope Laboratories Inc., respectively. The measurements of standard sample were carried out at room temperature. The spectra were observed by a single pulse method. The wait time of the measurement was selected ten times as long as T1. The measurements of samples were carried out at room temperature and at 238 K. At 238 K, the sodium chloride aqueous solution outside pore was frozen. The NMR signal of the solution inside pore of SBA-16 was selectively observed by using T1 and line-shape difference. From the measurements at room temperature, the NMR signal of the solution both inside and outside pore were observed.
3. Differential Scanning Calorimetry (DSC)
DSC measurements were made on samples prepared for the NMR measurements. Wet sediment was placed in an aluminium DSC cell and hermetically sealed. Scanning speed was 5 Kmin-1 for both cooling and warming directions. The DSC apparatus used was Q10 (TA Instruments, USA).
10
SBA-16(45) SBA-16(65) SBA-16(80) SBA-16(100) SBA-16(120)
Diameter of spherical mesopore (nm)
4.6 7.0 7.8 8.0 11.0
Ratio of micro pore 0.468 0.462 0.366 0.317 0.053
Diameter of micro pore (nm)
0.72 0.80 0.90 1.0 1.0>
Triblock copolymer Pluronic F127(EO
100PO
65EO
100) EO: Ethylene Oxide PO: Propylene Oxide
2 g
2 mol dm
-3
HCl aqueous solution
200 g
Mixed and left to stand at 45 ℃ during 24 hours Micelle solution
Tetraethoxysilane 10.5 g
Mixture
Sealed and hydrothermal treatment at t ℃ during 48 hours
Washed by distillated water and dried at 100 ℃
Calcination at 600 ℃ under N
2 gas atmosphere during 4 hours
SBA-16(t)
Mixed and left to stand at 45 ℃ during 20 hours
Figure 2-1 Synthetic process of SBA-16 according to ref. [13]. Sample names are as follows: SBA-16(t), where t is the temperature (℃) for the preparation of hydrothermal treatments.
Table 2-1 The pore parameter of SBA-16 prepared in this study.
11
Figure 2-2 Horizontal: Number ratio of sodium cation divided by deuterated water molecule (NNa/ND2O). Vertical: Ratio of 23Na NMR signal intensity divided by 2H NMR signal intensity (INa/ID). The standard curve (solid line) was obtained by measurements of the deuterated standard sodium chloride aqueous solution.
0 0.02 0.04 0.06 0.08 0.1
0 0.1 0.2 0.3 0.4 0.5
NNa / ND2O INa /ID
y = 3.466x
12
Chapter 3 Nuclear Magnetic Resonance (NMR)
The technical details of NMR measurements mainly used in this dissertation is shown in Chapter 3. Section 1 shows the analysis of 2H NMR line-shape. Section 2 shows theory of NMR spin-lattice relaxation time (T1). Section 3 shows handling in the case of distribution of rotational correlation time.
1. Simulation of solid-state 2H NMR spectrum
2H nucleus has spin quantum number I = 1. In the case of I ≥ 1, the quadrupolar interaction mainly affects NMR spectrum line-sharp in solid-state. The quadrupolar interaction is the interaction between electric quadrupole moment (eQ) of nucleus and electric field gradient (Vˆ ) at nucleus position. The quadrupolar interaction Hamiltonian is following equation (Equation 3-1).
Here, ˆ ( , , )
z y
x I I
I
I is nuclear spin angular momentum operator where z axis is corresponding the direction of static magnetic field in the laboratory (laboratory frame).
In the laboratory frame, Vˆ is represented by second rank Cartesian tensor (Equation 3-2).
Here, V V
where V is potential energy of nucleus. Vˆ matrix can be diagonalized by coordinate rotation to appropriate frame known as principal axis frame.
Here, R(α,β,γ) andV33,V22,V11 is the rotation matrix of Euler angle (α,β,γ) (Appendix B in ref. [105] ) and principle values of tensor, respectively. V33eq, asymmetry parameter
33 22 11
V V V
is defined. Trace(Vˆ ) = 0 and the choice of the principal axis (V33 V22 V11 ) deduce
Equation 3-1
Equation 3-2
I I V I
I
HQ eQ ˆ ˆ ˆ
1 2 2
ˆ
zz zy zx
yz yy yx
xz xy xx
V V V
V V V
V V V Vˆ
33 22 11 1
0 0
0 0
0 0 )
, , ˆ ( ) , , (
V V V R
V
R Equation 3-3
13
The tensor Vˆ can be represented by eq, η, and (α,β,γ). The rotation of tensor can be handled by using irreducible spherical tensor more conveniently. The quadrupolar Hamiltonian in the laboratory frame rewritten by using spherical tensor is following equation (Equation 3-5) [105].
Here, 𝐼±= 𝐼𝑥± 𝑖𝐼𝑦 which is known as raising and lowering operator. The irreducible tensor A is transformed under rotation as follow.
Here, Dpq(2)(ψ, θ, ϕ) is second-order Wigner rotation matrix (Appendix B in ref. [105] )of Euler angle (ψ, θ, ϕ) for transformation from the principal axis frame to the laboratory frame. The irreducible tensor APAS in the principal axis frame is as follow.
As using first-order perturbation theory and in the case of I=1, quadrupolar angular frequency is deduced as follow.
(3cos 1) sin cos2 4
) 3 ,
( 2 2
2
h
qQ e
NMR frequency do not depend on ψ because the laboratory is equivalence under axial rotation of the direction of static magnetic field. In the case of powder sample, NMR free induction decay (FID) is calculated as follow.
exp( i ( , ) ) exp(-i ( , ) )e sin d d 2
1 4
) 1
( 2
0 0
/ - 2
t t t T
t f
Here, the sign + and – represent of two kinds of transition mz =0 ↔ mz =-1 and mz =+1
↔ mz =0, respectively. NMR spectrum I(ω) is obtained by Fourier transformation of f(t).
Equation 3-7
Equation 3-8
3 1
6
1 2
20 I I I
T z T IzIIIz
2 1
1
2 T II
2 1
2 2
Equation 3-5
2
2
2
1 2
ˆ
q
q LAB q q
Q A T
H
) 1
, , ( 0
0
0 ) 1 2 ( 0
0 0
) 1 2 ( ) , ,
ˆ (
R
eq eq
eq R
V
2 2 2 1
, 1 0 1 ,
2 6 2
3 2
2 2 1
2 2
20
I I
qQ A e
I A I
A PAS e PAS PAS
2
2
2 2
2 , ,
p
pq PAS p LAB
q A D
A
Equation 3-4
Equation 3-6
14
t e t f
I()Re ( ) itd
The 2H NMR spectrum shows characteristic line-shape. Figure 3-1 shows the example of
2H NMR simulated spectrum. The quadrupole coupling constant e2qQ/h interacts width of line-shape and asymmetry parameter η affects figure of line-shape.
In the case of molecular reorientation, 2H NMR spectrum is considered. The fast isotropic rotation of molecules eliminates the broadening due to quadrupolar interaction fully. Then, 2H NMR spectrum become nearly Lorentzian function.
2 2 2 2
) 1
(
T I T
Here, T2 is spin-spin relaxation time. Full Width at Half Maximum (FWHM) of Lorentzian function is related to T2 as following equation.
2
FWHM 1
T
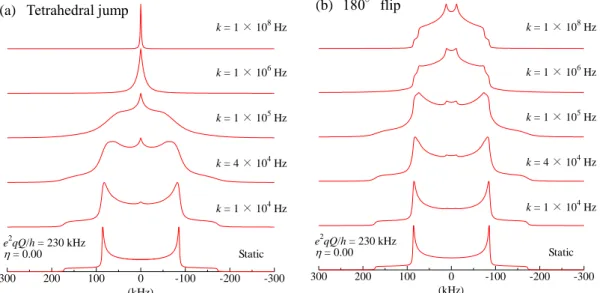
So, FWHM is affected by the degree of isotropy of molecular rotation. Other molecular rotation changes the line-shape of 2H NMR dependent to the geometry of rotation and the rate of rotation. The detail of simulation in the case of molecular reorientation is shown in ref. [100]. Figure 3-2 shows the typical example of 2H NMR simulated spectrum affected by reorientation of water molecules. 2H NMR spectrum affected by tetrahedral jump (4 sites jump) is shown in Figure 3-2 (a). This motion is observed in ice Ih crystal [101]. As the jumping rate k increases, the line-shape changes to narrow shape. At fast motion limit, the line-shape of tetrahedral jump is same as isotropic rotation (Lorentzian).
Equation 3-9
-300 -200 -100 0 100 200 300
(kHz)
e2qQ/h = 125 kHz
= 0.00
e2qQ/h = 125 kHz
= 1.00
e2qQ/h = 250 kHz
= 0.00
e2qQ/h = 250 kHz
= 0.20
e2qQ/h = 250 kHz
= 0.50
e2qQ/h = 250 kHz
= 1.00
Figure 3-1 Simulated spectrum of solid-state 2H NMR.
The quadrupolar parameter is shown near the line.
Equation 3-10
Equation 3-11
15
2H NMR spectrum affected by 180°flip of water (2 sites jump) is shown in Figure 3-2 (b). This motion was often observed in hydration water in metal salt crystals [100, 106]
and so on. At fast motion limit, the line-shape of 180°flip is similar to static powder pattern having small e2qQ/h and large η (See Figure 3-1). In this way, the rate and geometry of molecular motion can be obtained by using simulation analysis of 2H NMR line-shape.
2. NMR spin-lattice relaxation time (T1)
In the case of diamagnetic sample, 2H NMR relaxation is mainly dominated by quadrupolar interaction and molecular rotation. For the isotropic rotation of molecules,
2H(I=1) NMR T1 is written as 1
𝑇1 = 3𝜋2
10 (𝑒2𝑞𝑄 ℎ )
2
(1 +𝜂2
3) {J(𝜔) + 4J(2𝜔)}
where J(ω) is spectral density. In the case of single correlation time, J(𝜔) = 𝜏
1 + (𝜔𝜏)2
Here, ω and τ are NMR angular frequency and correlation time of molecular rotation, respectively. For the 180°flip of water molecules, 2H NMR T1 is written as
2 2
2 2 2
2 1
1 1 2
4 sin 1
40 9
h qQ T e
Equation 3-12
Equation 3-13
Equation 3-14
-300 -200 -100 0
100 200 300
(kHz) e2qQ/h = 230 kHz
= 0.00
k = 1 × 10⁸ Hz
k = 1 × 10⁶ Hz
k = 1 × 10⁵ Hz
k = 4 × 10⁴ Hz
k = 1 × 10⁴ Hz
Static
-300 -200 -100 0
100 200 300
(kHz) e2qQ/h = 230 kHz
= 0.00
k = 1 × 10⁸ Hz
k = 1 × 10⁶ Hz
k = 1 × 10⁵ Hz
k = 4 × 10⁴ Hz
k = 1 × 10⁴ Hz
Static
(a) Tetrahedral jump (b) 180°flip
Figure 3-2 Typical example of 2H NMR simulated spectrum affected by reorientation of water. (a) Tetrahedral jump (e.g. ice) and (b) 180°flip about C2 axis of water (D-O-D angle = 104 degree).
16
where θ is D-O-D angle of water.
In the case of 23Na (I=3/2) NMR, longitudinal relaxation with solid-state is biexponential [107]. But, that with liquid-state is exponential due to molecular rotation.
Then, the average 23Na NMR T1 due to isotropic motion is written as
1 𝑇1= 2𝜋2
25 (𝑒2𝑞𝑄
ℎ )
2
(1 +𝜂2
3) {J(𝜔) + 4J(2𝜔)}
3. NMR spectral density in the case of correlation time distribution
In the case of distribution of rotational correlation time, NMR spectral density J(ω) is expressed as follow equation.
Here, g/0 is the distribution function of correlation time. In the case of Cole-Cole distribution function (Equation 3-17), the Cole-Cole NMR spectral density 𝐽𝐶𝐶(𝜔) is written as Equation 3-18 [108].
𝐽𝐶𝐶(𝜔) = sin (𝜋
2 𝛼𝐶𝐶) (𝜔𝜏𝐶𝐶)𝛼𝐶𝐶 𝜔 {1 + (𝜔𝜏𝐶𝐶)2𝛼𝐶𝐶+ 2cos (𝜋
2)(𝜔𝜏𝐶𝐶)𝛼𝐶𝐶}
Here, τcc and αcc indicate the correlation time at the maximum position and the distribution width of correlation time, respectively. αcc=1 yields the case of a single correlation time and αcc decreases as the distribution width of correlation time increases. Cole-Cole distribution function is often used as distribution of relaxation time in dielectric relaxation measurement. Cole-Cole distribution has advantages of easy-to-use analysis and comparison to dielectric relaxation measurement.
Equation 3-15
Equation 3-18 Equation 3-17
CC CC
CC
gCC
cos ln
cosh 2
/ sin
0 0
2 / 0 ln / 0
1
g d
J
Equation 3-16
17
Chapter 4 Water confined with mesoporous silica SBA-16
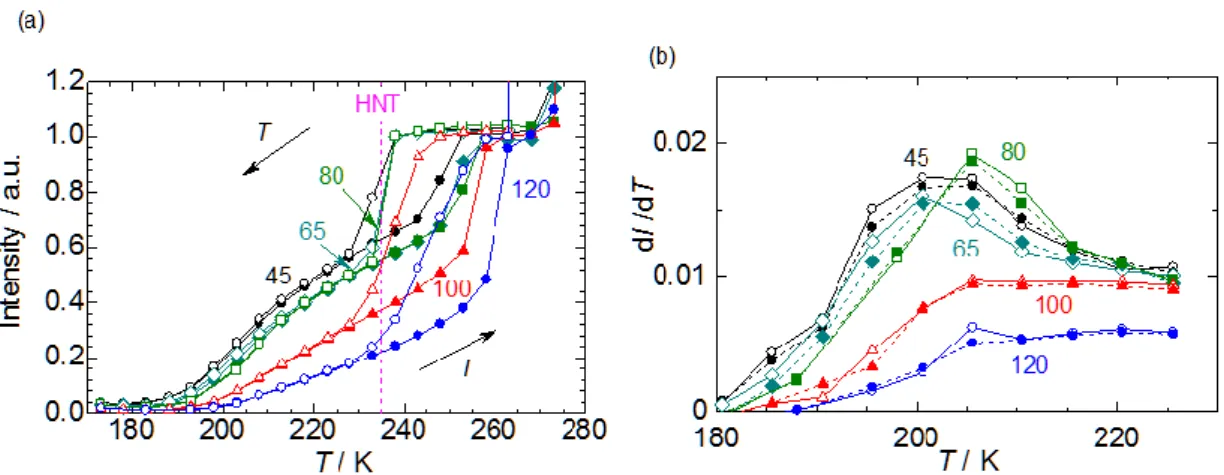
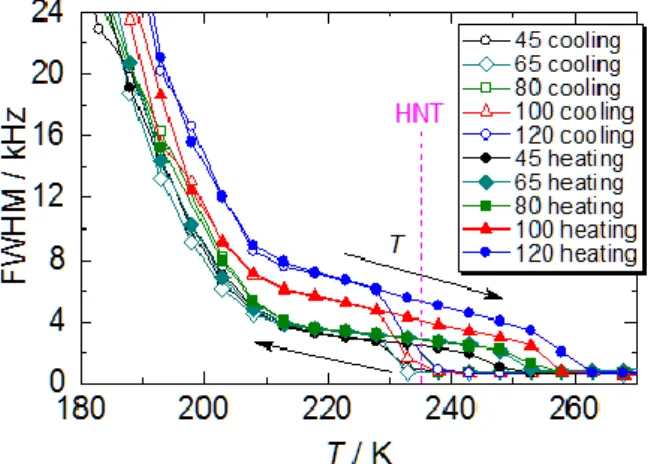
Thermodynamic and dynamic properties of water confined in mesoporous silica glass SBA-16 were investigated by DSC, 1,2H NMR spectrum and 2H NMR spin-lattice relaxation time (T1) as a function of pore size. SBA-16 possesses the main spherical pores, interconnecting channels and micropores (corona). Water in the characteristic spherical pores of SBA-16 freezes at the homogeneous nucleation temperature of water. Between room and freezing temperature, the correlation time of the isotropic rotation of water in the pores of SBA-16 followed the Vogel-Fulcher-Tammann (VFT) relation, which reflects the formation and growth of clusters of fragile water for changing to the strong water. The vitrification of water in micropores around 200 K was observed by 2H NMR. Above 200 K, the correlation time of the rotation of water in micropores exhibited non-Arrhenius behavior, which is correlated with the gradual decrease in the mobility of water due to the growth of hydrogen bonding, forming low density water before vitrification. After vitrification, the activation energy of the rotation of water in micropores was 25~33 kJmol-1, which was similar to that in ice Ih for all samples. The freedom of cluster formation and water rotation increased with increasing pore size.
1. DSC analysis of phase changes of water confined in SBA-16
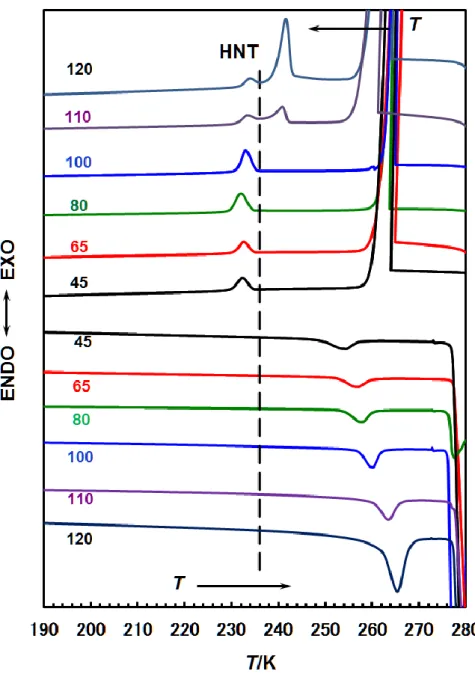
Figure 4-1 shows the DSC curves of D2O confined in SBA-16(45) through SBA- 16(120). On cooling, the first exothermic peak appeared at around 262 K in all the samples, but varied from sample to sample. This is ascribed to the freezing of external liquid D2O. In samples SBA-16(45) through SBA-16(100), a second exothermic peak appeared at 235 K almost independently of the sample or pore size. This is due to the freezing of pore water [13]. In SBA-16(110) and SBA-16(120), freezing of pore water occurred continuously after freezing of external water showing large peaks at 245 K and 240 K, respectively. These peaks can be ascribed to the freezing of water in the pores interconnecting the spherical pores. Small but clear exothermic peaks were seen at 235 K as found in SBA-16(45) through SBA-16(100). Frozen pore D2O melts at fairly higher temperatures than freezing temperature, and the melting temperature increases as pore size increases; i.e., according to the effect of interfacial energy at the spherical pore surface as suggested by the GT relation. Finally, external D2O ice melts at 277 K, which is the melting point of D2O ice. A deconvolution study of peaks using the Gaussian function was conducted but no reasonable explanation could be extracted. However, it is reasonable to assume from the occurrence of a single Gaussian peak that freezing is due to one kind of homogeneous nucleation crystallization of water in the spherical pores.
18
2. NMR spectrum of SBA-16 pore water
In Figure 4-2 (a) and (b), the 2H NMR spectra of D2O confined in SBA-16(80) and SBA-16(120) are shown as a function of decreasing and increasing temperatures between 253 and 173 K; the spectra for other SBA-16 samples are given in Figure 4-3 (a)-(c).
When temperature decreased, a sharp peak observed at 253 K incorporated an additional wide component, which is characteristic of the quadrupole interaction in the solid phase
Figure 4-1 DSC curves of D2O fully confined in SBA-16(45) through SBA-16(120).
Numbers near the curves show the temperatures (C) at which the samples were prepared hydrothermally. Scanning speed for increasing and decreasing temperature is 5 Kmin-1. HNT is the homogeneous nucleation temperature of D2O ice estimated here.
19
because the nuclear spin of deuterium is 1. This peak grew as temperature decreased and the intensity of the sharp peak decreased. This marked change corresponds with the freezing of liquid D2O confined in the spherical pores of SBA-16, as shown by DSC analysis (Figure 4-1). Heating the samples after cooling down to 173 K caused a reduction in the wide component of 2H NMR spectrum, which remained until 233 K but disappeared at 253 K, instead causing a sharp peak to grow. This change corresponds to the melting of frozen pore D2O. In fact, the change in peak intensity with temperature varied as the hydrothermal treatment temperature of the sample changed.
(a)
(b)
SBA-16(80) SBA-16(80)
SBA-16(120) SBA-16(120)
-300 -200 -100 0 100 200 300
Frequency / kHz Cooling
253 K
233 K
213 K
193 K
173 K
10
5
-300 -200 -100 0 100 200 300
Frequency / kHz Heating
253 K
233 K
213 K
193 K
173 K
10
5
-300 -200 -100 0 100 200 300
Frequency / kHz Cooling
253 K
233 K
213 K
193 K
173 K
10
-300 -200 -100 0 100 200 300
Frequency / kHz Heating
253 K
233 K
213 K
193 K
173 K
10
Figure 4-2 2H NMR spectra of D2O confined in (a) SBA-16(80) and (b) SBA-16(120) determined at decreasing and increasing temperatures. Spectra for other porous systems are given in Figure 4-3. Numbers near the curves are magnifications.
20
Figure 4-3 2H NMR spectra of D2O confined in (a) SBA-16(45), (b) SBA-16(65), and (c) SBA-16(100).
![Figure 2-1 Synthetic process of SBA-16 according to ref. [13]. Sample names are as follows: SBA-16(t), where t is the temperature ( ℃ ) for the preparation of hydrothermal treatments](https://thumb-ap.123doks.com/thumbv2/123deta/5640280.2003300/14.892.176.703.180.715/figure-synthetic-process-according-temperature-preparation-hydrothermal-treatments.webp)