I.Introduction
Over the 30 years reform since opening up its trade borders, Chinaʼs foreign trade has been continuously expanding, thus improving its position and influence in the global trade market, time after time. On April 18, 2010, the Chinese Ministry of Commerce held a semi- nar on transforming the development mode for foreign trade at Canton Fair, where it re- leased the “Research on the strategy of Chinese foreign trade development in the post- crisis era.” As a target, this paper proposed that Chinaʼs aim was to become a world trade power by 2030. Since this goal has been placed on the agenda, it is necessary to explore further how to achieve this aim within the allotted time frame. In 2012, China, for the first time, surpassed the United States as the worldʼs largest trading nation, a title the United States had been holding for more than sixty years. This accomplishment delineated China as a veritable large trading country. However, due to the lack of capital and technology as well as its closer dependence on foreign investments, Chinaʼs trading commodities fall short of international competitiveness, which means China is still far from being recog- nized as a trade power. Domestic and international scholars have expended considerable effort and time to identify ways to speed up the process of becoming a world trade power and to identify a possible path to this end.
With regard to the definition of a trade power, Dicks and Murphy (2003) convinced that
Ganshu Zheng* Hongbo Cai**
Caiyu Luo***
A New Approach for China to Become a Trade Power:
An Empirical Study on International Competitiveness Based on the National Trade Niche
I. Introduction
II. The National Trade Niche III. Index and Method Selection IV. Empirical Analysis and Results V. Path Analysis and Suggestions VI. Conclusions
to be recognized as a trade power, a country must have (1) a significant amount of foreign trade; (2) a long-lasting, stable economic growth driving mechanism; (3) an advantage in brand development; and (4) a strong initiative in interest distribution. Chen (2004) stated that the basic characteristic of a trade power are such that (1) the export products should mainly be high-value added products; (2) the trade country should be at the higher end of the value chain; (3) the domestic enterprises should have the ability to resist risk and to respond quickly to changes in the external market environment; and (4) the exportprod- ucts should have high brand images. At present, the criteria of a trade power mainly in- cludes the value of trade, the index of trade competitiveness, the market share, the status of international division, the commodity structure of foreign trade and brand competitive- ness. etc. The author contends that the existing criteria places a particular emphasis on the economic aspects, thereby making it difficult to measure the competitiveness of a coun- tryʼs overall foreign trade.
To become a trade power, Sheng (2011) posited that the development of foreign trade in China should be transformed into a mode of internal and external coordination where there is a balance between imports and exports and an environment that promotes sus- tainable friendly development. This will, in turn, lead to new features in the development of Chinese foreign trade. Yang (2011) put forward the win-win open strategy, the five new strategies for harmony, the strategy of rejuvenating trade through science and technology and the Atlantic and Pacific Ocean strategy, which were part of the achievements from Marxʼs theory of international trade in China. Huang (2012) noted that the integration of domestic and foreign trade is the cornerstone for transforming from a trading nation to a trade power. The author contends that most of the existing literatures are concerned with the static theoretical analysis, rather than with the dynamic analysis with respect to the time variable.
In fact, it is necessary to expand the existing trade power index to include more influenc- ing factors if we want a comprehensive measure of the competitiveness of national foreign trade. Meanwhile, we should include the time variable in the empirical analysis to conduct a dynamic analysis of Chinaʼs foreign trade development. This paper proposes the concept of the national trade niche based on the theory of the ecology niche and calculates the niche value, the niche breadth value and the niche overlap value. In this way, this study analyzes the gaps in status, resource utilization efficiency and competitive relationships between China and the other traditional trade powers. In the end, according to the niche dynamic theory, a possible path for China is proposed as it strives to become a trade pow- er.
II.The National Trade Niche
The theory of the ecology niche is widely applied in ecology as an tremendous tool to ex-
plain species diversity, species competition, community structure and function, as well as the succession and the evolution of population. Since the 1970s, the theory of the ecology niche has been gradually penetrating in the field of economic management and has been applied to many fields such as urban planning, agricultural production, economic analysis and enterprise management. etc. However, with respect to the definition of “niche”, there is still an inconclusive in academia scholars. This paper adopts the concept of a functional niche, namely refers to the status and role of species in a biological community. Measuring the ecological niche mainly includes three aspects. The first is the overall evaluation of the whole ecological niche, which measures the status and function of ecological species in an ecosystem. The second is the evaluation of the niche breadth, which also measures the eco- logical population and the viability or capability of resource utilization. The third is the evaluation of the niche overlap, which is used to measures the competitive and survival re- lationships among the species.
1. The Rationality of the National Trade Niche Theory
The ecosystem and the international trade system both represent the interaction of life or lifelike forms an external environment. First, people involved in the enterprise to be- come the kind of lifelike forms. At this point, a foreign trade enterprise corresponds to an individual organism such that it is seeking optimal resources and its positions itself in the environment. Second, those same individual organisms that work in coordination in the same space can constitute one population. Similarly, foreign trade enterprises of similar structure in a country are able to enjoy shared resources and mutual support. At this point, the foreign trade of a country and a single population should be relatively. Just as different populations forma community, accordingly countries trading with each other in the same market constitute the sum of global trade. Corresponding to the community glob- al trade. Finally, when considering global trade together with the influence of global poli- tics, economy, society and culture and other parties, the trade system corresponds to the ecosystem.
Thereby, as there are corresponding relationships among the basic structures of ecology and international trade, it is reasonable to describe the status and interrelation of differ- ent countries in global trade using the theory of the ecology niche certainly.
2. The Meaning of the National Trade Niche
Based on the definition of niche in ecology, we can examine the national trade niche from both macro and micro aspects.
On a macro level, trade development is influenced by a variety of resource factors. As ev- ery factor has its suitable threshold, on the condition of the resource profile determined by any point within the limits of that threshold, a countryʼs trade could exhibit sustainable development. In the eco-space of global trade, each country hopes to obtain the best re-
sources, but it only has the ability to access to certain resources over a certain period of time. Therefore, a country can occupy only a part of the eco-space, which is known as its national trade niche. From a micro perspective, the national trade niche refers to the func- tion and status formed by trade interactions between countries, and the state of the inter- action between the national trade and market environments. In this respect, each country claims its own national trade niche in foreign trade.
3. The Calculation of the National Trade Niche (1) The National Trade Niche
According to the niche eco-state and eco-role theory by Zhu (1997), the national trade niche consists of two parts. The eco-state refers to the state of a countryʼs trade develop- ment, such as the capability of economic development and the development level of science and technology. The eco-role refers to the influence of a countryʼs foreign trade, such as the growth rate of trade and the speed of development. Both parts reflect the relative status and function of a country with respect to global trade.
We define Si as the eco-state of country i, Pi as the eco-role of country i, A as the dimen- sion conversion coefficient. The computational formula of the ecological niche proposed by Zhu (1997) is also applied to the calculation of national trade niche. The formula is as fol- lows:
(1)
Among them i, j = 1, 2, ..., n; Ni represents the national trade niche of country I; Si rep- resents the ecostate of country I; Sj represents the ecostate of country j; Pi represents the ecorole of country I; Pj represents the ecorole of country j; Ai and Aj and represent the di-
Ni=
∑j=1 n
(Sj+AjPj) Si+AiPi
Time
The ecorole of niche The ecostate of niche
S
P
Note: It is sorted by the author, according to Zhu (₁₉₉₇).
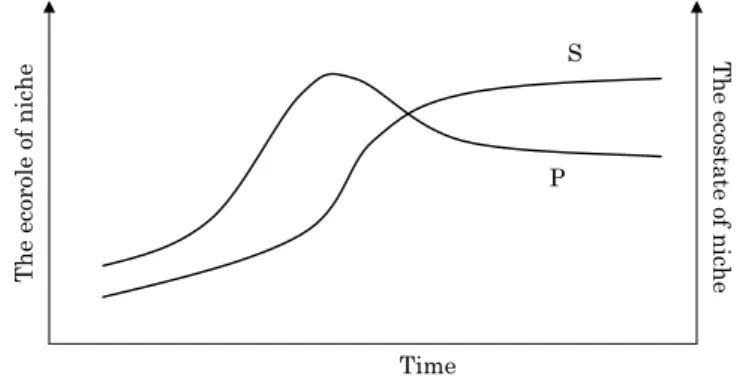
Figure 1 The change of eco-state and eco-role in the national trade niche
mension conversion coefficients.
According to the niche eco-state and eco-role theory, the eco-state of the national trade niche, varying as time goes by, typically showed an “S” shape, and the eco-role is shaped as some type of “normal curve”. As below revealed.
The commonly used s-shaped curve is expressed as:
(2) Where N represents the total number of resources the country actually used, t rep- resents time, K represents the saturation capacity of global market in the country trade can achieve under certain conditions and r represents the individual growth rate of each country. R value and K value are relatively stable under certain conditions. Therefore, the eco-state of a specific country restricts its eco-role, which means that the eco-state is the foundation of the eco-role. On the contrary, the eco-role of a specific country promotes the conversion of its eco-state, that is, the change from one state to another.
The computational formula of a niche as proposed by Zhu (1997), however, involves only one metric when, in fact, the influencing factor of the niche includes many metrics. There- fore, this formula has been constantly improved through follow-up development by bring- ing in more metrics to establish a quantitative model of evaluation, thereby making the calculations results more accurately reflect the actual situation.
The general premise behind a quantitative evaluation of the national trade niche in most literatures is outlined as follows. First, it is necessary to choose reasonable evalua- tion indexes, as well as develop a scientific distribution of weight and construct a summa- tion model. Second, data for each index must be collected and incorporated into the sum- mation model after standardized processing. At this point, the value of the national trade niche is calculated. The basic model of a quantitative evaluation is as follows:
HNI=∑i=1
n(∑j=1m PijWij)Wi (3)
where HNI is the value of the national trade niche, n represents the number of modules, m represents the number of indicators in module i, Pij represents the standardized value of indicator j in module i, Wij is the weight of indicator j in module i, and Wi is the weight of module i.
In the global market the greater the value of the national trade niche has, the more ob- vious the advantage of a countryʼs trade will exist. Which is reflected not only the scale of trade but also in the capability of resource utilization and future development.
(2) The Breadth of the National Trade Niche
According to the definition of niche breadth in ecology, the breadth of the national trade niche refers to the total number of a countryʼs trade resources, that is, the degree of diver- sification of adaptation to the market environment. The paper calculates the value of the
= - dNdt r
K N NK
( )
breadth of the national trade niche with reference to the formula proposed by Levin (1968). Suppose there are S number of countries and R types of resources. We have a matrix re- flecting the utilization of resources with countries as rows and resources as columns:
Where Nij is the number of resource j utilized by country i, Yi is the number of resources utilized by country i, Xj is the number of j utilized by all countries and Z is the total num- ber of resources of all countries.
On the basis of the Levinʼs formula, the breadth values of the national trade niche could be expressed by the following two indexes below:
Simpson index:
(4)
Shannon Wiener index:
(5) In formulas (4) and (5), Bi and B́i represent the breadth of the national trade niche, Nij is the number of resource j utilized by country i, Yi is the total number of resources of country i, Pij = Nij / Yi is the percentage of resource j utilized by country i, and R is the total number of resources.
As, which means. The equality holds if and only if. andwill reach their maximum value when the number of each resource utilized by country i is equal without considering the difference in resource utilization. This indicates that a country will have the widest niche only when all resources are utilized indiscriminately. When the countryʼs different re- source utilization ratio of gap is larger, the Bi and B́i value is smaller, and thus, the breadth of the national trade niche will be narrower; otherwise it will be wider.
Similar to the biological niche breadth, the breadth of the national trade niche is the sum of all types of resources a country takes advantage for its trade. In other words, it is the diversification level adaptable to the market environment. A narrow niche means there is a significantly large difference in resource utilization, thus indicating a trend of specialization in the countryʼs trade with high utilization efficiency of certain resources. A wide niche reflects equalization in resource utilization, thus showing a trend of diversifica- tion or universalization in the countryʼs trade with a similar degree of resource utilization.
In other words, the principle of the traditional comparative advantage theory applies here as well. They both have different approaches but equally satisfactory results.
(3) The Overlap of the National Trade Niche
The overlap of the national trade niche refers to the degree of similarity between/among the national trade niches of two or more countries, thus reflecting similar degrees of re-
Bi= =
∑j=1 R
Nij2 i
Y2
∑j=1 R
Pij2
1
Bi= ∑
j=1 R
PijlogPij
´ -
source utilization, including not only the utilization of the same type of natural resources but also including market space, time and competitiveness of course. This document refers to the biological niche overlap values formula (symmetric α method), which proposed by Pianka (1973,1975), calculates the overlap value of the national trade niche.
It is computed as follows:
(6)
Where aij represents the value of the niche overlap of country i and j, and Pia and Pja are the percentages of utilization of resource a in country i and j, respectively, and R is the number of total available resources.
If the trade of different countries has the same kind of technology trade, import and ex- port of similar products or similar target consuming groups, then these two national trade niches can occur inevitably overlaps. In other words, there is trade competition between the two countries. National trade greater niche overlap values, more intense competition.
III.Index and Method Selection
Trade development of a country is based on resources, including environmental resourc- es, economic and social resources, which together constitute a multidimensional resource space. Different resource spaces result in different development approach of a countryʼs trade, which, in turn, results in different national trade niches. The author contends that these resource factors that have effects on trade activities can be divided into three class- es. The first are the environmental resources, mainly including electric power, energy and carbon dioxide emissions volume, and other indicator. The second are the economic re- sources, including per capita GDP, per capita disposable income, trade exports and high- tech products exports, etc. The third are the social resources, including employment rates, social systems and scientific and technological levels and so on. Correspondingly, the na- tional trade niche can be subdivided into three modules: the environmental niche, the eco- nomic niche and the social niche.
1. Index Selection
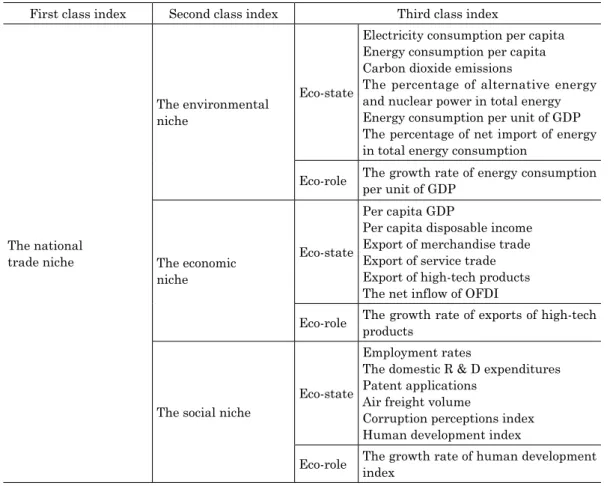
Drawing on previous literatures regarding the trade development and niche evaluation index system, combined with the maneuverability and the accessibility of date, this paper built up an evaluation index system of the national trade niche (Table 1). Three categories with 21 indicator data from 2001 to 2014 are selected to measure the national trade niche of traditional trade powers. These include the United States, Britain, Germany, Japan and
αij=∑
a=1 R
a=1∑
R
PiaPja
Pia
( )
2
China.
2. Method Selection
With regard to the comprehensive evaluation of the national trade niche, both fuzzy evaluation method and principal component analysis can be adopted. However, the subjec- tive distribution of weights of the fuzzy evaluation method would be easily affected by the subjective factor of evaluators, thus leading to an inaccurate reflection of the real situation of the national trade niche. Based on the studies of the interrelation of each variable, the principal components analysis retains more information of original variables by replacing it with new variables, instead of using less original variables. Furthermore, the principal components analysis gives weight to the variables through statistical software, which in- creasing the objectivity of the evaluation. This paper adopts the principal components analysis method to analyze the national trade niche by main means of SPSS software.
Table 1 The evaluation index system of the national trade niche First class index Second class index Third class index
The national trade niche
The environmental niche
Eco-state
Electricity consumption per capita Energy consumption per capita Carbon dioxide emissions
The percentage of alternative energy and nuclear power in total energy Energy consumption per unit of GDP The percentage of net import of energy in total energy consumption
Eco-role The growth rate of energy consumption per unit of GDP
The economic niche
Eco-state
Per capita GDP
Per capita disposable income Export of merchandise trade Export of service trade Export of high-tech products The net inflow of OFDI
Eco-role The growth rate of exports of high-tech products
The social niche
Eco-state
Employment rates
The domestic R & D expenditures Patent applications
Air freight volume
Corruption perceptions index Human development index
Eco-role The growth rate of human development index Note: It is sorted out by the author, according to Chen (₂₀₀₄).
IV.Empirical Analysis and Results 1. The Value of the National Trade Niche
According to the index evaluation system of the national trade niche (Table 1), the weight of each indicator is obtained by principal components analysis, the data of the five coun- tries are incorporated into the formula, and each countryʼs national trade niche value is thus determined (Table 2).
The evaluation of the national trade niche reflects the gap in the different national trade niches and it also ranks each country according to the identified criteria. From the vari- ance contribution rate obtained from the principal components analysis, we know that there are three principal components that affect the value of the national trade niche.
With respect to the first principal component, as a large proportion of the weight is on elec- tricity consumption per capita, energy consumption per capita, per capita GDP, per capita disposable income, corruption perception index and human development index, this com- ponent is defined as the development state factor. Because in the second principal compo- nent a large proportion of the weight is on carbon dioxide emissions and consumption units of GDP, this component is defined as the resource environmental factor. Each energy products can be defined as the science and technology factors because a large proportion of the weight is on patent applications and domestic R & D expenditures.
Table 2 The national trade niche value of each country from ₂₀₀₁ to ₂₀₁₄
₂₀₀₁ ₂₀₀₂ ₂₀₀₃ ₂₀₀₄ ₂₀₀₅ ₂₀₀₆ ₂₀₀₇ ₂₀₀₈ ₂₀₀₉ ₂₀₁₀ ₂₀₁₁ ₂₀₁₂ ₂₀₁₃ ₂₀₁₄ USA ₃.₀₂₂₃ ₂.₉₅₀ ₂.₄₈₃ ₂.₂₈₆ ₂.₃₆₇ ₁.₈₉₁ ₂.₀₉₀ ₂.₀₆₇ ₂.₈₁₆ ₂.₉₂₆ ₂.₈₃₅ ₂.₆₇₇ ₂.₅₂₃ ₂.₆₁₂ Britain -₀.₃₆₄ -₀.₈₁₉ -₀.₇₂₀ -₀.₃₉₅ ₀.₀₇₈ ₀.₄₀₉ ₀.₂₉₀ -₀.₄₄₉ -₀.₈₂₅ -₀.₇₇₅ -₀.₅₅₂ -₀.₄₃₆ -₀.₆₁₄ -₀.₅₆₄
Germany -₀.₄₃₂ -₀.₀₁₃ ₀.₁₄₇ ₀.₂₆₇ -₀.₀₂₆ ₀.₂₃₀ ₀.₀₀₄ ₀.₂₈₃ -₀.₀₅₄ -₀.₀₂₄ -₀.₀₃₆ -₀.₀₂₂ -₀.₁₈₉ -₀.₁₃₆
Japan ₀.₀₈₂ -₀.₁₇₀ ₀.₄₈₄ ₀.₄₁₂ ₀.₁₂₆ ₀.₀₁₈ ₀.₁₇₃ ₀.₇₁₉ ₀.₃₉₆ ₀.₃₁₂ ₀.₂₄₅ ₀.₂₃₆ ₀.₁₄₈ ₀.₁₆₇
China -₂.₃₀₉ -₁.₉₄₈ -₂.₃₉₄ -₂.₅₇₀ -₂.₅₄₄ -₂.₅₄₈ -₂.₅₅₇ -₂.₆₂₀ -₂.₃₃₃ -₂.₄₉₆ -₂.₃₇₈ -₂.₂₉₂ -₂.₄₁₁ -₂.₂₄₅ Note: Calculations by the author.
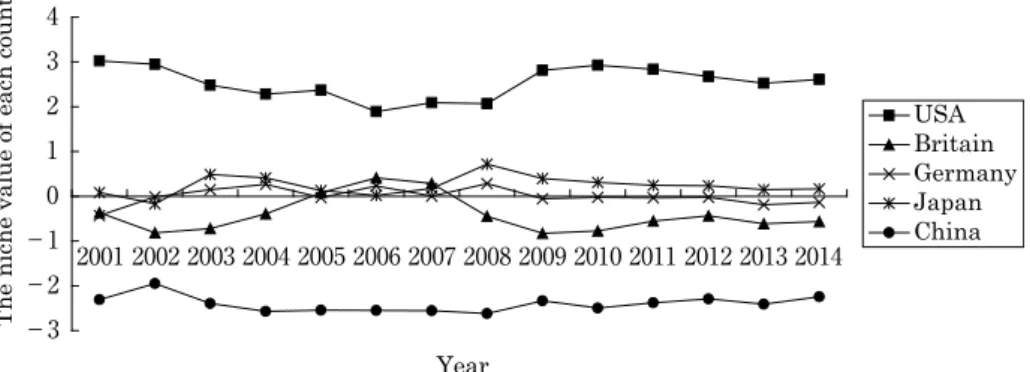
As shown in Table 2, the value of most of the national trade niche between 3 and -3. The niche values of Britain, Germany and Japan are more concentrated in niche around zero and are very relatively close to each other, indicating that the similar status of these three coun- tries with respect to development level and almost occupied stable trade power position. The trade niche of the United States is always in a dominant position, ranking first for all years.
Compared with the traditional trade powers, the trade niche of China is in a weak position reflecting small changes in niche value and remaining at a consistently low level, which ac- counts for the large gap between China and the trade powers. This result indicates that Chi- na still has a long way to go before it can be declared a trade power. Accordingly, the status of China in global trade should be improved.
From Figure 2, we note Japan in 2002, after the implementation of new economic growth strategy, niche there is a considerably increase in the value of national trade. However, under the impact of the financial crisis in2008, Japanʼs exports fell sharply, value of niche trade began to decline as well. The trend for Germanyʼs trade niche is similar to that of Ja- pan. After recovering from a decade of economic recession in 2001, Germanyʼs trade niche maintains steady growth. The opportunity of global economic recovery in 2003 promoted Britainʼs trade niche to increase as well. But in 2006, Britainʼs trade was severely damaged and the deficit in merchandise trade continued to increase because of the turmoil in the fi- nancial market and the slowing economic growth among developed countries. As the finan- cial crisis of 2008 worsened the situation, Britainʼs trade niche continued to decline. United States since 2001, ending a decade-long economic boom, the growth rate of Americaʼs econ- omy has slowed sharply, and the trade niche has continued to decline. Until 2014, recovery indications, closely related to the reform of the new deal with Obama, while Chinaʼs trade niche remains stable, changes are unlikely. Foreign market expansion and the interna- tionalization of trade rules caused by Chinaʼs entry into WTO, which resulted in a sharp increase in the trade niche that peaked in 2002. Moreover, since 2009 the significant in- crease over the value of niche trade in China. This increase embodies the remarkable re- sults of both Chinaʼs positive response to the financial crisis and the policies established to stimulate the economy, stabilize external demands and expand domestic demands.
As Table 3 indicates, Chinaʼs environmental, economic and social niches are all at a low level, in particular and there is a huge gap between China and the trade powers when con- sidering the environmental niche, which always remains in the lowest position. This is di- rectly related to Chinaʼs long-term extensive energy utilization, low energy efficiency and lack of environmental awareness. Chinaʼs economic niche, on the other hand, is similar to that of the trade powers, especially in the 2008 against the trend, and the highest value.
These results are due to Chinaʼs positive response to the financial crisis. The gap in the so- cial niche between China and the trade powers, which is also evident, is related to Chinaʼs
-3
-2
-1 0 1 2 3 4
2014
Year
The niche value of each country
USABritain Germany Japan China 2001 2002 2003 2004 2005 2006 2007 2008 2009 2010 2011 2012 2013
Note: Drawn by the author based on data recorded in Table ₂.
Figure 2 The change in the trade niche of each country from ₂₀₀₁ to ₂₀₁₄
limited progress in science and technology, its inadequate infrastructures and its ineffi- cient technology commercialization.
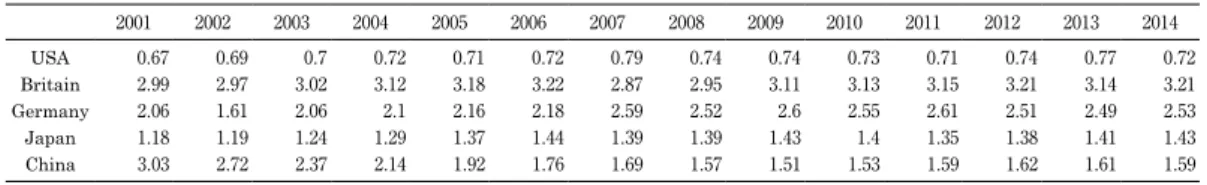
2. The Breadth Value of the National Trade Niche
The trade niche breadth value of each country indicates the survival and development of the country with respect to global competition, that is, the ability to utilize different re- sources factors. The lower the breadth value, the narrower the trade breadth, which means a higher utilization efficiency of some resource factors and a stronger core competence, and vice versa.
Since some of the original data in the index system cannot directly represent the re- source utilization capability, and its shares in the world have no practical significance.
Therefore, we adopt the remaining indicators to analyze the niche breadth after eliminat- ing the human development index, worldʼs corruption perception index, the employment rate, net inflow of OFDI, percentage of net import of energy in total energy consumption, alternative energy and nuclear power accounted for the proportion of total energy and growth indicators. Based on Levinʼs niche breadth formula, we calculate the trade niche breadth value of each country from 2001 to 2014.
Analyses may result in by Table 4, the value of Chinaʼs trade niche breadth declines yearly, which means the niche breadth is narrowing year by year. In other words, the utili- zation efficiency of different resources tend to be differentiated, and as a result, the gap will gradually increase, resulting in an improvement in the utilization efficiency of some resources. The author holds that the business model of Chinese enterprises was, at one time, to indiscriminately use different resources, which, to a large extent, was unavoidable due to low economic development level. In recent years, however, Chinese companies have committed themselves to turning “Made in China” to “Created in China”. In addition, they have actively improved their core competence and the utilization efficiency of resources.
Table 3 The trade niche decomposing for each country from ₂₀₀₁ to ₂₀₁₄
₂₀₀₁ ₂₀₀₂ ₂₀₀₃ ₂₀₀₄ ₂₀₀₅ ₂₀₀₆ ₂₀₀₇ ₂₀₀₈ ₂₀₀₉ ₂₀₁₀ ₂₀₁₁ ₂₀₁₂ ₂₀₁₃ ₂₀₁₄
The environmental
niche
USA -₀.₁₃₄ ₀.₁₄₆ ₁.₁₉₂ ₁.₀₆₁ ₁.₄₄₆ ₀.₅₉₃ -₀.₂₅₃ ₀.₇₄₄ ₁.₀₀₃ ₁.₁₂₅ ₁.₂₂₂ ₁.₄₃₃ ₀.₆₂ ₁.₁₁₃ Britain ₀.₀₇₇ ₀.₂₁₉ -₀.₃₁₅ -₀.₂₁₉ -₀.₀₃₇ -₀.₃₉₁ ₀.₂₈₉ -₀.₇₂₄ -₀.₅₄₁ -₀.₄₂₂ -₀.₃₉₇ -₀.₂₈₅ -₀.₂₉₁ ₀.₂₀₁
Germany ₁.₃₈ ₀.₅₉₅ ₀.₁₁ ₀.₃₇₁ ₀.₀₆ ₀.₄₈₉ ₀.₇₅₄ ₀.₃₀₉ ₀.₄₁₂ ₀.₅₁₁ ₀.₆₀₁ ₀.₄₉₁ ₀.₄₂₂ ₀.₃₉₉
Japan ₁.₄₁₆ ₀.₈₆₁ ₀.₈₀₅ ₀.₆₆ ₀.₂₆₄ ₁.₁₁₃ ₁.₀₂₂ ₁.₀₈₃ ₁.₀₆ ₁.₁₁₆ ₀.₉₉₈ ₀.₆₈₁ ₀.₈₇₉ ₁.₀₁₂
China -₂.₇₃₉ -₁.₈₂₁ -₁.₇₉₂ -₁.₈₇₄ -₁.₇₃₃ -₁.₈₀₅ -₁.₈₁₃ -₁.₄₁₂ -₁.₉₃₄ -₁.₈₉₇ -₁.₈₃₃ -₁.₇₄₄ -₁.₈₀₉ -₁.₇₂₂
The economic niche
USA ₂.₆₀₆ ₁.₈₈ ₁.₇₅₈ ₁.₅₅₃ ₀.₇₇₂ ₁.₃₅₉ ₀.₉₄₉ ₀.₂₂₈ ₁.₇₄₂ ₁.₈₂ ₁.₆₆₅ ₁.₇₁₆ ₁.₅₅₄ ₁.₅₆₁ Britain -₀.₄₄₅ -₀.₈₂₉ -₀.₇₅₃ -₀.₀₁₈ ₀.₉₁₈ ₀.₀₆₁ ₁.₁₂₉ -₁.₃₄₆ -₀.₀₅₉ -₀.₀₅₁ -₀.₀₇₂ -₀.₀₈₂ -₀.₀₅₇ -₀.₀₄₉ Germany ₀.₂₀₁ ₀.₇₁₄ ₀.₂₈ ₀.₁₂₂ -₀.₁₄₄ ₀.₁₇₁ ₀.₀₉₅ -₀.₂₆₆ ₀.₀₀₆ ₀.₁₅₁ ₀.₁₇₇ ₀.₁₆₇ ₀.₀₀₉ ₀.₀₈₇ Japan -₀.₀₈₆ -₀.₅₅₆ -₀.₃₅₆ -₀.₁₁₁ -₀.₀₈₃ -₀.₃₃₃ -₀.₂₃₄ -₀.₇₇₁ -₀.₂₀₇ -₀.₃₁₃ -₀.₂₅₅ -₀.₃₃₅ -₀.₅₇₆ -₀.₅₂₅ China -₁.₈₇₃ -₁.₂₀₉ -₀.₉₂₉ -₁.₅₄₅ -₁.₄₆₂ -₁.₂₅₈ -₁.₉₃₉ ₂.₁₅₅ -₁.₄₈₃ -₁.₃₆₅ -₁.₂₅₅ -₁.₄₆₄ -₁.₄₃₄ -₁.₄₅₅
The social niche
USA ₁.₃₃₇ ₁.₄₅₉ ₁.₃₂₈ ₁.₃₁₄ ₁.₅₅₈ ₁.₄₇₆ ₁.₅ ₁.₅₇₂ ₁.₉₀₃ ₁.₅₅₅ ₁.₄₂₁ ₁.₃₈₈ ₁.₄₅₃ ₁.₅₂₁ Britain -₀.₀₆₂ -₀.₂₇ -₀.₁₆₇ -₀.₂₁₆ -₀.₄₇₂ -₀.₅₃₇ -₀.₅₁₅ -₀.₇₈₄ -₀.₅₈ -₀.₅₃₁ -₀.₆₄₅ -₀.₄₉₉ -₀.₅₁₅ -₀.₅₅₉ Germany-₀.₄₆₄ -₀.₁₁₉ -₀.₂₆₄ -₀.₂₀₅ -₀.₄₃₂ -₀.₄₅ -₀.₅₈₉ -₀.₂₁₉ -₀.₃₂₅ -₀.₅₂ -₀.₄₉₃ -₀.₃₉₉ -₀.₄₁₄ -₀.₃₅₄
Japan ₀.₅₂₇ ₀.₆₃₉ ₀.₅₉₁ ₀.₅₄₆ ₀.₅₈₉ ₀.₆₅₈ ₀.₆₇₆ ₀.₆₁₁ ₀.₂₉₇ ₀.₃₄₃ ₀.₂₉₉ ₀.₅₆₄ ₀.₅₃₅ ₀.₆₂₂
China -₁.₃₃₈ -₁.₇₀₈ -₁.₄₈₈ -₁.₄₃₉ -₁.₂₄₃ -₁.₁₄₈ -₁.₀₇₂ -₁.₁₈ -₁.₂₉₅ -₁.₁₉₈ -₁.₁₇₆ -₁.₂₄₃ -₁.₄₇₇ -₁.₄₆₅ Note: Calculations by the author.
Accordingly, this differentiates the utilization efficiency of different resources and leads to an annual decrease in the national trade niche breadth.
Compared with other countries, the United Statesʼ niche breadth value is always sin the lowest position, indicating that the United States has a distinct advantage in the resource utilization capability. For example, the United States has always been the world leader with respect to technological development capability and technology commercialization. In the meantime, the niche breadth value of Germany, Britain and Japan changes little, as does the disparity in the utilization efficiency of different resources.
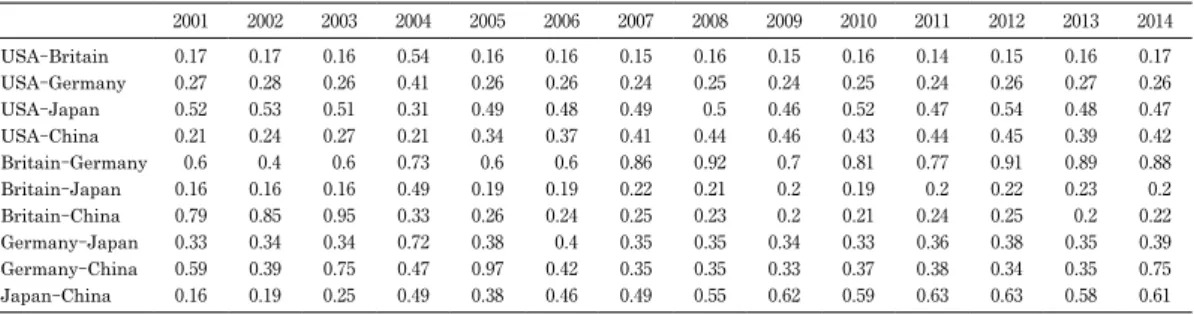
3. The Overlap Value of the National Trade Niche
After eliminating some indicators and placing the remaining indicators into the Pianka formula, we obtain the niche overlap values for each country. If the overlap value is large, the scope and capability of resource utilization is similar and the competitive relation is obvious with fierce competition, and vice versa.
As Table 5 and Figure 4 show, the overlap range between China and traditional trade powers is highly dynamic. For example, the overlap between China and the United States is small but increases continually, as dies the overlap between China and Japan. It is ex-
0 0.5 1 1.5 2 2.5 3 3.5
2014 Year
The niche breadth value of each country
USABritain Germany Japan China
2001 2002 2003 2004 2005 2006 2007 2008 2009 2010 2011 2012 2013
Note: Drawn by the author based on Table ₄.
Figure 3 The change of trade niche breadth for each country from ₂₀₀₁ to ₂₀₁₄ Table 4 The niche breadth value of each country from ₂₀₀₁ to ₂₀₁₄
₂₀₀₁ ₂₀₀₂ ₂₀₀₃ ₂₀₀₄ ₂₀₀₅ ₂₀₀₆ ₂₀₀₇ ₂₀₀₈ ₂₀₀₉ ₂₀₁₀ ₂₀₁₁ ₂₀₁₂ ₂₀₁₃ ₂₀₁₄
USA ₀.₆₇ ₀.₆₉ ₀.₇ ₀.₇₂ ₀.₇₁ ₀.₇₂ ₀.₇₉ ₀.₇₄ ₀.₇₄ ₀.₇₃ ₀.₇₁ ₀.₇₄ ₀.₇₇ ₀.₇₂
Britain ₂.₉₉ ₂.₉₇ ₃.₀₂ ₃.₁₂ ₃.₁₈ ₃.₂₂ ₂.₈₇ ₂.₉₅ ₃.₁₁ ₃.₁₃ ₃.₁₅ ₃.₂₁ ₃.₁₄ ₃.₂₁
Germany ₂.₀₆ ₁.₆₁ ₂.₀₆ ₂.₁ ₂.₁₆ ₂.₁₈ ₂.₅₉ ₂.₅₂ ₂.₆ ₂.₅₅ ₂.₆₁ ₂.₅₁ ₂.₄₉ ₂.₅₃
Japan ₁.₁₈ ₁.₁₉ ₁.₂₄ ₁.₂₉ ₁.₃₇ ₁.₄₄ ₁.₃₉ ₁.₃₉ ₁.₄₃ ₁.₄ ₁.₃₅ ₁.₃₈ ₁.₄₁ ₁.₄₃
China ₃.₀₃ ₂.₇₂ ₂.₃₇ ₂.₁₄ ₁.₉₂ ₁.₇₆ ₁.₆₉ ₁.₅₇ ₁.₅₁ ₁.₅₃ ₁.₅₉ ₁.₆₂ ₁.₆₁ ₁.₅₉
Note: Calculations by the author.
pected that the national trade niche overlap between China and the United States will be- come increasingly larger in the future. Based on the analysis of the national trade niche breadth, the utilization efficiency of some resources in the United States and Japan is high, while the technology in China is steadily improving. As Zhu and Deng (2011) noted, the technology level of Chinese exports began to increase in 2003, finally matching the world average in 2008. This phenomenon is reflected in the trade niche as Chinaʼs trade niche breadth declines year-by-year while the utilization of different resources is differen- tiated. The improvement in the utilization efficiency of some resources, especially the con- tinuous improvement of technology, causing niche on Chinaʼs trade moves, which automat- ically change the niche overlap values of trade between China and the other countries.
Furthermore, the change in Chinaʼs trade niche leads to an increase in the trade niche overlap between China and the United States or Japan. There are two aspects to the rea- son for this increase. On the one hand, according to Wen (2012), the technological structure of manufacturing exports in China transitioned from a low-skill level to a high-skill level.
Table 5 The niche overlap value of each country from ₂₀₀₁ to ₂₀₁₄
₂₀₀₁ ₂₀₀₂ ₂₀₀₃ ₂₀₀₄ ₂₀₀₅ ₂₀₀₆ ₂₀₀₇ ₂₀₀₈ ₂₀₀₉ ₂₀₁₀ ₂₀₁₁ ₂₀₁₂ ₂₀₁₃ ₂₀₁₄
USA-Britain ₀.₁₇ ₀.₁₇ ₀.₁₆ ₀.₅₄ ₀.₁₆ ₀.₁₆ ₀.₁₅ ₀.₁₆ ₀.₁₅ ₀.₁₆ ₀.₁₄ ₀.₁₅ ₀.₁₆ ₀.₁₇
USA-Germany ₀.₂₇ ₀.₂₈ ₀.₂₆ ₀.₄₁ ₀.₂₆ ₀.₂₆ ₀.₂₄ ₀.₂₅ ₀.₂₄ ₀.₂₅ ₀.₂₄ ₀.₂₆ ₀.₂₇ ₀.₂₆
USA-Japan ₀.₅₂ ₀.₅₃ ₀.₅₁ ₀.₃₁ ₀.₄₉ ₀.₄₈ ₀.₄₉ ₀.₅ ₀.₄₆ ₀.₅₂ ₀.₄₇ ₀.₅₄ ₀.₄₈ ₀.₄₇
USA-China ₀.₂₁ ₀.₂₄ ₀.₂₇ ₀.₂₁ ₀.₃₄ ₀.₃₇ ₀.₄₁ ₀.₄₄ ₀.₄₆ ₀.₄₃ ₀.₄₄ ₀.₄₅ ₀.₃₉ ₀.₄₂
Britain-Germany ₀.₆ ₀.₄ ₀.₆ ₀.₇₃ ₀.₆ ₀.₆ ₀.₈₆ ₀.₉₂ ₀.₇ ₀.₈₁ ₀.₇₇ ₀.₉₁ ₀.₈₉ ₀.₈₈
Britain-Japan ₀.₁₆ ₀.₁₆ ₀.₁₆ ₀.₄₉ ₀.₁₉ ₀.₁₉ ₀.₂₂ ₀.₂₁ ₀.₂ ₀.₁₉ ₀.₂ ₀.₂₂ ₀.₂₃ ₀.₂
Britain-China ₀.₇₉ ₀.₈₅ ₀.₉₅ ₀.₃₃ ₀.₂₆ ₀.₂₄ ₀.₂₅ ₀.₂₃ ₀.₂ ₀.₂₁ ₀.₂₄ ₀.₂₅ ₀.₂ ₀.₂₂
Germany-Japan ₀.₃₃ ₀.₃₄ ₀.₃₄ ₀.₇₂ ₀.₃₈ ₀.₄ ₀.₃₅ ₀.₃₅ ₀.₃₄ ₀.₃₃ ₀.₃₆ ₀.₃₈ ₀.₃₅ ₀.₃₉
Germany-China ₀.₅₉ ₀.₃₉ ₀.₇₅ ₀.₄₇ ₀.₉₇ ₀.₄₂ ₀.₃₅ ₀.₃₅ ₀.₃₃ ₀.₃₇ ₀.₃₈ ₀.₃₄ ₀.₃₅ ₀.₇₅
Japan-China ₀.₁₆ ₀.₁₉ ₀.₂₅ ₀.₄₉ ₀.₃₈ ₀.₄₆ ₀.₄₉ ₀.₅₅ ₀.₆₂ ₀.₅₉ ₀.₆₃ ₀.₆₃ ₀.₅₈ ₀.₆₁
Note: Calculations by the author.
Note: Drawn by the author according to Table ₅.
Figure 4 The change in trade niche overlap for each country from ₂₀₀₁ to ₂₀₁₄ 0
0.2 0.4 0.6 0.8 1 1.2
2014 Year
The niche overlap value between China and trade powers
USA-China Britain-China Germany-China Japan-China
20012002 20032004 20052006 20072008 20092010201120122013
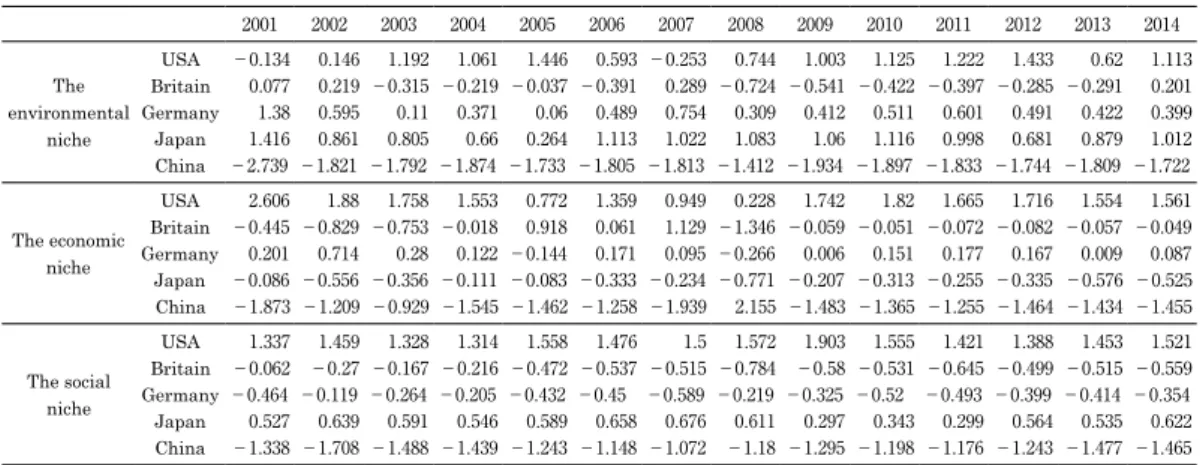
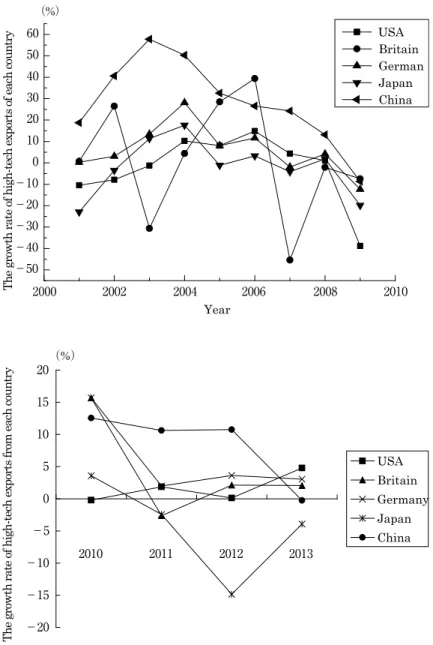
Although the difference in the export technological structure between China and developed countries is large, it is being converged upon rapidly while the trade structure of the Unit- ed States and Japan is experiencing minimal changes. On the other hand, on the basis as shown in Figure 5, the exporting of high-tech products in China has increased rapidly with a significant improvement in technical products to the principal trade partners(USA and Japan), thus reflecting a transformation from labor-intensive products to technology-inten- sive products. While the growth rate of technological products for the United States and
2010
-50
-40
-30
-20
-10 0 10 20 30 40 50 60
The growth rate of high-tech exports of each country
Year
USA Britain German Japan China
2000 2002 2004 2006 2008
(%)
-20
-15
-10
-5 0 5 10 15 20
2013
The growth rate of high-tech exports from each country Year
USA Britain Germany Japan China
2010 2011 2012
(%)
Data sources: The World Bank Statistics database.
Figure 5 The growth rate of high-tech exports from each country
Japan has slowed, technology remains their traditional superior industry. Therefore, the outcome of high-tech products and the structural optimization of imports and exports in China will undoubtedly squeeze the resources and the market that the United States and Japan have originally claimed, thereby resulting in an surely increase in the trade niche overlap.
From the above analysis, we determine that the niche breadth value of Britain and Chi- na is large, thus suggesting a relative balanced use of resources and a less prominent core competition advantage. Overall evaluation value calculation by niche as we can see, the superior resource factors of Britain mainly include energy consumption per unit of GDP, trade of commercial service and corruption perception index, factors that are different from those of China. Thus, as the scope of superior resources between these two countries dif- fers considerably and tends towards professional development, there is tendency toward a decrease in the niche overlap.
In conclusion, a similar trade niche breadth, namely, countries with similar scope and resource utilization ability, has a large niche overlap value. Thus, when the percentage of niche similarity or niche resource factor identity is large, the competition for limited re- sources and mutual space becomes fierce. In general, countries such as the United States and Japan, which have small niche breadth values, tend to have a significantly large range of resources with a strong capability to use those resources, and accordingly, the niche overlap with other countries is large. Therefore, their competitive capacity in the global market is so high that these countries are urged to excavate their capability and scope of resource utilization to acquire the advantage of exploiting the resource factors. On the con- trary, countries such as China, which have large niche breadth values, tend to have a lim- ited ability to use resources and they lack core competences. Once the overlap of superior resource factors becomes significantly large, these countries face fierce competitions that have great effects on the entire countryʼs trade. Therefore, China must upgrade its utiliza- tion efficiency of resource factors and build its own superior resources and core competenc- es, so that the niche breadth and overlap will decrease and the trade level will increase.
V.Path Analysis and Suggestions
The niche of each species in a community is not unchanged, but varies with developing evolution and changes in the external environment, thus forming the niche expansion the- ory, the niche separation theory and the niche symbiosis theory. Correspondingly, in global trade, with changes in the competitive edge, technological level, market environment and policy measure, the national trade niche will also expand, separate, move and other chang- es. As long as the change path and the rule of the national trade niche is correctly identi- fied, we can find a suitable and available path to develop Chinaʼs trade and thereby make rational use of resources, improve the trade niche and, ultimately, become a trade power.
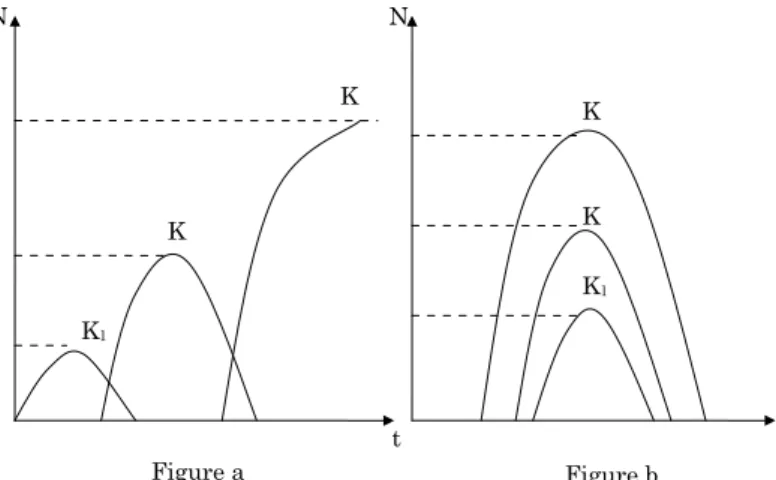
1. The Expansion of the National Trade Niche
In accordance with the growth pattern of species, the growth of the national trade niches atisfies formula (2). Obtaining the first-order differential for formula (2), we have:
(7)
where N is a function of t, and K represents the initial use of resources in a countryʼs trade. From formula (7), we know that to improve the trade level of a country, on the one hand, we can increase the value of K to expand the number of individuals who can be ac- commodated in the environment. This entails improving the scope and capability of re- source utilization, enhancing the utilization efficiency of resources, expanding the trade niche and achieving a dominant position in the competitive market. On the other hand, we can increase the value of r to raise the trade niche value, which means promoting trade de- velopment by technical progress.
The expansion of the national trade niche includes increasing the eco-state or eco-role, namely improving the influence of a country with respect to global trade. The reason for the expansion of the national trade niche is mainly to improve the availability of resources (see Figure 6 a), the use of resources and the level of technology (see Figure 6 b) and so on.
May know by the empirical analysis, the evolution of niche value of China, in compari- son with other countries, remain at a lower position, which means that the national trade niche of China is in dire need of expansion to improve its status in the global trade market.
Based on the niche expansion theory, the following measures can be taken. The first is to increase utilization efficiency by improving the utilization capability of Chinaʼs available resources. The second is to expand the scope of available resources by actively excavating
N=
N0
N K
exp(-rt)
1+
K1
K1
K K
K K
t N N
Figure a Figure b
Note: It is sorted out by the author, according to Zhu (1997).
Figure 6 The expansion pattern under different circumstances
new resources. The third is to improve the technology level and commercialization of re- search findings and achieve a high value-added import and export with high technology content by increasing R & D expenditures. The fourth is to promote the liberalization of in- ternational trade and further expand Chinaʼs trade niche breadth by becoming actively in- volved in the competition.
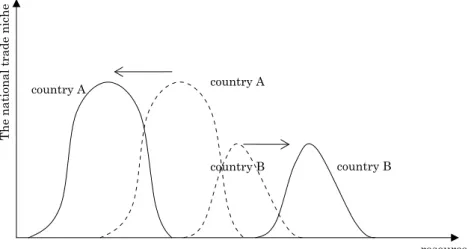
2. The Separation of the National Trade Niche
The separation of the national trade niche means that the disadvantaged countries with- draw from the partial overlapping space, thus eliminating the trade niche overlap. If many countries want to survive and develop together in terms of foreign trade, there is bound to trade niche differentiation.
Note: It is sorted out by the author, according to Wang (₁₉₉₇).
Figure 7 The separation of the national trade niche
resource
The national trade niche
country A country A
country B country B
From Figure 7, it is evident that the scope of the trade niche overlap between country A and country B is large with respect to the primitive condition, which thereby restricts their trade development. After employing the niche separation strategy, the resource scope of the two countries changes and the niche moves, thus resulting in a smaller overlap be- tween country A and country B and reducing the competition. An empirical analysis, the trade niche overlap between China and the United States or Japan is on the rise, which means that our standards of trading would face greater competition in the market. To gain a firm foothold in fierce competition, it is necessary to enhance national trade niche and to expand the niche breadth, while the niche overlap should be reduced to relieve the pres- sure of competition. Therefore, niche separation will result in more market shares and a dominant position.
Niche separation in China can be achieved by specialization or diversification. On one hand, we can make full use of the resource factors, expand the scope of resource utilization
and develop more industries to achieve diversified development. On the other hand, we can focus on building the trade industry, such as the electromechanical industry, and the characteristic industry, such as the textile and the tea industry, to achieve diversified de- velopment, and we can foster those industries with a competitive edge to differentiate the niches and reduce niche overlap.
3. The Symbiosis of the National Trade Niche
When there are inevitable overlaps in the national trade niche between two countries, we employ the national trade niche symbiosis strategy, separate from the niche separation strategy, and cooperate through the international division of labor, coordination and strengthening cooperation, to reduce the partial overlapping resource space. At the same time, the utilization capacity of superior resources to achieve cooperation in competition and seek common development.
This symbiotic relationship exists between upstream and downstream industries where- by the upstream industries are the productive resources of the downstream industries, and the downstream industries are the market resources of the upstream industries. Together, they forma relationship based on resource complementarity and dependence. When mani- fested in the countries, the relationship reflects the cooperation between countries that make full use of their superior and unique resources while releasing some repeated re- sources and improving utilization efficiency. Therefore, the symbiosis of a national trade niche expands the niche to promote the trade level when there are trade overlaps between countries.
The Figure 8 analysis it can be seen that the scope and efficiency of resource utilization for both country A and country B change simultaneously after adopting the niche symbio- sis and that the symbiosis results in a decrease in overlaps and an expansion of each niche.
Based on the real diagnosis analysis, China and the United States, and Japan growing niche overlap values, fierce rivalry. To reduce the huge impact on Chinaʼs trade due to the large niche overlap, we can choose to coexist with countries with large overlap value through, for example, the joint development of resources. Therefore, China must take full advantage of the existing human resources to develop the downstream industries at the present stage and pursue mutually beneficial relationships with upstream industries from developed countries to achieve win-win promotion. In the meantime, we should excavate the characteristic and superior resources and develop the relevant upstream industries to improve the technology of production. In addition, we should also cooperate with the down- stream industries from developing countries and strive to expand the utilization scope of resources to realize mutual symbiosis with countries of competitive relationships.
VI.Conclusions
With respect to the national trade niche and based on the ecological theory, we find, in general, that since joining the WTO, Chinaʼs trade niche is stable after having climbed to the top in 2002 as a result of foreign market expansion and international trade rules. Since 2009, the trade niche has begun to increase again, producing remarkable results due to Chinaʼs positive attitude regarding the financial crisis and its imperative policy to stimu- late the economy, stabilize foreign demand and expand domestic demand.
However, there is still a significant gap between China and traditional trade powers in terms of the trade niche, especially as reflected through environmental and social aspects.
On one hand, China should put forth greater effort to protect the environment and should promote energy efficiency to upgrade the environmental friendly development of Chinaʼs trade. On the other hand, we should also increase the R&D expenditures, enhance civ- il quality, strengthen the construction of the social legal system, optimize the administra- tive system of the government, and as a consequence, improve the national trade niche as well as international competitiveness and trade status.
According to the analysis of the breadth and overlap of the national trade niche, the niche breadth value of Chinaʼs trade is decreasing year-by-year and the breadth itself is narrowing, which suggests that there exists a significant differentiation between the utili- zation efficiency of different resources and improvements in utilizing certain resources. In the meantime, the niche overlap between China and developing countries (such as the Unit- ed States and Japan) is increasing, which results in fierce competition in bilateral trade.
Therefore, to improve the current low resource utilization ability in China and to face
The national trade niche
resource country A
country A
country B country B
Note: It is sorted out by the author, according to Wu (₂₀₀₆).
Figure 8 Thesymbiosis of a national trade niche