1
Doctorate Dissertation
Studies on the evaluation of fish attraction performance around anchored Fish Aggregating Devices (aFADs)
Khyria Swaleh Karama
Graduate School of Fisheries and Environmental Sciences Nagasaki University, Japan
2019
2 Contents
Chapter 1. Insights of artisanal fishing condition in Kenya and the potential of aFADs to re-
distribute the fishing effort to the offshore ... 5
1.1 Fisheries in Kenya ... 5
1.2 Status of the marine fishery in Kenya ... 5
1.3 Investigating catch composition of beach seine fishery in Lamu, Kenya ... 7
1.4 Materials and methods ... 8
1.4.1 Study sites ... 8
1.4.2 Data collection ... 8
1.4.3 Data analysis ... 8
1.5 Results ... 8
1.6 Discussion ... 9
1.7 Purpose/rationale of the present study ... 11
Chapter 2. A review on aFADs as a tool to promote and manage artisanal fisheries ... 23
2.1 Outline of Fish Aggregating Devices (FADs) ... 23
2.2 Examples of major countries implementing aFADs ... 24
2.2.1 The Philippines ... 25
2.2.2 Indonesia ... 25
2.2.3 Japan ... 26
2.2.4 Mauritius ... 27
2.2.5 Maldives ... 28
2.3 Issues related to aFADs ... 28
2.3.1 Impacts of FADs to the ecosystem ... 28
2.3.2 Over-exploitation ... 29
2. 3.3 Bycatch ... 29
2. 3.4 Aggregation of undesired fish ... 30
2. 3.5 Ghost gear ... 30
2. 4 Management of aFADs ... 31
2. 5 Discussion ... 31
Chapter 3. Evaluation of fish attraction around aFADs by optical techniques ... 38
3.1 Materials and Methods ... 38
3.1.1 Study sites (North and South aFADs) ... 38
3.1.2 ROV and underwater camera ... 38
3.1.3 Data collected by ROV ... 39
3.1.4 Data collected by underwater camera ... 39
3.1.5 Analysis... 39
3.2 Results ... 41
3
3.2.1 Observation of fish species around the aFADs ... 41
3.2.2 Observation of fish species by ROV ... 41
3.2.3 Observation of fish species by underwater camera around the north aFAD ... 42
3.2.4 ifference in the observation result by ROV and underwater camera around the north aFAD ... 42
3.2.5 The difference between water temperatures around the aFADs ... 42
3.3 Discussion ... 43
Chapter 4. Evaluation of fish attraction around aFADs by acoustic technique; echosounder .... 60
4.1 Materials and methods ... ...60
4.1.1 Study site ... 60
4.1.2 Echosounder specifications ... 60
4.1.3 Data collection ... 61
4.1.4 Data analysis ... 61
4.2 Results ... 62
4.2.1 Distribution of fish schools around the north and south aFADs ... 62
4.2.2 Distances of fish schools from the aFADs ... 64
4.2.3 Number of fish schools in terms of depth around the aFADs ... 64
4.2.4 Temperature and fish schools around the aFADs ... 65
4.2.5 Current conditions in terms of velocity, direction in relation to fish schools around the aFADs.65 4.3 Discussion ... 66
Chapter 5. Evaluation of fish residency by biotelemetry technique around aFADs ... 89
5.1 Movement pattern of red seabream Pagrus major and yellowtail Seriola quinqueradiata around Offshore Wind Turbine in Goto Islands, Japan using acoustic telemetry ... 89
5.2 Materials and methods ... 90
5.2.1 Study sites ... 90
5.2.2 Fish tagging ... 90
5.2.3 Acoustic monitoring ... 91
5.2.4 Analysis... 92
5.3 Results ... 93
5.3.1 Movement pattern of the tagged fish ... 93
5.3.2 Habitat usage of the tagged fish ... 94
5.4 Discussion ... 95
Chapter 6. General discussion ... 109
6.1 Future technical isssues that need to be considered for implementation of aFADs ... 111
References ... 115
Acknowledgements ... 137
Abbreviation list ... 138
4
Chapter 1 provides Insights of artisanal fishing condition in Kenya and the potential of aFADs to re- distribute the fishing effort to the offshore
Chapter 2 provides a review on aFADs about countries in the Eastern Asia and Indian Ocean regions as a tool to promote and manage artisanal fisheries
Chapter 3 provides studies on evaluation of fish attraction around aFADs by optical techniques
Chapter 4 provides studies on evaluation of fish schools attraction around aFADs by acoustic technique Chapter 5 provides studies on the evaluation of fish residency around aFADs by biotelemetry
technique
Chapter 6 provides discussions on the key findings in this study and future technical issues to be considered for implementation of aFADs
5 Chapter 1
Insights of artisanal fishing condition in Kenya and the potential of aFADs to re-distribute the fishing effort to the offshore
1.1 Fisheries in Kenya
Fisheries in Kenya contribute less than 1% to the country’s GDP. However, fisheries are recognised for the strategic values such as important source of livelihood to fishing communities. In addition, it contributes to food security and provide raw materials for production of animal feeds as well as fish oil and bioactive molecules for pharmaceutical industry. Fisheries also support auxiliary industries such as net making, packaging material industries, boat building and repair, transport, sports and recreation. Total fishery and aquaculture production in Kenya amounted to 186,700 tonnes in 2013, with 83% comes from inland capture fisheries (of which Lake Victoria contributed about 90%). The marine sector is outshone by the freshwater sector (Smart Fish 2011; Gomes 2012; FAO 2016). Fish consumption has been declining from a modest 6.0 kg/caput in 2000 to 4.5 kg/caput in 2011. The value of fish exports was about USD 62.9 million in 2012, about 5 times greater than the USD 12.3 million in fish imports. The fisheries sector generates direct and indirect employment for about 2.3 million Kenyans. In 2013, around 129,300 people derived their livelihood directly from fishing and fish farming activities (including 48,300 in inland waters, 13,100 in coastal waters fishing and around 67,900 in fish farming) (FAO 2016). Marine capture fisheries produce less than 9,000 tonnes per year, of which compared to neighbouring countries is low (FAO 2016). In Kenya, fishing in coral reef lagoons is one of the main sources of expendable income and animal protein for coastal people (Fig.1-1) (Glaesel 1997; Melleret-King 2000).
1.2 Status of the marine fishery in Kenya
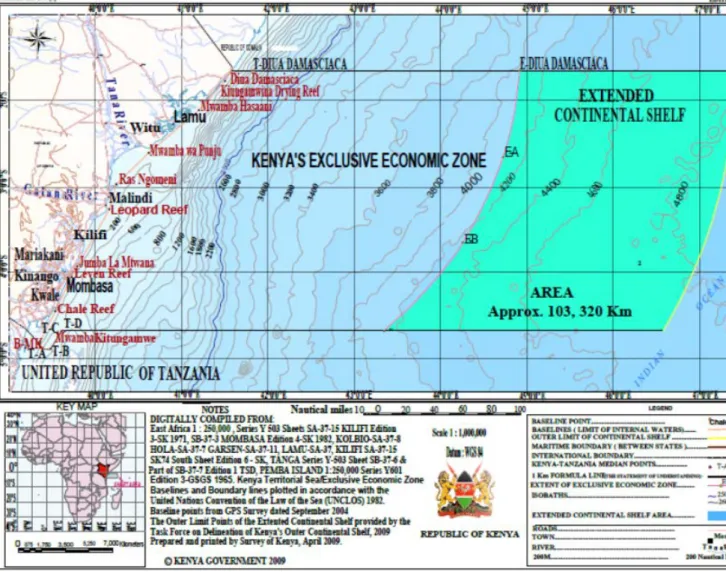
Kenya has a coastline of about 640 km stretching from 1º 30’S at the Somali border to 5º 25’S at the Tanzanian border (Maina 2012). Although the Kenyan EEZ was extended from 200 to 350 nm in 2009 (Fig.1-2) (FAO 2009), the coastal artisanal fishery largely operates within a narrow continental shelf confined to a small strip of 2.5 to 3.0 nm (McClanahan and Mangi 2004; Samoilys et al. 2011).
This region is largely dominated by fringing coral reefs, which occur within 12 nm of the coast (Fondo 2004). Some of the rich inshore grounds within this strip include the Funzi-Shirazi bay, the Diani- Chale area, Malindi-Ungwana Bay, the North Kenya Bank and the Lamu Archipelago (Maina 2012).
Most fishing activities take place between September and April (North-east monsoons) when the sea is calm (Mbaru et al. 2010, 2011). However, between May and August (South-east monsoons) the
6
fishing ability is mostly limited due to rough sea (McManus 1996; McCLanahan and Mangi 2004;
Morison 2004).
In the marine fisheries, different types of gear and vessels are deployed. The vessels include dugout canoes, motorized boats, sailboats (dhow), outrigger canoe (ngalawa), and open fishing boat (mashuwa) built to withstand rough seas and open fishing voyages. Major gears used by the artisanal fishers include: gillnets, beach seine nets, cast-nets, long-lines, hand-lines, spears, basket traps (lema), barricades (uzio) and weir traps (tata) (FAO 2016).
Fishing effort of artisanal fisheries tends to concentrate within the narrow continental shelf because of limitations in terms of the vessels and equipment used. For example, lobsters, crabs and octopus are increasingly targeted because of their high market prices (FAO 2016). Prawns are harvested by around 900 small-scale fishers along the entire Kenyan coastline in the inshore areas and by semi-industrial (KCDP 2015; KMFRI 2015; FAO 2016). In addition, the small and medium pelagic fishery in Kenya which is multi-species, multi-gear and multi-fleet target mostly the families Scombridae (trevallies), Sphyraenidae (barracudas), Scaridae (parrotfishes), Siganidae (rabbitfishes) and Hemiramphidae (halfbeaks). In addition, tuna fishery is carried out by artisanal fleet of around 800 small-scale vessels, all of which are typically confined to within 3-5 nm of the coast (Poseidon et al. 2014).
According to DoF (2010) the marine sub-sector’s annual potential of between 150,000 – 300,000 metric tons and contributes to around 0.5% of the country Gross Domestic Product (GDP) yearly. These apparent low yields have been associated with the use of rudimentary fishing technology within the heavily fished near shore areas (Muthiga and McClanahan 1987). Such as the use of beach seines, spear guns, trawlers and dynamite fishing that are of great concern due to their destructive and unselective nature by the ever increasing population (Shumway 1999; Mueni and Mwangi 2001;
Okemwa et al. 2004). In particular, the negative impacts of beach seines on nursery and breeding grounds as well as high capture of juveniles is documented (Rubens 1996; McClanahan et al. 1997).
However, illegal fishing using beach seines persists in most areas along the coast, despite being banned in 2001 (McClanahan et al. 2005). The incapacity of the local fishers venturing into the offshore waters has subsequently resulted into under exploitation of deep-sea fishing areas which are believed to be richer in pelagic stocks (FAO 2009).
Consequently, the marine fisheries in Kenya have historically received much less research and management attention (Muthiga and McClanahan 1987; Obura 2001; DoF 2004; Fondo 2004).
Nevertheless, the importance of this sub-sector cannot be underestimated as it supports about 80,000 fishers directly (UNEP 2006), and about 800,000 individuals (processors, traders and other service providers) indirectly (DoF 2010).
7
In this thesis, I first discussed the status of the beach seine fishery in Lamu from the data collected under the Kenya Coastal Project (KCDP) as a case study to have a better understanding of the marine fisheries in Kenya.
1.3 Investigating catch composition of beach seine fishery in Lamu, Kenya
Fishing with beach seine nets in reef lagoons contributes substantially to food security and economic activity in coastal villages in Kenya (FAO 2011). Beach seining is particularly common in Lamu area in the north coast, where it has been assimilated into the fishing culture after being introduced by migrant fishers over 30 years ago (FiD 2015). However, beach seining is considered to be a destructive fishing activity, and its use has been banned in Kenya since 2001 (Kenya Gazette Notice No. 7565 Vol. CIII. No. 69, 2001). Nevertheless, many artisanal fishers do not comply with the ban (McClanahan et al. 2005), and the number of beach seine nets in the marine artisanal fishery has remained relatively constant, with frame surveys reporting 139 nets (2008), 211 nets (2012) and 193 nets (2014) over the past decade (FiD 2015). Cinner et al. (2009) suggested that fishers do not comply with the ban because of lack of alternative employment opportunities. Noncompliance with regulations undermines the effectiveness of fisheries management (Madrigal-Ballestero et al. 2013; Turner et al.
2014; Pomeroy et al. 2015).
The physical effects of beach seining on reefs and associated habitats have been well documented (McClanahan and Mangi 2001). Areas affected by beach seining often have significantly smaller corals and a lower density of coral colonies (Mangi and Roberts 2006). Dragging a net across the seafloor leads to resuspension of bottom sediment, increasing turbidity and smothering benthic organisms (Jones 1992). It also removes or crushes epibenthic organisms such as corals, seagrasses and sponges (Sainsbury et al. 1997). Beach seine nets are long and mobile, and can therefore affect large areas of seafloor habitats where they are frequently used (McManus 1997; Auster 1998; Watling and Norse 1998). Beach seining captures a range of fish species and sizes that occur in the intertidal and shallow subtidal zones (Gough et al. 2009), and the codend mesh size used will determine the selectivity of the gear (FAO 2011). Using a small mesh size is likely to capture a larger proportion of juvenile fishes (Nunoo and Azuma 2015), and the lead line of the net may also destroy fish spawning grounds while being dragged over the seafloor. Fisheries regulations that specify a minimum mesh size can be used to manipulate the selectivity properties of gear, to reduce the proportion of juvenile fishes smaller than a given size in catches. Mesh size can also be adjusted to reduce catches of non-target species, through size selectivity (MacLennan 1992; 1995). Knowledge of fishing gear selectivity is therefore important within the context of fisheries management. Therefore, the effects of codend mesh sizes on the species composition and size of fish caught by beach seine nets in Lamu was assessed in this chapter.
8 1.4 Materials and methods
1.4.1 Study sites
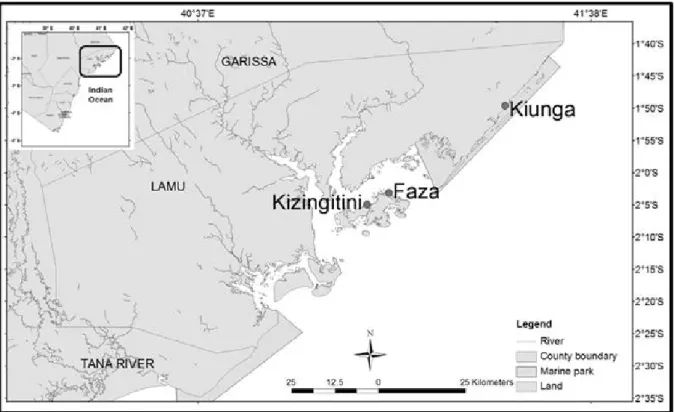
Catch assessment surveys were carried out on 1st–7th May 2014, 6th–12th March 2015, and 9th– 14th May 2016 at the main beach seine fishing grounds in Lamu (Kiunga, Faza, Kizingitini) (Fig. 1-3).
The area is highly productive with rich fishing grounds influenced by northeast and southeast monsoon winds. The sampled beach seines comprised of a seine body with different nominal codend mesh sizes of 25 mm, 38 mm and 44 mm, with anterior and posterior wings attached, which is hauled by up to 30 fishers at a time. The upper part of the net is maintained on the surface by a float line (150 – 400 m long) and the footrope on the seafloor comprises a lead line with sinkers to prevent fish from escaping the enclosure. The wings are attached to hauling ropes (FAO 2011).
1.4.2 Data collection
A representative catch sample was collected with a bucket from 33 hauls (Table 1-1), after removing marine litter. The sub-sample of the catch was identified to species level using field guides (Smith and Heemstra 1986; Lieske and Myers 1994). Fish total length (TL) was measured to the nearest 1 mm using a fixed ruler on a fish measuring board, and individual weights were recorded to the nearest 0.01 g using a weighing balance. Fish were grouped into length class categories to enable a comparative analysis between codend mesh sizes.
1.4.3 Data analysis
Simpson’s Diversity Index was used as a measure of diversity for individual mesh sizes, because it takes into account the number of species present, as well as the relative abundance of each species. The index was calculated using the equation,
D =∑ (𝑛𝑛 (𝑛𝑛 − 1))/ ((𝑁𝑁 (𝑁𝑁 − 1)),
Where n is the number of individuals of each species, and N is the total number of individuals of all species. A non-parametric Kruskal–Wallis test was used to compare the fish that was retained by the three mesh sizes, based on the mean ranks of groups. Mesh selectivity was also determined from size frequencies of the dominant species caught by the different codend mesh sizes, based on the assumption that the community is the same. The length at maturity (Lmat) of dominant species was obtained from Hicks and McClanahan (2012) and the proportion of fish smaller than Lmat retained by the different mesh sizes was calculated.
1.5 Results
9
Species composition included bony fishes, crustaceans, molluscs, cephalopods and echinoderms. About 98 species belonging to 41 families were collected and the catch was dominated by three major families; namely Scaridae, Siganidae, and Lethrinidae. The main families that were caught and retained by the 25 mm mesh, but escaped from 38 mm and 44 mm mesh, were small-bodied fish species including Apogonidae (fragile cardinal fish Apogon fragilis, reef-flat cardinalfish Ostorhinchus taeniophorus, orangelined cardinalfish Taeniamia fucata), Monocanthidae (spectacled filefish Cantherhines fronticinctus), Clupeidae (spotted sardinella Amblygaster sirm) and Labridae (three-ribbon wrasse Stethojulis strigiventer).
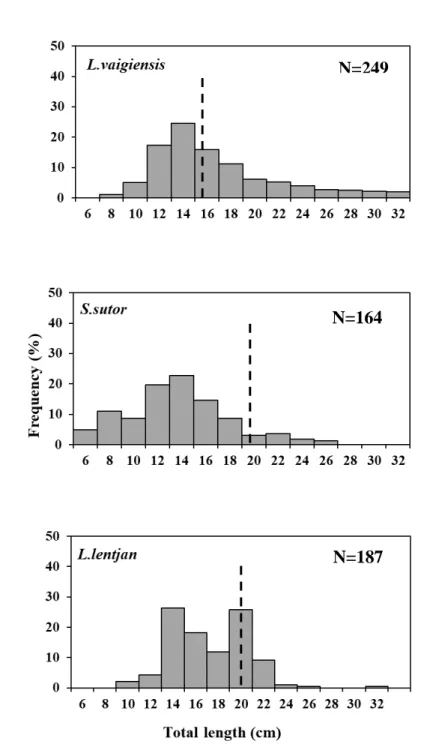
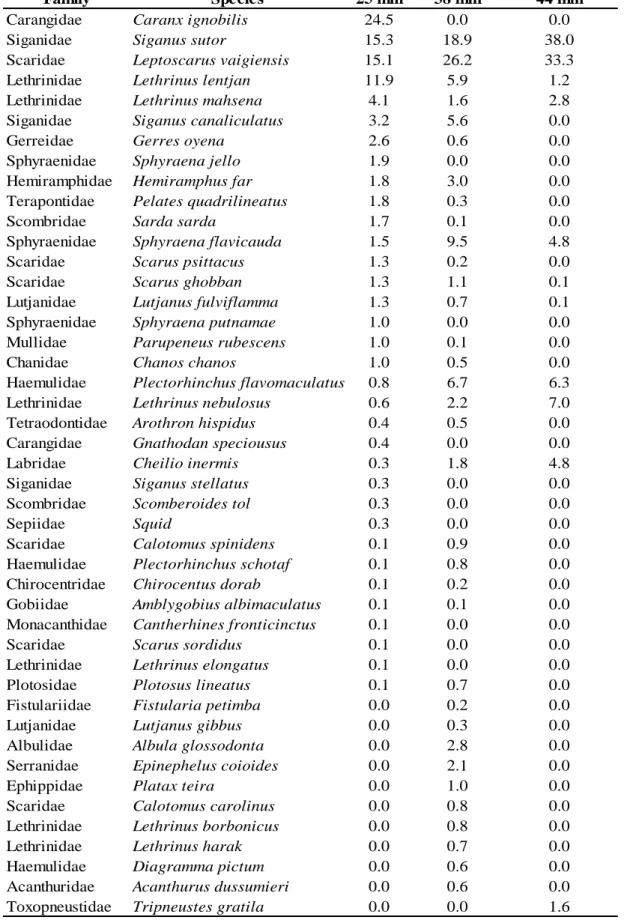
In terms of numbers of fish, 25 mm and 38 mm meshes caught mostly marbled parrotfish Leptoscarus vaigiensis, followed by whitespotted rabbitfish Siganus sutor and pink ear emperor Lethrinus lentjan, whereas similar numbers of L. vaigiensis and S. sutor were caught by the 44 mm mesh (Table 1-2). In terms of weight, S. sutor dominated the catch made with the 44 mm mesh, followed by L. vaigiensis and L. lentjan. Catches made by the 38 mm mesh were dominated by L. vaigiensis, followed by S. sutor and L. lentjan (Table 1-3). The Simpson index indicated that the samples caught with the 25 mm mesh had the highest diversity (D = 10.67), followed by the 38 mm mesh (D = 6.69) and the 44 mm mesh (D = 3.04).
Mesh selectivity for the three dominant species differed significantly (Kruskal-Wallis test, p<0.05; L. vaigiensis H = 87.09, S. sutor H = 34.61, and L. lenjan H = 179.82). Some 48.0% of L.
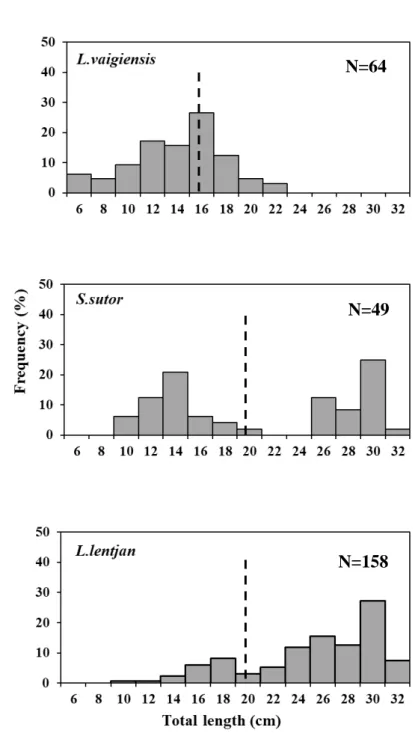
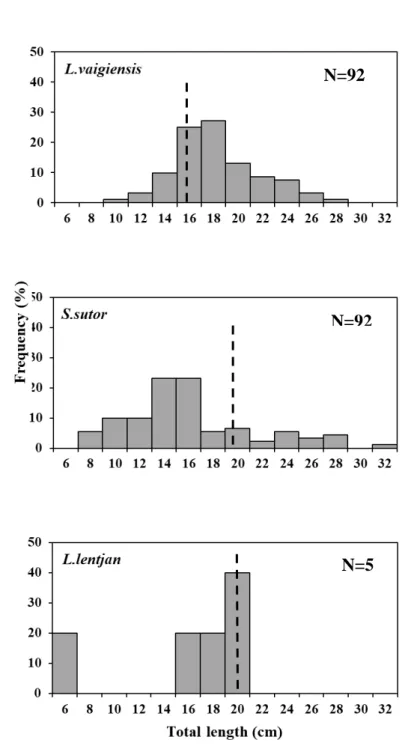
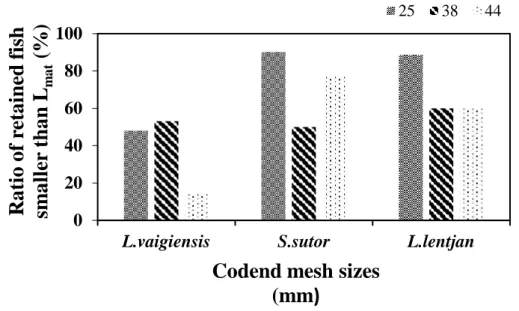
vaigiensis retained by the 25 mm mesh were smaller than the 15.1 cm Lmat. Similarly, 90.2% of S. sutor caught with the 25 mm mesh were smaller than the Lmat of 20.2 cm, and 88.7% of L. lentjan were also smaller than the Lmat of 20.3 cm (Fig.1- 4). Some 53.1% of L. vaigiensis landed by the 38 mm mesh, 50% of S. sutor, and 60% of L. lentjan were smaller than the respective Lmat estimates (Fig.1-5). Only 14.1% of L. vaigiensis retained with the 44 mm mesh were smaller than Lmat. However, the 44 mm mesh also retained substantial proportions of immature (< Lmat) S. sutor (76.9%) and L. lentjan (60%) (Fig.1- 6). The sample size of L. lentjan was small, and may have affected the results. Overall, the results confirmed that the 25 mm mesh size retained proportionally more individuals smaller than the Lmat than the 38 mm and 44 mm meshes (Fig.1-7).
1.6 Discussion
Comprehensive studies on the species composition and size structure of beach seine catches and the effects of gear selectivity on target species are limited in Kenya, where the use of beach seines are prohibited, although not strictly enforced. Attempts to replace beach seine nets with other gear types have been ineffective, and the use of beach seines persists. As an alternative to prohibiting beach seines,
10
implementing a larger mesh size might reduce the impacts on exploited fish populations. Therefore, we analyzed fish caught with different codend mesh sizes, to assess species and size selectivity.
Beach seines with fine mesh codends are active fishing gears known for efficiently capturing a wide range of fish sizes including small, immature individuals (Mangi and Roberts 2006). Beach seines are also known to catch a high diversity of fish species, but with only a few species dominating by weight or numbers (Gell and Whittington 2002). The results from the present study support the findings by Cinner et al. (2009) and Unworth and Cullen (2010) that beach seine catches are dominated by seagrass fish assemblages and coral reef affiliated species that utilize sea grass meadows for feeding.
Catches made with 25 mm mesh were most diverse, because the finer mesh retained small- bodied species, such as A. fragilis, O. taeniophorus, and T. fucata which may escape through the 38 mm and 44 mm meshes. Similar results were observed in various studies in South Africa (Lasiak 1984), Ghana (Nunoo et al. 2007) and the western Aegean Sea (Stergiou et al. 1997). Lasiak (1984) confirmed that the species diversity reflects differences in sampling techniques, length and mesh size of gears used, and the differences in the shore-zone fish assemblage. The 25 mm mesh caught both mature and immature L. vaigiensis, S. sutor and L. lentjan. These are the most abundant and commercially important species for the Kenyan artisanal fisheries (Hicks and McClanahan 2012). Using the 38 mm and 44 mm meshes generally increased the size at first capture of these species, but also reduced the quantity of fish caught by the gear. This poses a conundrum, because the Lamu fishing communities depend on fish for food security and economic activity, and reducing catch rates by increasing mesh size may affect their income. At the same time, the natural resource-base may be under stress from over- harvesting of juvenile fish by small mesh sizes. The concerns surrounding the capture of juvenile fish are that potential yields may be reduced by growth overfishing, or that too few individuals survive to maturity, resulting in recruitment overfishing (Hutchings and Lamberth 2002).
It is suggested that an appropriate mesh size is introduced (not a biological optimum, but larger than 25 mm mesh) through stakeholder agreements or voluntary action by fishers. This is already practiced by some fishers in Lamu, who use nets with 38 mm and 44 mm codend mesh sizes. An experimental procedure to collect sufficient data to support robust selectivity analysis is suggested.
Reliable measurements of mesh size should be considered during stock assessments, when estimating fishing mortality rates. Moreover, enforcement officers and net makers should ensure fishers use recommended codend mesh sizes. By regulating mesh sizes, and without outright banning of beach seine nets, fisheries managers should be able to control fishing mortality of smaller species and immature individuals of dominant larger species. As a mitigation measure, this study recommends deployment of anchored Fish Aggregating Devices (hereafter referred as aFADs) offshore which will reduce fishing pressure along the coastline and this will have a positive impact on the ecosystem. In
11
addition, it will also improve on the catch composition of the small scale fishers and improve on their living standards.
1.7 Purpose/rationale of the present study
From the case study of beach seine fishery in Lamu, I described the present status of artisanal fisheries in general that mainly consisted of small catch amount and catch of immature fish species.
While artisanal fisheries are often considered to be ‘eco-friendly’ by their nature, it is well-documented that intensive artisanal fishing can contribute to the degradation of marine resources by affecting the ecological balance and losses of local biodiversity (McClanahan et al. 1990, 2001). This seems also to be the case in Kenya. One of the major changes in the state of the coral reefs in Kenya is the dramatic decline in the number and individual size of finfish. Fishing activities have reduced fish populations in studied reefs causing a severe decline in the species richness of the fished areas (Mangi et al. 2007).
Unrestricted access into the marine fishery in the Kenya’s coastline and the increased use of improper fishing technology (such as beach seine fishing net) are considered to be the major cause of this decline (Ochiewo 2004; Oluoch et al. 2009). Increased poverty is driving people into fisheries, thereby increasing fishing pressure. Compliance levels to most of the fisheries regulations have been low, which has been linked to poor enforcement. In some cases, the rules are unknown and unclear to fishers (Mangi et al. 2007). In a different study on Kenyan coastal fisheries carried out by Hoorweg et al. (2009), nearly all fishers interviewed were concerned with the degradation of marine resources and mentioned declining catches. Reasons for reduction in marine resources given included the growing number of fishers, official establishment of no-take areas, rough weather (notably the heavy El-Niño rains of 1997/98) and competing fisheries such as commercial trawling (Hoorweg et al. 2006). A report by Poseidon et al. (2014) also concluded that while the domestic prawn/shrimp and demersal fisheries are exploited by small-scale vessels and industrial activity is lacking, stocks are probably overfished and subject to overfishing due to poor fisheries management.
In order to arrive at a more sustainable fisheries and increase food security despite the challenges facing the marine fishery in Kenya. It is prerogative that the number of fishers, and hence the fishing effort exerted in the coastal zone, is strictly managed. The reduction of fishing effort in the inshore fisheries is the most promising option. This is achievable through the displacement of effort to the near offshore area. Since full potential of small and medium pelagic fisheries along the Kenyan coast is not yet known (KCDP 2015) and the potential maximum sustainable yield biomass is estimated to be at least 15 times higher than current documented marine catches (FAO 2016). With this regard, introduction of aFADs has a potential to achieve sustainability of marine fisheries as well as to ensure healthy and productive fisheries by enhancing nearshore small-scale fisheries where stocks are often overfished. The aFADs are meant to relocate fishers from the heavily exploited lagoon areas to the open
12
sea, with a view to increasing their catch rate and concurrently reducing fishing pressure in the lagoon and to increase the supply of fish on the local market. The aFADs also represent a win-win opportunity for fishers and coral reef conservation. In addition, the aFADs have the potential to improve fishers’
incomes both in the short and long term, through increased catch prices of valuable fish species associated with aFADs. From the above objectives, my thesis presents a review of aFADs in chapter 2 to present the current status and issues in countries where aFADs are commonly used. I focussed on the key information of the aFADs in the region.
13 Figures and Tables (Chapter 1)
Figure 1-1. A map showing marine waters of Kenya and the main fish landing sites (Source:
small and medium pelagic management plan 2013)
14
Figure 1-2. Kenyan Territorial Sea and Exclusive Economic Zone (EEZ) (Source: FAO 2009)
15
Figure 1-3. A map of the north coast Kenya, with dark filled circles showing the sampling sites in Lamu
16
Figure 1-4. Comparative size frequency graphs for 25 mm codend mesh size of the three dominant species. Dotted lines designated the size of Lmat.
N=249
N=164
N=187
17
Figure 1-5. Comparative size frequency graphs for 38 mm codend mesh size of the three dominant species. Dotted lines designated the size of Lmat.
N=64
N=49
N=158
18
Figure 1-6. Comparative size frequency graphs for 44 mm codend mesh size of the three dominant species. Dotted lines designated the size of Lmat.
N=92
N=92
N=5
19
Figure 1-7. Ratios (%) of the three dominant species <Lmat retained by different codend mesh sizes.
0 20 40 60 80 100
L.vaigiensis S.sutor L.lentjan
Ratio of retained fish smaller than L mat(%)
Codend mesh sizes (mm)
25 38 44
20 Table 1-1. Summary of the field surveys
21
Table 1-2. Species composition by count (%) by codend mesh sizes.
Numbers 1367 789 229
D 10.67 6.69 3.04
Family Species 25 mm 38 mm 44 mm
Scaridae Leptoscarus vaigiensis 18.6 26.1 40.2
Lethrinidae Lethrinus lentjan 13.8 6.3 1.7
Siganidae Siganus sutor 13.2 25.9 40.2
Lethrinidae Lethrinus mahsena 10.8 5.1 7.9
Terapontidae Pelates quadrilineatus 5.2 0.8 0.0
Gerreidae Gerres oyena 4.9 1.3 0.0
Scaridae Scarus psittacus 3.8 1.0 0.0
Siganidae Siganus canaliculatus 3.7 5.3 0.0
Scaridae Scarus ghobban 3.2 1.3 0.4
Lethrinidae Lethrinus nebulosus 2.6 1.6 2.6
Sphyraenidae Sphyraena flavicauda 2.3 5.4 1.7
Mullidae Parupeneus rubescens 2.1 0.3 0.0
Lutjanidae Lutjanus fulviflamma 1.7 0.6 0.4
Scombridae Sarda sarda 1.7 0.1 0.0
Labridae Stethojulis strigiventer 1.4 0.0 0.0
Haemulidae Plectorhinchus gaterinus 1.0 0.9 0.0
Hemiramphidae Hemiramphus far 0.7 1.9 0.0
Labridae Cheilio inermis 0.4 1.6 2.6
Plotosidae Plotosus lineatus 0.4 0.1 0.0
Gobiidae Priolepis cincta 0.4 0.0 0.0
Scaridae Scarus sordidus 0.4 0.0 0.0
Sphyraenidae Sphyraena jello 0.4 0.0 0.0
Haemulidae Plectorhinchus flavomaculatu 0.4 1.9 2.2
Clupeidae Amblygaster sirm 0.3 0.0 0.0
Leiognathidae Karalla daura 0.3 0.1 0.0
Siganidae Siganus stellatus 0.3 0.1 0.0
Sepiidae Squid 0.3 0.0 0.0
Scaridae Calotomus spinidens 0.3 3.2 0.0
Apogonidae Apogon fragilis 0.2 0.0 0.0
Lethrinidae Lethrinus microdon 0.2 0.0 0.0
Apogonidae Ostorhinchus taeniophorus 0.2 0.0 0.0
Haemulidae Scolopsis ghanam 0.2 0.1 0.0
Apogonidae Taeniamia fucata 0.2 0.0 0.0
Monacanthidae Cantherhines fronticinctus 0.2 0.0 0.0
Carangidae Caranx ignobilis 0.2 0.1 0.0
Apogonidae Cheilodipterus quinquelineat 0.2 0.3 0.0
Carangidae Gnathodan speciousus 0.1 0.3 0.0
Tetraodontidae Arothron hispidus 0.1 0.3 0.0
Chanidae Chanos chanos 0.1 0.3 0.0
Fistulariidae Fistularia petimba 0.1 0.3 0.0
Lutjanidae Lutjanus gibbus 0.1 0.4 0.0
Monacanthidae Paramonocanthus frenatus 0.1 0.3 0.0
Clupeidae Sardinella gibbosa 0.1 0.3 0.0
Scombridae Rastrelliger kanagurta 0.0 0.3 0.0
Ephippidae Platax teira 0.0 0.5 0.0
Labridae Halichoeres scapularis 0.0 0.3 0.0
Lethrinidae Lethrinus harak 0.0 0.4 0.0
Serranidae Dermatolepsis striolata 0.0 0.5 0.0
Serranidae Epinephelus coioides 0.0 0.5 0.0
Serranidae Epinephelus malabaricus 0.0 0.3 0.0
Pomacentridae Abudefduf sexfasciatus 0.0 0.5 0.0
22
Table 1-3. Species composition by weight (%) by codend mesh sizes.
Family Species 25 mm 38 mm 44 mm
Carangidae Caranx ignobilis 24.5 0.0 0.0
Siganidae Siganus sutor 15.3 18.9 38.0
Scaridae Leptoscarus vaigiensis 15.1 26.2 33.3
Lethrinidae Lethrinus lentjan 11.9 5.9 1.2
Lethrinidae Lethrinus mahsena 4.1 1.6 2.8
Siganidae Siganus canaliculatus 3.2 5.6 0.0
Gerreidae Gerres oyena 2.6 0.6 0.0
Sphyraenidae Sphyraena jello 1.9 0.0 0.0
Hemiramphidae Hemiramphus far 1.8 3.0 0.0
Terapontidae Pelates quadrilineatus 1.8 0.3 0.0
Scombridae Sarda sarda 1.7 0.1 0.0
Sphyraenidae Sphyraena flavicauda 1.5 9.5 4.8
Scaridae Scarus psittacus 1.3 0.2 0.0
Scaridae Scarus ghobban 1.3 1.1 0.1
Lutjanidae Lutjanus fulviflamma 1.3 0.7 0.1
Sphyraenidae Sphyraena putnamae 1.0 0.0 0.0
Mullidae Parupeneus rubescens 1.0 0.1 0.0
Chanidae Chanos chanos 1.0 0.5 0.0
Haemulidae Plectorhinchus flavomaculatus 0.8 6.7 6.3
Lethrinidae Lethrinus nebulosus 0.6 2.2 7.0
Tetraodontidae Arothron hispidus 0.4 0.5 0.0
Carangidae Gnathodan speciousus 0.4 0.0 0.0
Labridae Cheilio inermis 0.3 1.8 4.8
Siganidae Siganus stellatus 0.3 0.0 0.0
Scombridae Scomberoides tol 0.3 0.0 0.0
Sepiidae Squid 0.3 0.0 0.0
Scaridae Calotomus spinidens 0.1 0.9 0.0
Haemulidae Plectorhinchus schotaf 0.1 0.8 0.0
Chirocentridae Chirocentus dorab 0.1 0.2 0.0
Gobiidae Amblygobius albimaculatus 0.1 0.1 0.0
Monacanthidae Cantherhines fronticinctus 0.1 0.0 0.0
Scaridae Scarus sordidus 0.1 0.0 0.0
Lethrinidae Lethrinus elongatus 0.1 0.0 0.0
Plotosidae Plotosus lineatus 0.1 0.7 0.0
Fistulariidae Fistularia petimba 0.0 0.2 0.0
Lutjanidae Lutjanus gibbus 0.0 0.3 0.0
Albulidae Albula glossodonta 0.0 2.8 0.0
Serranidae Epinephelus coioides 0.0 2.1 0.0
Ephippidae Platax teira 0.0 1.0 0.0
Scaridae Calotomus carolinus 0.0 0.8 0.0
Lethrinidae Lethrinus borbonicus 0.0 0.8 0.0
Lethrinidae Lethrinus harak 0.0 0.7 0.0
Haemulidae Diagramma pictum 0.0 0.6 0.0
Acanthuridae Acanthurus dussumieri 0.0 0.6 0.0
Toxopneustidae Tripneustes gratila 0.0 0.0 1.6
23 Chapter 2
A review on aFADs as a tool to promote and manage artisanal fisheries
In this chapter, I discussed about countries in the Eastern Asia and Indian Ocean regions where aFADs were traditionary used or successfully implemented. The main focus was on the implementation of aFADs, their designs, fisheries, target species and others in the above mentioned regions. The aim was to give information since aFADs are an important tool for promoting and managing artisanal and small-scale commercial fisheries all over the world including Kenya. The aFADs are known to increase localized catches at reduced costs and thereby improving food security and livelihoods for coastal communities.
2.1 Outline of Fish Aggregating Devices (FADs)
Fish Aggregating Devices, or FADs are simply man-made, floating devices, which make use of the natural habit by aggregating pelagic fishes for subsistence, recreational and commercial fishing.
The use of FADs has increased, this has reduced the uncertainty of finding fish and has generated new opportunities with greater reliability in all oceanic areas. The success of FADs in aggregating fish has made these devices important to the commercial, local and sports fisheries of many tropical, sub- tropical seas and oceans in the world (Buckley and Miller 1994; Higashi 1994; Kitamado and Kataoka 1996; Dagorn et al. 2010). However, there have been several concerns that FADs may modify both fish movement and the condition for pelagic fish such as tuna species, which has been hypothesized as a significant ecosystem impact (Marsac et al. 2000; Dempster and Taquet 2004; Hallier and Gaertner 2008).
There are two main types of FADs. The first type used is drifting FADs (dFADs) that drift freely with the currents and are deployed for exclusive use of the boat or fleet that set them afloat (Beverly et al.2012). They are deployed in both EEZ and high seas areas with the aim of increasing the efficiency of the high volume purse seine fishing. This phenomenon has been exploited by fishers to augment their catch, and over the past few decades, dFADs have grown to be the key component of tropical pelagic fisheries including tuna industrial fishing fleets (Bromhead et al. 2003; Dagorn et al.
2013; Davies et al. 2014). The dFAD related purse seining is nowadays a technologically advanced fishery that yields over half of the worldwide recorded tuna landings (Fonteneau et al. 2000a, 2000b;
Moreno et al. 2007). However, dFADs has raised concerns regarding adverse effects on migratory patterns (Hallier and Gaertner 2008; Menard et al. 2000), school composition status (Fonteneau et al.
2000b), growth (Jaquemet 2011), predation rates (Essington et al. 2002) and juvenile catches (Fonteneau et al. 2013). Because of these concerns and economic importance, dFADs are frequently studied and reviewed lately (Dagorn et al. 2013; Fonteneau et al. 2013; Davies et al.2014).
24
The second type of FADs is known as anchored FADs (aFADs, also referred to as moored FADs). The role of aFADs in fisheries and in the regions is different from dFADs. Unlike dFADs for commercial purse seine fisheries, the introduction of aFADs has mainly been promoted throughout the world to assist small-scale fisheries (Itano et al. 2004). The aFADs were first used in the Philippines before World War II to support small-scale fisheries (de Jesus 1982). Its use was documented in the Mediterranean and was first introduced into the Pacific from the Philippines, via Hawaii, in the late 1970s with a high rate of success: in 1984 more than 600 aFADs were deployed in the western and central Pacific Ocean region (Desurmont and Chapman 2000). The aFADs are used extensively by many countries (Fréon and Dagorn 2000), in the Pacific (Holland et al.2000; Kakuma 2000; Dagorn et al.2013), Indian(Tessier et al. 2000) and Atlantic oceans (Morales-nin 2000; Reynal et al. 2000).
In general, aFADs are mainly placed in coastal and offshore zones, at depths from less than 100 m(Yusfiandayani 2013) up to 5000 m (Aprieto 1991) in order to attract pelagic species including tunas. Construction and sizes vary from small scale traditional types made from natural materials to large scale modern types made from steels and/or plastics. They are frequently used to provide enhanced opportunity for artisanal and semi-industrial fishers and are usually fished using several techniques, such as trolling, pole and line, traps, vertical long-line, handline, ringnet and sometimes purse-seine.
In the industrial sector, private investors fund the deployment and monitoring of their own aFADs. These industrial aFADs are used extensively in countries like Indonesia, Papua New Guinea, the Philippines, Thailand, Federated States of Micronesia and the Solomon Islands (Desurmont and Chapman 2000). In small-scale fisheries, aFADs are almost exclusively maintained and deployed by the public sector and overseas funding agencies (de San and Pages 1998). Many aFAD settlement programs are designed as a small-scale fishery management approach to relieve the frequently heavy fishing pressure being experienced by coastal species by transferring effort toward pelagic species, including tunas. These programs are thought to provide many positive benefits for local fisheries (Beverly et al. 2012). Since aFADs are gaining popularity and are important for small scale fisheries, I investigated beach seine being one of the most important fishery that contributes substantially to food security and economic activity in coastal villages in Kenya part of the Western Indian Ocean and how viable aFADs can be adopted in the country.
2.2 Examples of major countries implementing aFADs
Use of FADs is confirmed in 37 countries and regions in Atlantic Ocean, 33 in Pacific Ocean, 18 in Indian Ocean and 8 in the Mediterranean Sea according to (Taquet2013). These numbers are many and probably cover most countries that deploy aFADs, but geographical coverage would be
25
inevitably biased depending on author’s base. In case of the review by Taquet (2013), aFADs in Atlantic Ocean was reported in detail, but in Pacific, eastern Asian countries such as South Korea or Taiwan, which are strong users of both aFADs and dFADs were not covered. Accordingly, we present aFADs information for the following 5 countries based on the available information.
2.2.1 The Philippines
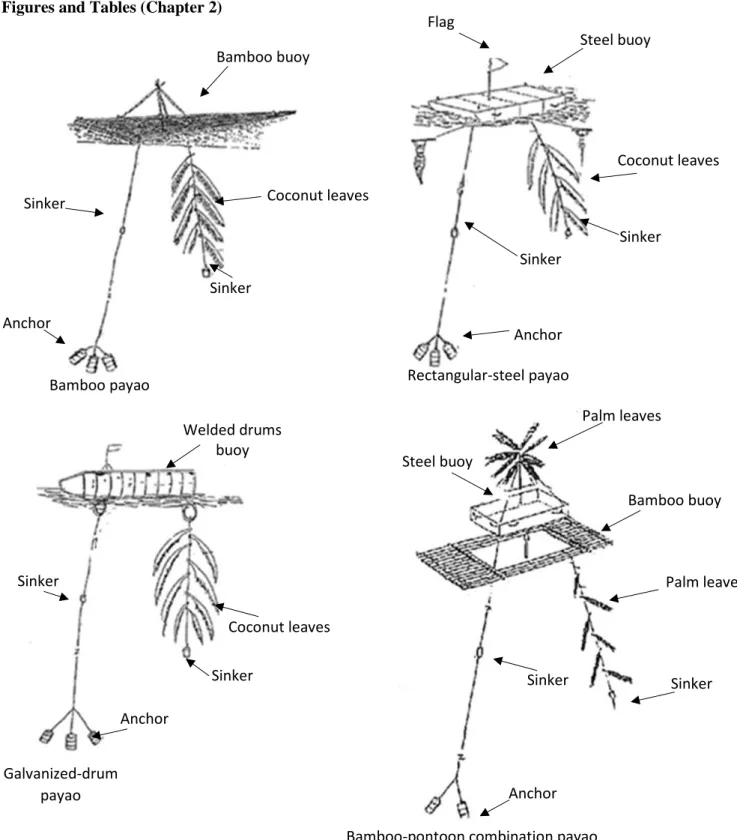
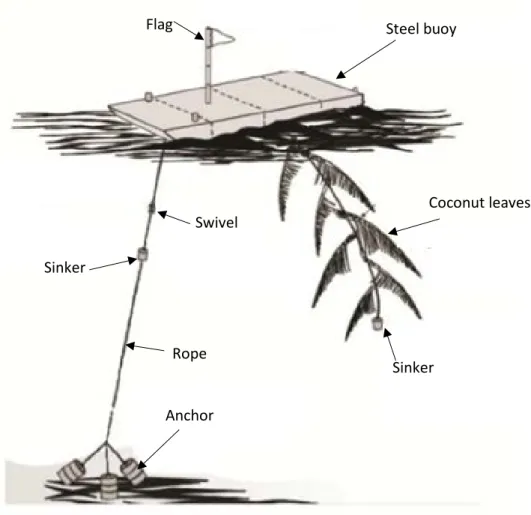
There is a wide variety of types and designs of aFADs used in the Philippines made of natural and modern materials including brush pile, twigs, bamboo, scrap tires, concrete and steel. The most popular type that emerged as the most economical and effective in terms of resource management and income enhancement for fishers i.e. the bamboo raft aFADs called “payao”. The use of payaos is widespread where thousands are anchored throughout to support subsistence, artisanal and commercial fisheries(Barut 1999). There is no statistics on the total number of payaos all over Philippines, but it was estimated that there were about 3000 payaos in Moro Gulf in the southern Philippines. Some payao fishing grounds are also found in the other parts of the archipelagic waters whereby established viable tuna and small pelagic fisheries exist(Barut 1999). Generally, payaos are crowded in the nearshore fishing grounds about 30 payaos anchored for each boat. They used simple bundles of bamboo provided on the underside with a hanging line of coconut leaves, later evolved into well-constructed double layer bamboo rafts with empty oil drums filled with concrete used to anchor the payao. This type of payaos are still commonly used in the coastal Philippine waters, but steel longer lasting raft type payaos are favored for use in exposed, offshore areas subject to rough sea conditions (Fig. 2-1).
Payaos support several small-scale fisheries such as handline fishery for tunas, purse seine and ringnet in the Philippines. Payaos are either owned by fishing companies or leased by concessionaires to the fishing companies for 20% of the price of the haul (Aprieto 1991). Payaos attract variety of species; the catches consist largely of juvenile tunas and small pelagic fish. In addition, 99% of the tuna production in the Philippines’ waters are payao-associated. Thus payaos may increase the total catch of tunas, but since majority of tunas in Philippine waters are apparently juvenile, the use of payaos increased the catch of small tunas without size selectivity (White 1982).
2.2.2 Indonesia
Traditional aFADs are called “rakit” and “rumpon” in Indonesia. Rakit is a kind of small aFADs made of traditional materials and deployed in shallow waters (50 - 200 m) while rumpon is relatively large scale aFADs set at waters ranging (400 - 4000 m deep) (Mathews et al.1995). They are used particularly in the eastern Indonesia waters since time immemorial (Gooding and Magnuson 1967;
Yusfiandayani 2013). Rumpon is categorized by its deployment depth, while rakit sometimes referred to as shallow water rumpon in some reports (Monintja and Mathews 2000; Yusfiandayani 2013). Some
26
fishers construct their rakit or rumpon in traditional manner by coconut leaves and bamboo stems to catch small pelagic fishes that looks similar to payaos in the Philippines. Due to long history of payaos in the Philippines and being the first country to use the aFADs to support small scale fisheries, Indonesia adopted the same technology to their country. While some fishers construct them using modern materials (Fig. 2-2). The rumpon usually lasts for a period of two months or less (Yusfiandayani et al.
2015).
The aFADs have been widely employed by artisanal fishers in the northern Java Sea and southern Celebes Sea. Fishers used aFADs to aggregate pelagic species inclusive of yellowfin tuna, skipjack tuna, mackerel, scads, carangids and sardines. The main fishing gear used around aFADs are handlining, trolling (Monintja 1993; Mathew et al. 1996), pole and line fishing (Monintja and Mathews 2000). In 2014, the approximate number of deep rumpon anchored by fishers were 250 units. There is a concern that pelagic species that aggregate around aFADs can be over exploited so easily that fishers are encouraged to collect catch and effort data to monitor the health status of the fish stocks (Yusfiandayani 2013). In that regards, the use of aFADs in Indonesia waters must be licensed by the Directorate of Capture Fisheries, Ministry of Marine Affairs and Fisheries Republic of Indonesia (Yusfiandayani 2013).
2.2.3 Japan
Japan also has a long history on aFADs usage such as 1500s in Tottori Prefecture, western part of Japan, they used FADs known as “tsukegi” or artificial drifting object made of brushwood to attract dolphinfish (Tottori Prefectural Government Web-page). Fishers in the southwestern parts of Japan used FAD (drifted and anchored) for their fishing. The traditional aFADs had a short lifetime (Otake 2013) about 1-2 years in Okinawa (Kai 2013). This led to development of aFADs that have a longer lifetime which was initiated by the local government in 1959 (Kumamoto 2013). In 1982 fishers who worked in South Pacific Ocean and the local government in Okinawa successfully developed high endurance aFADs called “Payao” adopting Philippine’s name, and practiced modern fishing (Kai 2013;
Wakabayashi 2013). This success story had an impact on the fisheries in the neighboring regions and aFADs spread to Miyazaki or Kochi Prefectures. From this, the MarinoForum 21, incorporated body of marine industries including fisheries, shipbuilding and environment assessment published a criterion for the design and construction of aFADs in 1992 (MarinoForum21 1992). Additionally, Fisheries Agency of Japan has published a book that presents the necessary requirements of aFADs. In order to construct and deploy aFADs it is necessary to pass through several administrations (Fisheries Agency 2015) levels including Fisheries Adjustment Commission. They also have to be approved by the coastguard and the local and/or national authorities. For example, available numbers of aFADs in Okinawa waters is limited less than 200 in numbers from the fisheries management point of view.
27
According to Kumamoto (Kumamoto 2013), aFADs in Japan are categorized by their designs i.e. “Surface type”, “Surface and mid-water (Subsurface) type” and “Mid-water type” (Fig. 2-3). The aFADs are also classified according to its function such as “Modern type”, “Simplified type” and
“Traditional type”(Wakabayashi 2013). For example, “Modern type” aFADs are used by recreational fishing normally installed with oceanographic sensors for environmental monitoring. The aFADs depth ranges from 14 m to 3000 m in Japan. The Prefectures that use aFADs for commercial fisheries include Kuroshio current area whereby “Surface type” and “Modern type” aFADs are popular; Okinawa (Kai 2013); Kagoshima (Sakaki 2013); Miyazaki (Nakanishi and Tokeshi 2013); Oita (Nishiyama 2010);
Kochi (Inaba 2013); Wakayama (Wakayama Prefectural Government Web-page); Mie (Mie Prefectural Government Web-page); Kanagawa(Anon 2013) and Tokyo (Bureau of industrial and labour affairs 2017). Which are large in size (e.g. aFAD off Kochi is L7.5xW3.9xH3.5 m) and equipped with sensors to measure water temperature, wind speed, current and direction of water to provide environmental information to the public. In waters where the sea traffic is heavy, “Mid-water type” aFADs are used.
The main target species for commercial fishing around Japan’s aFADs are pelagic fish including marlin, sailfish, billfish, swordfish, tunas, skipjacks, yellowtail, amberjack, dolphinfish and jack mackerels. They are mainly captured by hook and lines such as angling, trolling, longlines, but also by various purse seines. In the case of south islands of Kagoshima, landing of tuna and skipjack are all from aFADs fishing grounds. Available fishing methods around aFADs fishing grounds are mostly determined by regulations of various levels such as voluntary agreement among users to regulations. For example, fishers only employ either trolling, skipjack pole and line, bait angling or dolphinfish surrounding net for “Surface type” aFADs in Miyazaki Prefecture (Nakanishi and Tokeshi 2013)
2.2.4 Mauritius
Mauritius is one of the first countries in the South West Indian Ocean to start aFAD fishery (Venkatasami and Momode 1996). The aFAD fishery was introduced in Mauritius through an UNDP/FAO project to stop the declining fish landings from artisanal fishing sector and to control the increasing fishing pressure on the lagoon stocks. The artisanal aFAD fishery was to divert fishing effort away from the lagoon or from traditional fishing grounds to the outer/off-lagoon areas (Cayré 1991).
There was no local development stage in this country and the modern aFAD designs was introduced as shown in (Fig. 2-4). The aFADs are anchored at depths varying from 800 to 3000 m. The average lifetime of an aFAD has been estimated to be around 500 days (Chooramun and Senedhun 2013). Those aFADs were also introduced to Madagascar and Comoro Islands after Mauritius (Cayré et al. 1991).
As of 2013, 28 aFADs were deployed around Mauritius for artisanal fishers and other stakeholders. The fishing techniques generally practiced around aFADs are trolling with artificial bait, slow trolling with live bait, handlining, longlining and drift lining etc. Detailed information on fishing
28
gear used around aFADs in Mauritius is presented by de San and Pages (1998). The main species caught are albacore tuna, yellowfin tuna and skipjack tuna (Chooramun and Senedhun 2013). The production of artisanal aFADs fishery on the west coast, where most aFADs have been set (21 out of 28 from 2010 to 2012), was between 243 and 331 t per year (Chooramun and Senedhun 2013) equivalent to 5-6% of the total national catch (Beverly et al. 2012).
2.2.5 Maldives
Maldives has one of the highest numbers aFADs in the Indian Ocean. Deep-water aFADs about (1000 − 2000 m deep) were first introduced in the early 1980s by FAO project(Naeem and Latheefa 1995). By 1990, there were 10 aFADs deployed around the Maldives with the national tuna catch increasing from 30 000 t in 1980 to 70 000 t in 1990. Due to its success, Maldives maintained an array of about 45 aFADs, making it the largest aFADs array (Shainee and Leira 2011). Typical arrangement of aFADs are shown in (Fig.2-5). Different from traditional design found in Philippines or Indonesia, modern materials such as fiber- reinforced plastic (FRP) are used for floating part and netting is used as mid-water attractor instead of coconut leaves, that was typically used in aFADs in Southeast Asian countries. The average lifespan of aFADs installed from 1993 to 2008 was approximately 2 years and 1 month. About 82% of aFADs installed each year in the Maldives are lost (Shainee and Leira 2011).
Tuna catches in the Maldives peaked in 2006 with a catch of 166 000 t (138 000 t of skipjack tuna and 23 000 t of yellowfin tuna), majority of the catch was from aFADs. However, in 2010 the tuna catches plummeted to 77 000 t. Species composition of Skipjack tuna form nearly 60% of the catch in the Maldivian pole and line fishery. Followed by yellowfin tuna (30-35%) (Naeem and Latheefa 1995;
Shainee and Leira 2011).
2.3 Issues related to aFADs 2.3.1 Impacts to the ecosystem
Not only aFADs, but also any artificial habitats may alter local marine ecosystem. Several studies indicated that if aFADs are anchored at greater distances from the coast, might also attract tunas swimming offshore (Marsac et al.1996). This kind of impact is also reported for birds. It was reported that marine renewable energy installations that is similarly constructed in the ocean like aFADs give a risk of collision, disturbance, displacement, and so on to marine bird (Grecian et al. 2010). Apart from, migration/movement of animals, aFADs may change biomass of certain species in the ecosystem.
Impacts of aFADs to the ecosystems depend on cases as: 1. aFADs only redistribute the exploitable biomass without increasing stock size, 2. aFADs increase exploitable biomass without increasing stock size, and 3. aFADs increase both exploitable biomass and stock size according to (Polovina 2013). It is
29
difficult to identify the case, but these cases except the impact is dependable on the local marine ecosystem available biomass (e.g. catch) and stock changes in the system.
Since aFADs are deployed to create new habitats for commercial species, diet of the associated fish sometimes become different from fish in common habitats. Fonteneau (1997) suggested that free- school tunas mostly occur in rich-food area, while aFAD locations are mainly not chosen by such criteria. As a result, differences in empty stomach rate, diet diversity and consequently growth of skipjack and yellowfin tuna was reported in the western Indian Ocean (Jaquemet et al. 2011).
2.3.2 Over-exploitation
While aFADs can displace fishing effort from existing fishing grounds to others, there are concerns that pelagic species that aggregate around FADs (both dFADs and aFADs) can easily be over exploited. In general, FADs merely concentrate fish in one localized area, making them easier to catch (Beverly et al. 2012). In addition, aFADs increase catch and its consistency thus enhance food security, and reduce search time and operating costs for fishers that the fishing effort will concentrate to aFADs.
Massive capture of fecund individuals or spawning stock, that are major target species around aFADs are considered to results in recruitment overfishing (Fonteneau et al. 2000b) and this has been reported in Philippines for example(Floyd and Pauly 1984). Therefore, aFADs accelerate fisheries collapse when the fishery is already overfished (Cabral et al. 2014). Although fishing capacities for dFADs and aFADs users are different (e.g. industrial purse seine and artisanal fishers), aFADs deployment in most cases is aimed to reallocate fishing effort in the region, in the process over-exploited cases could be possible (Grossman et al. 1997). Arrangement of aFADs array is proposed in some areas (Beverly et al. 2012; Dagorn et al. 2007) for efficient use of the array of aFADs and to allocate fishing efforts, but the diversity of target species and gear types would make it difficult to determine the optimal number and density of aFADs for any given area (Taquet 2011). Besides, this will not solve the over- exploitation issue because it would only redistribute fish stocks in the area. Fishing capacity control (FAO, 2009) is necessary for sustainable use of aFADs. To achieve this, collection of high-quality data at certain level and monitoring protocols are required (Beverly et al. 2012). Recently a new idea has been introduced on the use of aFADs as Fish Enhancing Devices (FEDs) for small-scale and artisanal fisheries that are deployed in the banned water or fisheries under strong regulations (Cabral et al. 2014).
2. 3.3 Bycatch
Issue on bycatch of juveniles and other endangered species associated with aFADs is being observed in different countries. In the Philippines, fishing operations take place all year-round, there has been claims that payaos tend to selectively attract juveniles and are therefore detrimental to the