Development and Application of
Noncontact Near-Infrared Spectroscopy System for Measuring Biological Tissue
August 2012
A thesis submitted in partial fulfillment of the requirements for the degree of Doctor of Philosophy in Engineering
Keio University
Graduate School of Science and Technology School of Integrated Design Engineering
Funane, Tsukasa
Abstract
The in vivo application of near-infrared spectroscopy (NIRS) for brain-activity measurements was first described by Jöbsis in 1977. Over the past 35 years, this technique has been developed as a useful tool for the clinical monitoring of tissue oxygenation, for neuroimaging studies, and for the measurement of tissue structures.
The NIRS system for detecting the absorption change in deep biological tissues must currently use contact fiber-optic probes on the skin in order to avoid artifacts induced by direct skin-reflected light or tissue movement. On the other hand, noncontact NIRS imaging may have many promising applications such as for monitoring the biological state of drivers and sleeping people. The purpose of this thesis is the development and application of a noncontact NIRS system.
To establish a noncontact NIRS system for the measurement of deep biological tissues, a noncontact brain activity measurement system using a phosphor which is excited by and emits near-infrared light was developed. To optimize and validate this system, the influence of the fluorescence lifetime on the amplitude of the lock-in detection was investigated to determine the optimal frequency of the light source’s intensity modulation. The sensitivity of the system to the internal absorbance change was estimated using a phantom measurement. To clearly show that this system can detect the absorbance changes in the cerebral blood instead of those in the superficial regions, the hemoglobin changes in the same area of the prefrontal cortex were measured during a working memory task by simultaneously using this system and a conventional contact optical topography system. The precision of the system was also evaluated.
As an example of promising applications, the noncontact system was extended to
a system with flexible source positions using a galvano scanner. An 808-nm laser,
whose focal point on the surface of the biological tissue is controlled by the galvano
scanner, is used as the light source. The system is used to measure twenty points on
the tissue surface at which the source-detector (S-D) distances are 7–45 mm (with
The system was validated by using it to measure the absorption change of an absorber (which is embedded in a deep layer of a tissue-simulating phantom) while the surface-layer thickness of the phantom was changed from 1 to 12 mm. It was demonstrated that both the relative absorption change of the absorber and the absolute thickness of the surface layer can be estimated from the measured optical-density change (ΔOD) and the dependence of the ΔOD on the S-D distance, respectively.
Combined with the multi-distance measurement, a dynamic phantom was developed for mimicking hemoglobin changes in the superficial and deep tissues, thus allowing us to experimentally validate the discrimination methods between the brain-scalp effects on the NIRS signal. In NIRS for monitoring brain activity and cerebral functional connectivity, the effect of the superficial tissue needs to be considered. Although some methods for determining the effect of scalp and brain have been proposed, direct validation of the methods has been difficult because the actual absorption changes are not known. In response to this problem, a dynamic phantom with two absorber layers that are independently driven by two one-axis automatic stages was developed. The phantom can be used to design any type of waveform (e.g., brain activity or systemic fluctuation) of an absorption change, which can then be reproducibly measured. To determine the effectiveness of the phantom, I used it for a multiple source-detector distance measurement. The performance of a subtraction method with a short-distance regressor was also investigated. The most accurate lower-layer change was obtained when a shortest-distance channel was used.
Furthermore, when an independent component analysis was applied to the same data, the extracted components were in good agreement with the actual signals. These results demonstrated that the proposed phantom can be used for evaluating the methods of discriminating the effects of superficial tissue.
Next, a noncontact optical scanning system was used for human biological tissue
measurements. First, the measurement of the forearm during an ischema test, and
second, the measurement of the forehead while performing a working memory task
are described. The measurement results showed that the developed scanning system
can be successfully used for human tissue measurement.
Finally, I discuss the future prospects of the noncontact NIRS system and
promising application. The technique should be valuable, especially for the S-D
distance optimization during the initial measurement of muscle tissue, the tissue
thickness determination for a layered tissue structure, fast and high density deep tissue
imager using an infrared CCD camera, and pressure-free long term measurement
during sleep.
Contents
1. Introduction --- 1
1.1. NIRS for biological tissue measurement ··· 1
1.1.1. Principle of brain activity measurement with NIRS ··· 1
1.1.2. Applications of NIRS ··· 3
1.1.3. Limitations of NIRS and advantage of noncontact NIRS system ··· 5
1.2. Review of noncontact NIRS system ··· 6
1.2.1. Transmission DOT ··· 7
1.2.2. Reflection DOT ··· 10
1.3. Review of phantom development ··· 14
1.3.1. Static phantom ··· 14
1.3.2. Dynamic phantom ··· 15
1.4. Review of multi-distance NIRS measurement ··· 18
1.4.1. Removal of surface-layer effects ··· 18
1.4.2. Spatially resolved spectroscopy (SRS) ··· 20
1.5. Purpose of this thesis ··· 21
2. Noncontact measurement system --- 23
2.1. Principle of noncontact NIRS system ··· 23
2.1.1. Theoretical efficiency of phosphor measurement ··· 26
2.1.2. Phosphor selection ··· 27
2.1.3. Excitation and emission spectrum of phosphor ··· 28
2.1.4. Effect of fluorescence lifetime ··· 32
2.1.5. Effect of detection focal spot diameter ··· 35
2.1.6. Effect of phosphor use ··· 38
2.2. Phantom measurement··· 40
2.2.1. Methods of phantom measurement ··· 40
2.2.2. Results of phantom measurement ··· 43
2.3. Human brain activity measurement ··· 44
2.3.1. Participant ··· 44
2.3.2. Measurement system ··· 44
2.3.3. Cognitive task for brain activation ··· 48
2.3.4. Analysis of human brain activity measurement ··· 49
2.3.5. Results of human brain activity measurement ··· 50
2.4. Comparison with conventional NIRS system ··· 53
2.5. Evaluation of precision ··· 55
2.6. Benefits of noncontact system ··· 56
2.7. Summary of the developed system ··· 57
3. Optical scanning system --- 59
3.1. Introduction ··· 59
3.2. System description ··· 61
3.3. Static phantom with one-layer absorber ··· 66
3.4. Measurement of tissue-simulating phantom ··· 70
3.4.1. S-D distance dependence of optical-density change ···· 70
3.4.2. Effect of stray light ··· 72
3.4.3. Estimation of surface-layer thickness ··· 74
4. Evaluation of surface layer effect discrimination method --- 77
4.1. Introduction ··· 77
4.2. Design of dynamic phantom ··· 80
4.2.1. Material and structure of phantom ··· 80
4.2.2. Driving mechanism of absorbers ··· 83
4.3. Measurement system ··· 85
4.4. Calibration of dynamic phantom ··· 87
4.4.1. Calibration method ··· 87
4.4.2. Relationship between stage position and ΔOD ··· 87
4.4.3. Comparison with results by Monte Carlo simulation ··· 90
4.5. Evaluation of multi-distance analytical methods by dynamic phantom ··· 94
4.5.1. Synthesis of waveforms··· 94
4.5.2. Extraction of deep-layer signal with subtraction method ··· 95
4.5.3. Performance evaluation of subtraction method ··· 97
4.5.4. Signal discrimination with ICA ··· 103
4.5.5. Performance evaluation of ICA method ··· 104
4.6. Summary ··· 107
5. Application of noncontact optical scanning system to human tissue measurement --- 108
5.1. Human muscle measurement ··· 108
5.1.1. Participant ··· 108
5.1.2. Experimental setup ··· 108
5.1.3. Results and discussion ··· 109
5.2. Human brain-activity measurement ··· 111
5.2.1. Participant ··· 111
5.2.2. Experimental setup ··· 111
5.2.3. Results and discussion ··· 115
5.3. Summary ··· 119
6. Conclusion --- 120
6.1. Summary of results and their relationships ··· 120
6.2. Perspective for the future ··· 122
References --- 125
Acknowledgments --- 141
List of publications --- 144
Appendix --- 147
Calculation of Hb change by modified
Beer-Lambert law ··· 147
Monte Carlo simulation ··· 150
List of acronyms ··· 152
Chapter 1 1. Introduction
1.1. NIRS for biological tissue measurement
1.1.1. Principle of brain activity measurement with NIRS
Near-infrared spectroscopy (NIRS) has been used to measure brain functions noninvasively by monitoring cerebral blood changes (Brazy et al., 1985; Chance et al., 1993; Hoshi and Tamura, 1993; Jöbsis, 1977; Kato et al., 1993; Rea et al., 1985;
Villringer et al., 1993; Wyatt et al., 1986). The NIRS system radiates weak visible or near-infrared light into the head and detects the transmitted light. This technique has been applied to an optical topography (OT) system that obtains images of brain function with multiple light sources and detectors (Koizumi et al., 1999; Maki et al., 1995; Yamashita et al., 1996). NIRS has also been applied for clinical use such as psychiatric diagnosis (Kameyama et al., 2006; Suto et al., 2004) or preoperative diagnosis in epilepsy treatment (Watanabe et al., 1998; Watanabe et al., 2000).
Furthermore, it has been used for measuring oxygen saturation in skeletal muscle
(Boushel and Piantadosi, 2000; Feng et al., 2001; Ferrari et al., 1997; van Beekvelt et
al., 2001), in particular, during exercise (Perrey, 2008; Quaresima et al., 2003). In
sports medicine, NIRS has been used to investigate the metabolism of skeletal muscle
by measuring the oxygenation of hemoglobin (Hb) and myoglobin (Boushel and
Piantadosi, 2000; Ferrari et al., 1997; Quaresima et al., 2003).
OT systems have near-infrared laser diodes with two or more wavelengths, for example, 695 and 830 nm, and light detectors such as avalanche photodiodes or photomultiplier tubes. The wavelengths used in OT systems are usually between 690 and 900 nm (a range in which transmittance in biological tissue is high). This system measures hemoglobin change, in particular, the change in the product of Hb concentration (C, unit: mM = mmol/L) and effective optical path length (L, unit: mm) [Δ(C × L) or more simply, ΔCL, unit: mM·mm], of biological tissue when continuous-wave (CW) light is used. Topographical images of brain activation can be obtained with multiple light sources and detectors placed in a two-dimensional (2D) lattice arrangement. Irradiation lights are intensity-modulated with a different frequency at each light source for the signal discrimination with lock-in detection. Fig.
1 shows the measurement principle with respect to photon propagation in human head tissue. Both oxygenated and deoxygenated Hb changes in the cerebral cortex lead to change in the intensity of detection light.
Skin Skull
Cerebral cortex Irradiation
light
Activation area Detection light
Fig. 1 Measurement principle with respect to photon propagation in human head
tissue. The concentration change in blood of the cerebral cortex leads to change in the
intensity of detection light.
In analysis, the two types of Hb change, oxygenated (oxy-) and deoxygenated (deoxy-), are calculated using two different absorption-coefficient spectra and the detected signals of two or more wavelengths according to the modified Beer–Lambert law (Maki et al., 1995; Delpy et al., 1988), which expresses the relationship between light attenuation and the concentration of the absorber in a light-scattering medium such as the living body. The original Beer–Lambert law can be applied only to a nonscattering medium. The detailed methodology including the formulas for Hb-change calculation is described in Appendix section.
Figure 2 shows extinction coefficients (ε) and absorption coefficients (a) of biological substances such as oxy- and deoxy-Hb (Matcher et al., 1995a), cytochrome oxidase (cyt-ox) (Matcher et al., 1995a), and water (Kou et al., 1993). In most studies using NIRS imaging, two types of hemoglobin are the objects being measured, while cytochrome oxidase and water content are assumed to be constant in a short measurement period.
1.1.2. Applications of NIRS
In the NIRS technique, the changes in two or more types of chromospheres, such as
oxy- and deoxy-Hb, are usually calculated using absorbance change at two or more
wavelengths (see Appendix section). In humans, the time series data of Hb change is
very useful as a vital sign. Besides, the NIRS technique is valuable because blood
volume change and tissue metabolism can be noninvasively monitored by small
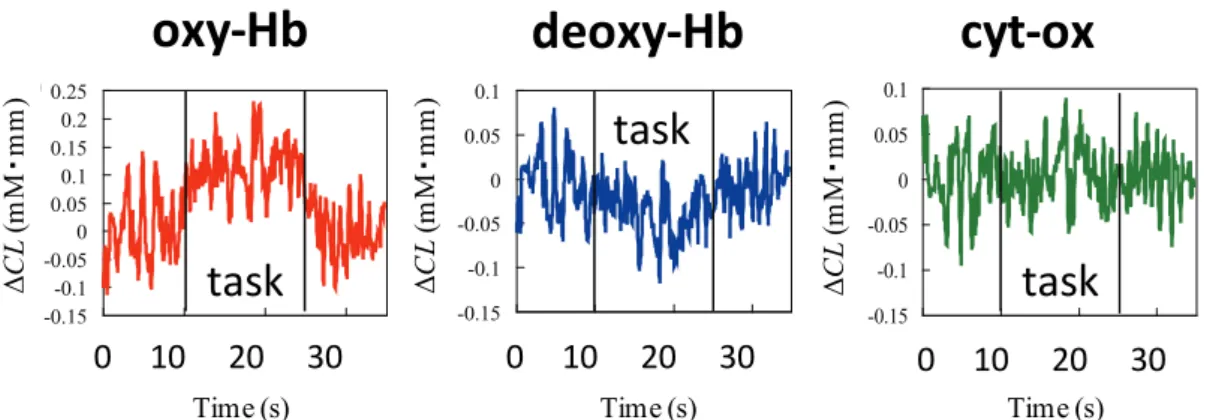
equipment. Examples of time series of changes in oxy-Hb, deoxy-Hb, and oxidized
cytochrome oxidase obtained in the occipital area of the head during performance of a
visual task are shown in Fig. 3 (adapted from Funane et al., 2009a).
0 0.1 0.2 0.3 0.4 0.5
(b)
0.6650 750 850 950 1050 1150 1250 1350
Wavelength (nm) aoxy
adeoxy
acyt
awater
(50 μM) (50 μM) (5 μM) (70%) 0
0.1 0.2 0.3 0.4
(a)
0.5650 700 750 800 850 900
Wavelength (nm)
εoxy
εdeoxy
εcyt
Extinction coefficient (mM−1·mm−1)Absorption coefficient (cm−1)
Fig. 2 (a) Extinction coefficient (ε) of oxy- and deoxy-Hb, and cytochrome oxidase (difference between oxy and deoxy ones); (b) absorption coefficient (a) of oxy- and deoxy-Hb, cytochrome oxidase (difference between oxy and deoxy ones), and water.
These values are common-logarithm based.
-0.15 -0.1 -0.05 0 0.05 0.1 0.15 0.2 0.25
0 10 20 30
Time [sec]
ΔCL[mMmm]
-0.15 -0.1 -0.05 0 0.05 0.1
0 10 20 30
Time [sec]
ΔCL[mMmm]
-0.15 -0.1 -0.05 0 0.05 0.1
Time [sec]
ΔCL[mMmm]
0 10 20 30
(B)
oxy‐Hb deoxy‐Hb cyt‐ox
0 10 20 30 0 10 20 30 0 10 20 30
task
task
task
ΔCL(mM・mm)
Time (s)
ΔCL(mM・mm) ΔCL(mM・mm)
Time (s) Time (s)
Fig. 3 Examples of time series of oxy-Hb, deoxy-Hb, and oxidized cytochrome
oxidase (adapted from Funane et al., 2009a).
With these valuable parameters such as oxy- and deoxy-Hb change, NIRS or OT techniques have been widely used for research and clinical purposes (Koizumi et al., 1999; Maki et al., 1995; Obata et al., 2003; Obata et al., 2005; Sato et al., 1999; Taga et al., 2000; Watanabe et al., 1998) because of its noninvasiveness and few constraints (Ito et al., 2000; Kiguchi et al., 2007).
NIRS especially has advantages for the study of neurophysiology and development of language function in the brain because an NIRS system is very silent, providing a good setting for language studies, whereas functional magnetic resonance imaging (fMRI) systems make noise (Fuchino et al., 2006). Children and even infants can be tested while awake (Taga et al., 2000; Taga et al., 2003).
A recently developed wearable OT system (Atsumori et al., 2007; Atsumori et al., 2009; Atsumori et al., 2010; Kiguchi et al., 2012) is an effective tool for the study of brain activity in natural situations (Suda et al., 2010) such as face-to-face communications (Funane et al., 2011), walking (Atsumori et al., 2010), driving (Harada et al., 2007; Tomioka et al., 2009), and riding in moving vehicles (Krüger et al., 2012).
Application of NIRS is expanding as a brain-computer interface (BCI) (Utsugi et al., 2008), as the evaluation of cooperation (Funane et al., 2011; Cui et al, 2012), and for between-brain connectivity (Holper et al., 2012).
1.1.3. Limitations of NIRS and advantage of noncontact NIRS system
While NIRS has found a variety of applications and has many advantages over other neuroimaging modalities such as fMRI, PET, and EEG, it has several limitations (Koizumi et al., 2003; Hoshi, 2007; Hoshi, 2011), such as the quantification of NIRS data and influence of extracerebral tissue that has been recently reported by many researchers.
While these limitations should be addressed and investigated further, the
limitation focused herein is the probe arrangement of NIRS, or the system-human
interface restriction by contact probes of the NIRS system. In an NIRS system, the light sources and detectors or light guides/fibers are usually attached to the skin so that the light detectors catch the light that propagates in the tissue rather than skin-reflected light or stray light. If the light source and detector are not in contact with the skin, the detector would certainly catch skin-reflected light or stray light as noise; however, the intensity of such noise is much higher than that of tissue-propagated light because the intensity of the tissue-propagated light is approximately 10
−7–10
−9times as high as that of the incident light (Okada et al., 1997).
Consequently, the signal-to-noise ratio (SNR) deteriorates. Owing to this SNR reduction, the noncontact measurement of changes in cerebral blood volume is difficult. If the SNR reduction is avoided, a noncontact system would provide more degrees of freedom (with respect to both the system and subject) and enable new applications of brain activity measurement such as sleep research and other long-term brain monitoring.
If charge-coupled device (CCD) or complementary metal-oxide semiconductor (CMOS) imaging sensors are used for detectors, large amounts of data can be effectively and quickly obtained, and the effect of motions by the subject could be corrected in the image processing analysis.
1.2. Review of noncontact NIRS system
To overcome several limitations of NIRS as stated above, several researchers have recently reported noncontact optical measurement systems for the application of diffuse optical tomography (DOT) and brain activity measurement (Sase et al., 2006;
Schulz et al., 2003; Turner et al., 2005; Wang et al., 2005; Konecky et al., 2008).
These studies can be divided into two categories: 1) transmission DOT and 2) reflection DOT.
A transmission DOT system has an optical emitter and detector that are located on
opposite sides, sandwiching the sample. A reflection DOT system has an optical
emitter and detector that are located on the same side, against the sample. Some
literature on these two systems is described in the following section.
1.2.1. Transmission DOT
Schulz et al. (2003) reported a noncontact optical tomography system using CCD cameras for tomographic image reconstruction and three-dimensional (3D) surface extraction (Fig. 4). This noncontact transmission DOT system is only applicable to objects in a chamber such as in vitro biological tissue and small animals, and therefore, it is difficult to apply it to in vivo reflection-mode measurements such as for human brain activity and human muscle oxygenation.
Camera
PC
Imaging chamber
Optical switch
Laser
Ph an to m
Optical
fiber Light Timing signal
Data
Data
Fig. 4 Experimental setup of noncontact optical tomography system with
transmission (projection) arrangement (adapted from Schulz et al., 2003). The 3D
surface was captured with a 3D camera to be simultaneously recorded as well as
reconstructed in a 3D tomographic image.
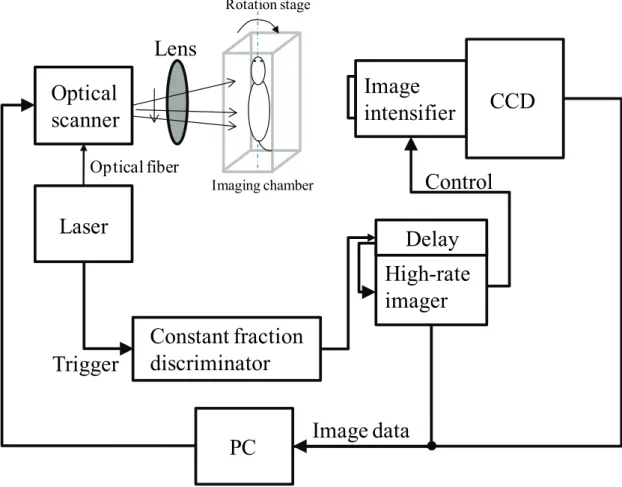
Turner et al. (2005) reported a transmission DOT system using early-arriving photons (Fig. 5). The developed scanning system and CCD image sensor allow the noncontact measurement of biological tissue and high spatial sampling of transmitted photons. Reconstruction algorithms that are similar to those used for x-ray computed tomography can be applied. Imaging is based on a complete-angle projection tomographic technique that utilizes early transmitted photons. The system is available only for optically thin samples, and therefore, cannot be used for breast or brain imaging because sufficient signal cannot be obtained when it penetrates through a thick light-absorbing tissue. It is a promising technique for future fluorescence molecular tomography studies of small animals.
Imaging chamber
Optical scanner
Laser
Image
intensifier CCD
High-rate imager
Delay
Constant fraction discriminator Trigger
Optical fiber
Rotation stage
PC Lens
Control
Image data
Fig. 5 Experimental setup of a time-resolved system using noncontact geometry
(adapted from Turner et al., 2005).
Wang et al. (2005) reported an experimental demonstration of an analytical method for image reconstruction in optical diffusion tomography with large data sets (Fig. 6). A power meter is used to monitor the stability of the light source. The incident beam is scanned with an optical scanner. After propagating through the sample, the transmitted light passes through a band-pass interference filter and is imaged onto a front-illuminated, thermoelectrically cooled 16-bit CCD array. In their noncontact DOT system, data obtained at 10
8source-detector pairs were employed to reconstruct the optical absorption of a highly scattering medium containing absorbing inhomogeneities. In an experiment, two absorbing black metal balls suspended in a liquid phantom (1% intralipid water) were successfully reconstructed by large data sets. The data were obtained by scanning the incident beam with galvanometer-controlled mirrors.
Optical scanner
Laser CCD
Shutter controller
PC
Filter Phantom
Absorber
Shutter
Lens Power meter
Pulse generator Beam splitter
Control
Trigger
Tr ig ge r
Data
Fig. 6 Experimental setup of a noncontact optical tomography system (adapted from
Wang et al., 2005).
1.2.2. Reflection DOT
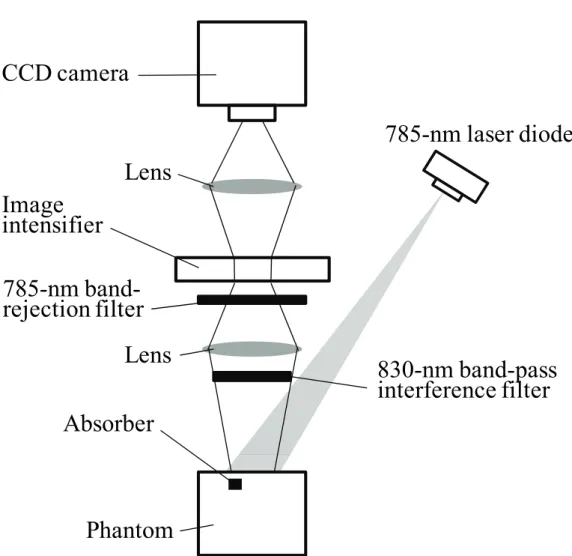
Thompson et al. (2003) and Roy et al. (2005) reported a noncontact reflection-mode 2D and 3D, respectively, fluorescence imaging system using an intensified charge-coupled device (ICCD) camera with a 830-nm band-pass filter and a 785-nm band-rejection filter (Fig. 7). They used a tissue phantom with an indocyanine green (ICG) absorber that absorbs 780-nm light and emits 830-nm light (Mayer et al., 1999).
In addition, they used optical filters to reject directly reflected light on the tissue surface and extracted the position of the fluorescent target.
CCD camera
Lens Image
intensifier 785-nm band- rejection filter
Lens 830-nm band-pass
interference filter 785-nm laser diode
Phantom Absorber
Fig. 7 Schematic of noncontact acquisition of fluorescence with ICCD camera by
the illumination of plane light wave (adapted from Thompson et al., 2003; Roy et al.,
2005).
Sase et al. (2006) developed a noncontact reflection-mode optical imaging system based on time-resolved imaging for applications of human brain activity measurement (Fig. 8). In their study, to cut backscattered light from the superficial area, the system uses a CCD camera equipped with an image intensifier having a time gate set to prevent photons that arrive earlier than specified from being captured.
A tissue-simulating phantom with a few small absorbers is measured by the system, and reconstructed absorbers were located on the same position as the true absorber position. In the analysis of reconstruction, the captured image without absorbers in the phantom was subtracted from that with absorbers.
Sawosz et al. (2010) reported an imaging system for brain oxygenation based on a time-gated, intensified CCD camera. It was demonstrated that the system reconstructed the position of the absorber in a phantom by on-off switching of nine light sources arranged in a circle on the phantom surface. Furthermore, in vivo human brain activity measurement, with two subjects, was performed at the position of C4 in accordance with the International 10-20 system (Jasper, 1958) during a finger-tapping task.
Oscilloscope
Pump laser Optical fiber
switcher
Ti-sapphire 780 nm Ti-sapphire 830 nm
Lock-to-clock PD
PD Condensing
lens
Time-resolved intensifier with camera
Mirror
Halfmirror Fiber
Sample
Objective lens
Fibers
PC
Lens Image data
Trigger for Image capture Switching signal
Trigger for high voltage
ND
Fig. 8 Block diagram of noncontact system (adapted from Sase et al., 2006). ND
denotes neutral density filter and PD denotes photodiode. Oscilloscope is used for
monitoring PD signals.
Niwayama et al. (2006; 2007) reported that in vivo measurements of deep tissue absorption change in the human forearm were performed with a noncontact optical system (Fig. 9). They measured the muscle tissue of the human forearm during upper-arm occlusion with an ischemia test. The corrected oxygen consumption rate was obtained by considering the thickness of the fat layer.
Furthermore, Mazurenka et al. (2012) reported a noncontact system with null source-detector (S-D) distances based on time-domain NIRS utilizing a fast-gated single photon counting detector (Fig. 10). Radiation from a supercontinuum laser coupled to an acousto-optical tunable filter was used as a light source. To detect diffusively scattered photons as well as to suppress the directly reflected or minimally scattered photons, a polarization selective detection was implemented even though
~50% signal loss would occur. The detection system consists of a polarizer and a polarizing cube beam splitter. The polarizer serves to clean up the linear polarization of the incident light after an acousto-optical tunable filter. The polarizing cube beamsplitter is aligned to reflect the linearly polarized light coming from the acousto-optical tunable filter and the polarizer to a pair of image transfer lenses, focusing on the surface of the sample. Because light scattered by turbid media or biological tissues is randomly polarized, half of it, polarized perpendicularly to the incident light, passes through the polarizing cube beamsplitter and can be detected by a gated single-photon avalanche diode. Proof-of-principle tests were conducted, and the measured depth sensitivity and spatial resolution of this system were close to the values predicted by Monte Carlo simulations.
However, in vivo human brain activity measurement based on a noncontact NIRS
system had not been reported until I reported (Funane et al., 2010) because there were
several problems as follows: 1) the signal-to-noise ratio is low when reflection DOT
without phosphor material is applied to human tissue measurement, 2) optical power
should be low because of laser safety, and 3) the time-resolved spectroscopy
measurement system is a rather large and expensive system that would be very
difficult to miniaturize.
LED driver
MPX Amp.
PIO A/D D/A
PC CRT
Tissue LED (770, 830 nm)
PD
Stage
20 m m
Movable
System main body Probe
Fig. 9 Diagram of noncontact tissue oximeter. PD: photodiode, MPX: multiplexer, PIO: parallel input output (adapted from Niwayama et al, 2006; Niwayama et al., 2007).
PC
Sync
Delay generator
Ultra fast pulser
Supercontinuum
laser Variable
attenuator Acousto-optical
tunable filter
Phantom Single photon
counting card
Single-photon Avalanche diode Gate trigger
Beam splitter Polarizer
Lens Half mirror
Fig. 10 Schematic of the noncontact brain scanning imaging system (adapted from
Mazurenka et al., 2012).
1.3. Review of phantom development
1.3.1. Static phantom
The use of tissue-simulating objects to mimic the properties of human or animal tissues has been required for the development of biological imaging systems such as OT, DOT, sonography, X-ray CT, and MRI. These so-called “phantoms” are usually used for the following purposes (Pogue and Patterson, 2006):
1. Testing and evaluating system designs
2. Maximizing signal-to-noise ratio of obtained data by systems 3. Evaluating methodology of analysis and simulation
4. Comparing performance between systems
For evaluating NIRS instruments, many studies on phantom developments and phantom-based approaches have been reported (Delpy et al., 1988; Farrel et al., 1992;
Firbank and Delpy, 1993; Patterson et al., 1989; Pogue and Patterson, 2006). To generate conventional phantoms for NIRS measurement, the photon-absorbing materials are made by mixing epoxy resin and hardener (Firbank et al., 1995). To control the absorption coefficient of the absorbers, an infrared dye is mixed into the absorber materials. To control the reduced scattering coefficient of the absorbers, titanium dioxide is mixed into the absorbers.
A static phantom (Firbank and Delpy, 1993; Firbank et al., 1995), however,
cannot simulate time varying signals representing absorption changes that occur in
actual biological tissues. Therefore, static phantoms cannot be used for evaluating
time-domain analytical methods such as correlation analysis, principal component
analysis, and independent component analysis. To materialize a more realistic
phantom similar to biological tissue and provide evaluating time-domain methods, a
dynamic phantom that can temporally change its optical properties is necessary.
1.3.2. Dynamic phantom
Kurth et al. (1995) reported a dynamic phantom that simulates neonatal brain for testing NIRS instruments. The brain model was made of a solid plastic structure containing a simulated vascular network perfused with blood equilibrated with O
2, N
2, and CO
2in a closed circuit (Fig. 11). The potential utility of the dynamic phantom brain for testing NIRS instruments for accuracy and reliability was demonstrated.
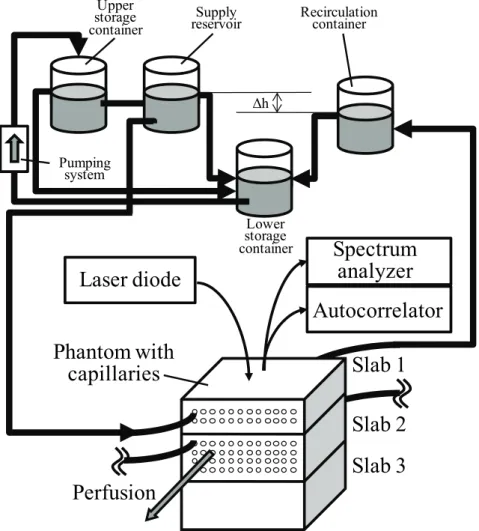
Lohwasser and Soelkner (1999) reported a layered phantom for the human head consisting of a regular array of capillaries embedded in an epoxy matrix with tissue-like scattering and absorption properties for laser-Doppler flow measurements (Fig. 12). Capillaries were made by implanting nylon strings when the epoxy was malleable and removing them after the epoxy had solidified. To reproduce Doppler frequency spectra of biological tissue, diluted milk was pumped with compressed air.
Constant fluid velocity was established with a height difference between the fluid levels in the supply and recirculation containers.
Roller pump NIRS
Oxygenator reservoir Phantom
brain
Circulating water bath CO
2N
2O
2Flow meter Light
guides
Liquid flow
Fig. 11 Schematic diagram of blood-perfusion dynamic phantom (adapted from
Kurth et al., 1995).
Laser diode
Spectrum analyzer Autocorrelator
Perfusion
Slab 1 Slab 2 Slab 3
Lower storage container
Δh Upper
storage container
Supply
reservoir Recirculation container
Pumping system
Phantom with capillaries
Fig. 12 Schematic of the liquid circuit for perfusing phantom for laser-Doppler flowmetry instruments (adapted from Lohwasser and Soelkner, 1999). Slab denotes a block consisting of a thick piece of tissue-simulating material. Slabs 1, 2, and 3 simulate each layer of the human head such as epidermis and dermis (Slab 1); skull, cerebrospinal fluid (CSF), and perfused cortex (Slabs 1 and 2); and nonperfused cortex (Slab 3).
Kim and Liu (2008) reported dynamic tumor vascular phantoms to investigate biphasic tumor oxygen dynamics induced by hyperoxic gas intervention. Driven by syringe pumps, ink solution flow was injected in plastic tubing embedded in a gelatin phantom. Several types of optical-density change (ΔOD) time series were generated by changing the position of ink flow and flow velocity (Fig. 13).
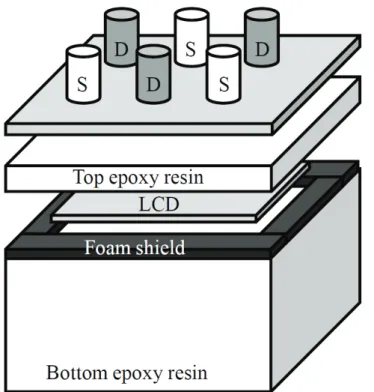
Koh et al. (2009) reported a dynamic phantom that consists of a modified liquid
crystal display (LCD) sandwiched between two layers of tissue simulated by epoxy
resin (Fig. 14). LCD enables flexible and rapid changes in attenuation across different
regions of the phantom. The effect of size and shape of the attenuator region on
detected intensity was investigated. It can be used as a calibration tool for NIRS imaging systems.
A dynamic phantom that generates any waveform of absorption has not been realized because conventional dynamic phantoms are based on liquid perfusion or two-state control.
Syringe pumps
Light source Detector
Detector Detector
Waste beaker Phantom
Fig. 13 Experimental setup for the tumor dynamic phantom study (adapted from Kim and Liu, 2008).
Fig. 14 Schematic of dynamic phantom with an LCD attenuator. S: source, D:
detector (adapted from Koh et al., 2009).
1.4. Review of multi-distance NIRS measurement
1.4.1. Removal of surface-layer effects
NIRS is very sensitive to the superficial layers of the head because it is a back-reflection measurement. Therefore, the NIRS signal obtained during the performance of cognitive tasks is strongly contaminated by systemic interference of superficial origin. Several approaches based on a multi-distance method are proposed to overcome this problem. Figure 15 shows conventional cross-sectional photon paths in a multi-distance arrangement.
In the method used by Toronov et al. (2001) and Saager and Berger (2005), the deep-tissue signal is extracted by linearly fitting the short-distance channel to the long-distance channel by the least-mean-squares method and subtracting the fitted signal from the long-distance channel. The evaluation function E is defined as the square sum of the linear subtraction of the short-distance channel from the long-distance channel in the following equation.
Scalp (Skin) Skull
Gray matter White matter
Detector Source
CSF
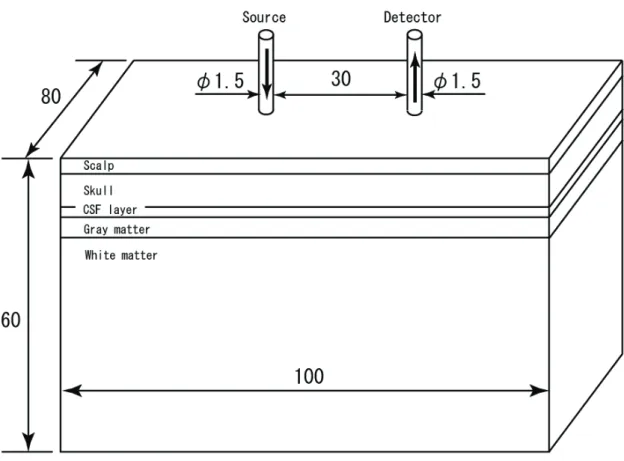
30 mm 15 mm 5 mm
Fig. 15 Cross-sectional photon paths in a multi-distance arrangement.
[ ]
∑ Δ − Δ +
=
t
b t OD a t OD
E
long( ) (
short( ) )
2, (1)
where t denotes time, ΔOD
shortdenotes optical density change (ΔOD) at short S-D distance, ΔOD
longdenotes ΔOD at long S-D distance, and a and b denote constant values. ΔOD is a dimensionless variable. After determining constant values (a and b) that minimize E, the fitted signal (ΔOD
fit) expressed as Eq.(2) is calculated.
b OD a
OD = Δ +
Δ
fit short(2)
By subtracting ΔOD
fitfrom ΔOD
long, the deep-tissue signal (ΔOD
deep) is obtained as:
fit long
deep
OD OD
OD = Δ − Δ
Δ (3)
To calculate a and b on line, Zhang et al. (2007a; 2007b; 2009) reported adaptive filtering to reduce global interference such as systemic fluctuations in evoked brain activity detection induced by some cognitive tasks. In an adaptive filtering algorithm, using past M data points and filter coefficients w , the deep-tissue signal (ΔOD
deep) is determined by Eq. (4).
[ ]
∑
=− Δ
− Δ
=
Δ
Mk i
k
OD i k
w i
OD i
OD
0
short ,
long
deep
( ) ( ) ( )
.(4)
The filter coefficients are sequentially determined using ΔOD
deepin Eq. (5).
) ( )
(
2
deep short, 1
,
w OD i OD i k
w
ki+=
ki+ μ Δ Δ −
,(5)
where the constant μ is the step size that controls the convergence rate of iterative
calculations.
Gagnon et al. (2011) reported a Kalman filtering method for the removal of systemic interference in superficial layers. Moreover, it has been reported that the general linear model (GLM) method (Aqil et al., 2012), principal component analysis, or independent component analysis (Funane et al., 2011d) is effectively combined with multi-distance NIRS data.
1.4.2. Spatially resolved spectroscopy (SRS)
Multi-distance NIRS measurement has also been used for the measurement of absolute values of absorption coefficient based on the spatially resolved spectroscopy (SRS) technique (Matcher et al., 1995b; Suzuki et al., 1999).
In the SRS method, the slope of absorbance values (∂A/dρ) obtained at multiple detection points is calculated (source-detector separation: ρ) (Fig. 16). Using ∂A/dρ, the product of absorption and reduced scattering coefficients of homogeneous scattering medium can be calculated by Eq. (6) based on photon diffusion theory (Patterson et al., 1989). If the reduced scattering coefficient is known, absolute absorption can be quantified.
∂A/dρ ρ
Homogeneous scattering medium Source Detectors
Fig. 16 Spatially resolved spectroscopy (adapted from Suzuki et al., 1999).
⎟⎟ ⎠
⎜⎜ ⎞
⎝
⎛ +
⋅
∂ =
∂
μ ρ ρ μ
' 2 10 3
ln 1
s a
A
,(6)
where μ
aand μ '
sdenote the absorption coefficient and reduced scattering coefficients of the tissue, respectively.
1.5. Purpose of this thesis
In this dissertation, I addressed a limitation of NIRS that contact probes are necessary and optimal source-detector (S-D) distance cannot be easily obtained. The purpose of this dissertation is the development of a noncontact NIRS system, validation of the proposed method, and demonstration for application to human muscle tissue and brain activity measurements.
As an introduction, Chapter 1 describes the principle, application, and challenges of the NIRS technique. Advantages of noncontact NIRS systems are also discussed in view of degrees of freedom with respect to both system and subject. In connection with this dissertation, literature on the noncontact NIRS technique, tissue-simulating phantoms, and methods using multiple S-D distance probes is reviewed.
Chapter 2 describes a noncontact measurement system. I propose a principle of noncontact NIRS system, and hemoglobin changes in a specific area of the prefrontal cortex are measured during a working memory task by simultaneously using this system and a conventional contact optical topography system. As a result, it was confirmed that the noncontact system measured human brain.
Chapter 3 describes an optical scanning system utilizing the noncontact NIRS technique. The system has a noncontact light emitter and detector with a galvano scanner and can measure the absorption change at variable S-D distances. A phantom with an inner absorber layer and a surface scattering layer whose thickness is changeable was measured by the system. The estimation of surface-layer thickness using optical density change at multiple S-D distances was demonstrated.
Chapter 4 describes the evaluation of the surface layer effect discrimination
method with multiple S-D distance measurements given by the optical scanning system. A dynamic phantom with two absorber layers that can be independently controlled was developed. Quantitative evaluation of a signal discrimination method was performed.
Chapter 5 describes application of the noncontact optical scanning system to human biological tissue measurement. The measurement of optical density change caused by blood volume change in the human forearm muscle during upper-arm occlusion and relief is described. The optical density change depending on S-D distance was obtained, which demonstrated the possibility that the optimal S-D distance for oxygenation monitoring on the human forearm can be determined by the scanning system. Furthermore, human brain activity was measured using the scanning system, and it was demonstrated that cerebral blood volume change was successfully extracted.
A summary of the work done and the conclusions drawn from it are given in
Chapter 6. A description of further work is also presented.
Chapter 2
2. Noncontact measurement system
2.1. Principle of noncontact NIRS system
In a conventional reflection-mode noncontact NIRS system mentioned in Section 1.2.2, cerebral blood change signal is detected by using photon’s time of flight (Fig.
17). Pulsed light source is used and time-resolved measurement is necessary, which mean the system should be large and expensive. Detection timing is time-gated and thus signal-to-noise ratio is theoretically low unless high peak power light source is used.
We proposed a new principle of a noncontact optical brain activity measurement system using phosphor placed on the scalp of the forehead of a subject, which requires less constraint, imposes no pressure on the skin, and is more comfortable for subjects being measured (Funane et al., 2010). The phosphor is excited only by tissue-propagated light (around 735 and 805 nm), and the emitted fluorescence (980 nm at peak) is detected by a light detector. The direct skin-reflected light and disturbance light are eliminated with optical filters placed on the phosphor and in front of the light detector (Fig. 18).
The intensity of fluorescence is proportional to that of the tissue-propagated light
that excites the phosphor if there is no fluorescence photobleaching. The changes in
the product of hemoglobin (Hb) concentration (C) and effective optical path length (L), called “Hb change [Δ(C×L)]” here, can therefore be calculated by the changes in the intensity of fluorescence.
The use of phosphor solved the problem of SNR loss induced by disturbance light and made it possible to do the measurements with an arrangement of noncontact light sources and detectors. For practical use, it is important to optimize system parameters and clearly show that the system can detect the absorption changes in deep tissue, especially in the blood volume of the cerebral cortex, instead of detecting the absorption changes in superficial layer such as scalp.
Pulse light
Tissue Air
Source Detector
Intensity time
Cerebral blood change
Photon B Photon A
Photon A Photon B
Time gate Time resolved monitor
Fig. 17 Conventional principle of noncontact NIRS system. To cut backscattered
light from the superficial area, the system incorporates a time gate set to prevent
photons (Photon A) that arrive earlier than specified from being captured. Only
photons (Photon B) that propagate in deep region where cerebral blood change occurs
are detected.
800 nm
Fluorescent materialOptical filter
980 nm
Window material
Tissue Air
Source
Detector
980 nm
30 mm
Cerebral blood change
Fig. 18 Newly proposed principle of noncontact NIRS system. A fluorescent material (phosphor) is placed on the tissue surface and emits fluorescence. Excitation light or stray lights are cut by optical filters. The phosphor is excited only by the light that propagates in deep regions of tissue and detector detects only fluorescence.
In this work, first, the relationship between fluorescence lifetime and the amplitude of lock-in detection was investigated to determine the intensity-modulation frequency. Second, a phantom (the absorption of which was adjustable in deep areas) was measured to show that the system with phosphor and optical filters improved the SNR of the absorption change in the deep area. Third, to confirm that the noncontact system could detect the change in the cerebral blood rather than in the skin blood, the same area of the human prefrontal cortex was measured by simultaneously using this noncontact system and a conventional contact NIRS system during a spatial working memory task. Finally, based on the data obtained in the human brain measurement, the precision of the system was evaluated.
To achieve a noncontact optical system for the measurement of biological tissue,
we used phosphor for wavelength conversion and optical filters to eliminate
unnecessary wavelengths of light. The measurable parameters are oxy- and deoxy-Hb
changes, which can be calculated with the change in absorbance of two wavelengths
in a way similar to that with OT systems. However, the wavelengths should be
selected from the range where phosphor can be excited. Because the fluorescence emitted from the phosphor has the same spectrum regardless of excitation wavelength, the detected signals cannot be discriminated by the emission wavelength, but can be discriminated by the lock-in detection with intensity-modulated light sources at different frequencies.
2.1.1. Theoretical efficiency of phosphor measurement
When several losses caused by the requirements of our noncontact system are taken into account, optical power P ( λ ) (unit: W) of detected fluorescence light at wavelength λ (unit: m) is theoretically expressed as the following equation:
, )]
( )
, ( [
)]
( [ ) ( )
( )
( = P
0⋅ T ⋅ A ⋅ T
2⋅ Ω ⋅ k ⋅ ∫ S x ⋅ S x dx
P λ λ
tissueλ
r filterλ
phosphorλ
detector(7)
where ) P
0( λ (unit: W) denotes optical power of irradiation light at the tissue surface, )
( λ
tissue
T (unit: m
-2sr
-1) denotes optical transmittance of tissue per unit detection area
and per unit solid angle, T
filter( λ ) (dimensionless variable) denotes optical
transmittance of optical filter, S
phosphor( λ
excitation, λ
emission) (dimensionless variable)
denotes fluorescence emission spectral density at wavelength λ
emission(unit: m)
excited by light of wavelength λ
excitation(unit: m), S
detector( λ
emission) (unit: m
-1)
denotes sensitivity spectral of detector device at wavelength λ
emission, A
r(unit: m
2)
denotes effective detection area, k denotes constant value, and Ω (unit: sr) denotes
solid angle. ∫ [ S
phosphor( λ , x ) ⋅ S
detector( x )] dx (dimensionless) represents effective
efficiency of the combination of phosphor and detector.
2.1.2. Phosphor selection
For the biological fluorescence imaging, a phosphor that is excited by and emits near-infrared light (around 700–1400 nm) that can easily penetrate in biological tissue (“biological optical window”) because below 700 nm hemoglobin absorption dominates, while above 1400 nm water absorption dominates. Table 1 shows the comparison of phosphors that can be excited by near-infrared light.
Indocyanine green (ICG) is often used for biological fluorescence imaging because it is an FDA-approved tricarbocyanine dye that is used typically for ophthalmic angiography studies and hepatic function studies. It has also been used as an absorption contrast agent for biological imaging (Sevick-Muraca et al., 1997).
3,3’-diethylthiatricarbocyanine iodide (DTTCI) is similar to ICG in its excitation and emission spectra, but is different in their fluorescence lifetime. Fluorescent decays of ICG and DTTCI are well described by single-exponential decay functions (Mayer et al., 1999). ICG and DTTCI are thus used for fluorescence lifetime tomography (Godavarty et al., 2005).
1.0Yb
2O
3–4.0Nd
2O
3–47.0Bi
2O
3–47.0B
2O
3–1.0Sb
2O
3has been reported as a near-infrared light source for optical coherence tomography (Fuchi et al., 2009).
LiNdP
4O
12and Li(Nd
0.9Yb
0.1)P
4O
12have been reported as typical phosphors for use in marking (Shionoya and Yen, 1998). For example, phosphor mark in data card can be quickly read by a phosphor reading apparatus. These kinds of system were used for postage stamps.
We selected Li(Nd
0.9Yb
0.1)P
4O
12(Shionoya and Yen, 1998; Suzuki et al., 1978;
Suzuki et al., 1979) as the phosphor used in our noncontact system because it has
enough discrete two excitation-wavelength bands (735 and 805 nm) for Hb
measurement and an emission-wavelength band (980 nm) where long-wavelength
type Si APD has a high sensitivity. The phosphor is an inorganic material; therefore,
fluorescence photobleaching does not generally occur with repeated excitation, so it
may be suitable for a long-term measurement.
Table 1 Comparison of phosphors that are excited by near-infrared light Phosphor Excitation
wavelength
Emission wavelength
Notes
ICG 780 nm 830 nm lifetime: 0.57 ns
(Mayer et al., 1999)
DTTCI 750 nm 830 nm lifetime: 1.3 ns
(Mayer et al., 1999)
1.0Yb
2O
3–4.0Nd
2O
3–47.0Bi
2O
3–47.0B
2O
3–1.0Sb
2O
3584, 748 nm 1014 nm Fuchi et al., 2009
LiNdP
4O
12735, 805 nm 1047 nm Shionoya and Yen, 1998
Li(Nd
0.9Yb
0.1)P
4O
12735, 805 nm 980, 1047 nm lifetime: 0.93 ms (Funane et al., 2011a)
2.1.3. Excitation and emission spectrum of phosphor
The excitation spectrum and the emission spectra of the phosphor were measured using a spectrofluorometer (Nanolog, Horiba Jobin Yvon, Japan). The transmittance spectrum of an indium phosphide (InP) wafer was measured using a spectrometer (USB4000, Ocean Optics, U.S.A.) with a tungsten halogen light source (LS-1, Ocean Optics, U.S.A.).
The excitation spectrum of the phosphor is shown in Fig. 19 (a). The horizontal
axis indicates the excitation wavelength, and the vertical axis indicates the emission
intensity. There are roughly two peaks (around 730 and 800 nm) in the excitation
spectrum of this phosphor. Therefore, light-wavelength ranges of 730–760 and 790–820 nm are suitable for excitation of the phosphor. Light in these wavelength ranges has good transmittance in biological tissue (Boas et al., 2004).
Figure 19 (b) shows the emission spectra of a phosphor excited with 733- and 800-nm light, the transmittance spectrum of an InP wafer, and the sensitivity of an avalanche photodiode (APD) used in this study. The horizontal axis represents the wavelength, the left vertical axis represents emission intensity, and the two right vertical axes represent the sensitivity of the APD and the transmittance of InP. The peak wavelength of the emission spectrum of this phosphor is 980 nm. InP wafers used as the optical filters in this study were undoped and double-side polished and had a thickness of 0.5 mm, an orientation of 100 ± 0.5°, and a peak transmittance at about 975 nm. A silicon APD with peak sensitivity at about 940 nm (S8890-30, Hamamatsu Photonics, Japan) was used as a light detector.
In consideration of the excitation spectrum of the phosphor stated above, a widely
available 808-nm laser diode (LD) was used for the phosphor excitation in the
phantom measurement, and 735- and 805-nm light-emitting diodes (LEDs) were used
in the human brain measurement.
0 10000 20000 30000 40000 50000 60000 70000 80000
700 725 750 775 800 825 850
Emission intensity (arb. unit)
Excitation wavelength (nm)
980 nm 991 nm 1047 nm 1054 nm 1018 nm 1060 nm
733 739 747
797 821
805 nm 735 nm
0 10000 20000 30000 40000 50000
900 925 950 975 1000 1025 1050 1075 1100
Emission intensity (arb. unit)
Emission wavelength (nm) 980
991
1018
1047
1054 1060 739 nm
733 nm 747 nm 797 nm 821 nm 800 nm
(a)
(b)
Fig. 19 (a) Excitation spectra and (b) emission spectra of the phosphor used in this study.
Emission wavelength
Excitation wavelength
900 950 1000 1050 1100 700
720 740 760 780 800 820 840 850
Emission wavelength (nm)
E xc ita tio n w ave le ngt h (nm )
0 1 2 3 4 5 6 x 10⁴
E m is si on i nt ens it y (a rb . uni t)
Fig. 20 Emission intensity map of phosphor [Li(Nd
0.9Yb
0.1)P
4O
12] under the conditions of combination of excitation and emission wavelengths (nm)
0 10 20 30 40 50 60 70
0 1 2 3 4 5
900 925 950 975 1000 1025 1050 1075 1100
Se ns iti vit y [A /W]
Em is si on in te ns ity [a rb .u nit]
Wavelength [nm]
0 10 20 30 40 50 60
T ran sm it tan ce [%]
Sensitivity of APD Transmittance of a 0.5-mm- thick InP wafer
Excited at 800 nm
Excited at 733 nm
Fig. 21 Emission spectra of the phosphor [Li(Nd
0.9Yb
0.1)P
4O
12] excited by 733- and
800-nm light beams, transmittance spectrum of a 0.5-mm-thick InP wafer used as
optical filter, and sensitivity of APD (avalanche photodiode) used in this study.
2.1.4. Effect of fluorescence lifetime
The upper-limit frequency of intensity modulation for the lock-in detection is restricted by the fluorescence lifetime. To obtain the fluorescence lifetime of the phosphor used in this study, the time-resolved waveform of excitation light and fluorescence was measured by using an 810-nm LED driven with a 0.03-ms rectangular pulse as a reference. The experimental setup for measuring fluorescence lifetime of phosphor is shown in Fig. 22.
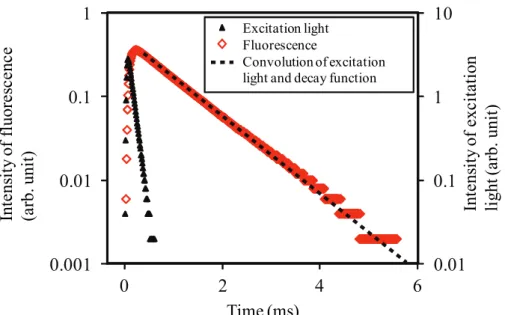
The fluorescence lifetime, namely, the time for the fluorescence amplitude to become 1/e times as large as the initial amplitude, was determined by the slope of the fluorescence-emission decay function on a log scale. It was assumed that the decay function can be modeled by a single-exponential decay. In an iterative calculation, the convolution of the detected excitation light pulse and a decay function with fluorescence lifetime was calculated, and the convolution and the measured fluorescence decay data were compared. A fluorescence lifetime of 0.933 ms was obtained by the least-mean-square method using data between 0.4 and 2 ms. Figure 23 plots the detected pulse waveforms of the excitation light and the fluorescence and the convolution of the excitation light and the decay function.
Light source
( LED 810 nm ) Photo diode
Photosensor Amp.
Oscilloscope Light
Function generator
Trigger LD driver
InP wafer Phosphor
Fig. 22 Experimental setup for measuring fluorescence lifetime of phosphor.
0.01 0.1 1 10
0.001 0.01 0.1 1
0 2 4 6
Time (ms)
Excitation light Fluorescence
Convolution of excitation light and decay function
In ten sit y o f ex ci tatio n li ght (a rb. uni t) Int ens it y of fl uore sc en ce (a rb. uni t)
Fig. 23 Excitation light and fluorescence detected by a photodiode and convolution of the excitation light and a decay function modeled by a single-exponential decay with a time constant of 0.933 ms.
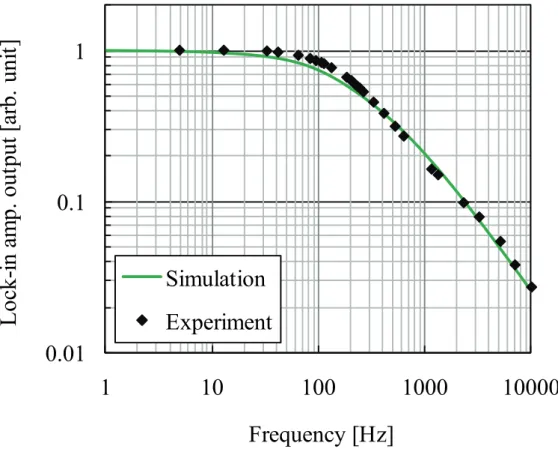
The deformed intensity-modulation fluorescence signal induced by the fluorescence lifetime induces the impaired amplitude of lock-in detection. To quantitatively investigate the effect of the fluorescence lifetime on the amplitude of lock-in detection, the following simulation and experiment were performed. In a simulation, the output of a lock-in amplifier (LA) was calculated in consideration of a fluorescence response function modeled by a single-exponential decay in the following way. First, the convolution of a square wave f
1(t) and the response function was calculated, and then input signal g(t) of the LA was obtained as
) 2
/ (
) 2 / 0
( 0 ) 1
1
( T t T
T t t
f ≤ <
<
≤
⎩ ⎨
= ⎧ , (8)
( )
' )
' ( )
(
0'
1
t t e dt
f t
g = ∫
t−
−tτ, (9)
where t stands for time, τ is the fluorescence lifetime (for which 0.933 ms was used),
and T is the time for one cycle of intensity modulation. Second, the time average of
the multiplication of a zero-mean normalized LA input signal g(t) and a bipolar
square-shaped reference signal f
2(t) was calculated, and an output signal h(t) of the
LA was obtained as
) 2
/ (
) 2 / 0
( 1 ) 1
2
(
T t T
T t t
f ≤ <
<
≤
⎩ ⎨
⎧
= − , (10)
[ ]
∫ −
=
Tcc

![Fig. 21 Emission spectra of the phosphor [Li(Nd 0.9 Yb 0.1 )P 4 O 12 ] excited by 733- and 800-nm light beams, transmittance spectrum of a 0.5-mm-thick InP wafer used as optical filter, and sensitivity of APD (avalanche photodiode) used in this study](https://thumb-ap.123doks.com/thumbv2/123deta/6083631.2081400/41.892.141.756.697.1069/emission-spectra-phosphor-transmittance-spectrum-sensitivity-avalanche-photodiode.webp)