Characteristics of slope failure and the effect of deforestation in a granite basin on Yakushima
Yukiyoshi Teramoto1* and Etsuro Shimokawa1
Abstract: We examined the characteristics of slope failure and their temporal changes, as well as the effect of deforestation on the occurrence of slope failure, for a granite basin on the island of Yakushima in Kagoshima prefecture, Japan, by interpreting aerial photographs taken in May 1977, November 1990, and May 2004. Shallow landslides and deep-seated landslides were observed. The percentage areas of slope failure for May 1977, November 1990, and May 2004 were about 1.0%, 1.2%,and 1.6%, respectively. The aerial photographs taken in May 2004, for which the number of prior heavy rain days was the greatest of the three study periods, showed the highest total area of slope failure. Aerial photographs taken in November 1990, for which the period since deforestation was 16 to 20 years, showed the greatest percentage area of slope failure in the deforested areas.
1 Introduction
Many slope failures and associated debris flows have been generated on steep slopes and in channels on the island of Yakushima, which is 130 km south of mainland Kagoshima prefecture, Japan. These slope failures and debris flows frequently caused sediment-related disasters; for example, the disaster caused by debris flows due to the heavy rainfall of typhoon No. 16 in August 1942 (maximum daily rainfall of 557 mm and total rainfall of 662 mm from the 26th to 27th August 1942), that caused by slope failures and debris flows due to the heavy rainfall of typhoon No. 24 in September 1965 (maximum daily rainfall of 362 mm and total rainfall of 774 mm from the 13th to 17th of September 1965), and that caused by slope failures and debris flows due to the heavy rainfall of typhoon No. 16 in September 1979 (maximum daily rainfall of 160 mm and total rainfall of 441 mm from the 26th to 30th of September 1979) (Shimokawa and Iwamatsu, 1982, 1983;
Yakushima automated meteorological data acquisition system, 1942-1979). Much of the sediment produced by slope failures flows to the lower reaches of mountain basins via debris flows, and considerable damage is caused to the coastal forest of Yakushima. Sediment yield and discharge might have an effect on the basis of growth of the coastal forest in the upper reaches of the coastal forest. Therefore, it is important to clarify the features of slope failure in the basins of Yakushima because of conservation of the coastal forest on Yakushima.
Deforestation took place from the 1940s to about 1983 on Yakushima (Ohsawa et al., 2006). Deforestation
� � � � � � � � � � � � �
1 Faculty of Agriculture, Kagoshima University, 1-21-24 korimoto, Kagoshima, 890-0065 Japan
* :
changed the hydrological and erosion regimes of the basin, and has affected the occurrence and scale of slope failures (Tsukamoto, 1998; Shimokawa and Iwamatsu, 1983). Shimokawa and Iwamatsu (1983) investigated the percentage occurrence of slope failures before and after deforestation in a granite basin on Yakushima. They reported that the percentage of slope failure after deforestation was 1.6 to 34.5 times that before deforestation. Moreover, Tsukamoto (1998) showed that the number and scale of the slope failures were greater after deforestation.
The purpose of this study is to clarify the characteristics of slope failure and their temporal changes, as well as to study the rainfall responsible for slope failure, from the interpretation of aerial photographs of a granite basin on Yakushima. Moreover, we investigate the effect of deforestation on the occurrence of slope failure.
2 Study basin and methods
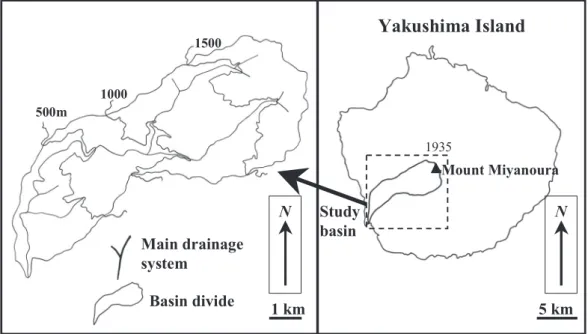
The island of Yakushima has a circumference of 105 km and an area of 500 km2. Mountains with summits not less than 1000 m above sea level including Mount Miyanoura (1935 m above sea level) are located in the central part of the island. The average annual rainfall is about 4000 mm in the lowlands and not less than 8000 mm in the mountainous regions.
The study basin is located in southwestern Yakushima (Figure 1). The basin has an area of 28.4 km2 and an altitude ranging from 0 to 1935 m above sea level. The drainage density of the basin was calculated using a 1/25000 topographical map drawn up by the Geographical Survey Institute. The drainage system was divided using Strahler's method. The drainage density of the basin was 8.9 km/km2.
The slope inclination of the basin was also calculated Corresponding author
海岸林学会誌(Journal of the Japanese Society of Coastal Forest) 8(2):92 − 97, 2009
論 文
: sabot @ agri.kagoshima-u.ac.jp
− 93 −
− 93 − using the 1/25000 topographical map, and the basin was divided into areas of slope inclinations in 10-degree intervals. The inclination chart we produced shows that 4.9% of the total area had an inclination less than 10 degrees, 5.8% had an inclination from 10 to 20 degrees,
28.2% had an inclination from 20 to 30 degrees, and 61.1% had an inclination greater than 30 degrees.
The vegetation of the basin consists of laurel forest that occupies much of the middle and lower reaches of the island and coniferous trees that occupy part of the
500m 1000
1500
N
Yakushima Island
Study basin
1 km
Mount Miyanoura 1935
5 km N
Basin divide Main drainage system
Figure 1: Location of the study basin upper reaches of the island. Since the mid-1970s, there
has been deforestation in the middle and lower reaches of the basin (Ohsawa et al., 2006; Figure 2). The deforestation was over an area of 2.47 km2, and the percentage area of deforestation in the basin was 8.7%.
Afforestation of coniferous trees began immediately after deforestation.
The geology of the basin consists of granite that occupies much of the island and sedimentary rock that occupies part of the lowlands of the island (Kagoshima prefecture, 1990).
Aerial photographs were used to clarify the characteristics of slope failure and their temporal changes as well as the effect of deforestation on the occurrence of the slope failure in the basin, and a distribution chart detailing slope failure and debris flow scars was produced. Three pairs of aerial photographs taken in May 1977, November 1990, and May 2004 were used for the analysis. Furthermore, we investigated the form, geomorphological features, and scale of the slope failures as well as rainfall responsible for slope failure in the basin. Rainfall responsible for the occurrence of slope failure was defined as that falling on a day on which no less than 100 mm of rain fell. The study periods for the rainfall analysis were from October 1963 to May 1977 for the aerial photograph taken in May 1977, from June 1977 to November 1990 for the
photograph taken in November 1990, and from December 1990 to May 2004 for the photograph taken in May 2004. Rainfall data used in the analysis of the occurrence of slope failure were recorded by an automated meteorological data acquisition system, which ran from 1963 to 2004 in the town of Yakushima (Yakushima automated meteorological data acquisition system, 1963-2004).
500m 1000
1500
Deforestation scar
N
1 km Figure 2: Distribution chart of the deforestation scars
from the interpretation of aerial photographs taken in May 1977
3 Results and discussion
3.1 Characteristics of slope failure and rainfall responsible for the occurrence of slope failure Figure 3 shows distribution charts of the slope failure and debris flow scars from the interpretation of aerial photographs of the study basin taken in May 1977, November 1990, and May 2004. Many slope failures were distributed mainly on steep slopes of the lower and upper reaches in the basin, and they were seen to have debris flows among them. Many of the slope failures occurred on steep slopes of not less than 30 degrees. We detected 414, 787, and 868 slope failures in the basin for May 1977, November 1990, and May 2004 respectively.
The areas of slope failures for May 1977 ranged from 59 to 9277 m2 and had an average of 693 m2, those for November 1990 ranged from 78 to 10156 m2 and had an
average of 446 m2, and those for May 2004 ranged from 117 m2 to 19738 m2 and had an average of 509 m2. The sums of the areas of slope failures for May 1977, November 1990, and May 2004 in the basin were about 0.287, 0.351, and 0.442 km2 respectively. The percentage areas of slope failures for May 1977, November 1990, and May 2004 were about 1.0%, 1.2%, and 1.6%, respectively. Thus the total area of slope failure for May 2004 was greater than that for the other two observations. Shallow landslides resulting from the infiltration of rain water into surface soil and its concentration in the cutting and natural slopes as well as deep-seated landslides resulting from the infiltration of rain water into surface soil and bedrock and its concentration in natural slopes were observed.
May 1977
May 2004
N
1 km
500m
1500 1000
Slope failure and debris flow scar
November 1990
Figure 3: Distribution charts of the slope failure and debris flow scars from the interpretation of aerial photographs
− 95 −
− 95 − Figure 4 shows frequency distributions of the daily rainfall being not less than 100 mm as recorded by the automated meteorological data acquisition system. The numbers of days for which the rainfall was not less than 100 mm were 99 in the period from October 1963 to
May 1977, 89 in the period from June 1977 to November 1990, and 143 in the period from December 1990 to May 2004. Aerial photographs taken in May 2004, for which the number of prior rainy days was the greatest, showed the greatest total area of slope failure.
0 20 40 60 80 100 120
Number
From October 1963 to May 1977
200 - 300 300 - 400 400 -
100 - 200
D ai ly r ai nf al l ( m m /d ay )
From June 1977 to November 1990
From December 1990 to May 2004
100 - 200 100 - 200
200 - 300 200 - 300
300 - 400 300 - 400
Figure 4: Frequency distributions of daily rainfall not less than 100 mm recorded by an automated meteorological data acquisition system in the town of Yakushima
3.2 Effect of deforestation on the occurrence of slope failure
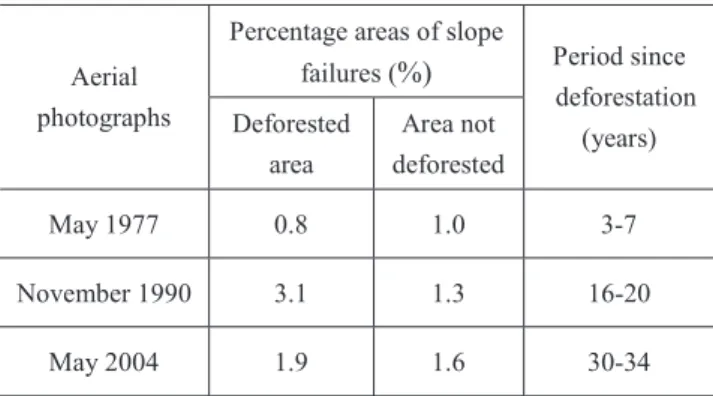
We examined the effect of deforestation on the occurrence of slope failure. Percentage areas of slope failure in deforested areas are compared with percentage areas of slope failure in areas not deforested in Table 1.
Moreover, the table gives the time elapsed since deforestation. Aerial photographs taken in May 2004, for which the number of prior rainy days was the greatest (Figure 4), showed the greatest percentage area of slope failures in the areas not deforested. On the other hand, aerial photographs taken in November 1990, for which the time since deforestation was 16 to 20 years, showed the greatest percentage area of slope failures in the deforested area. The percentage area of slope failure in aerial photographs taken in November 1990 was 1.6 to 3.9 times that for the other two observations. It is conceivable that deforestation increased the occurrence of slope failures in the basin. Tsukamoto (1998) pointed out that even if there was afforestation of coniferous trees immediately after deforestation, the potential occurrence of slope failures tended to increase greatly approximately 10 to 20 years after deforestation.
Tsukamoto (1998) also pointed out that the deforestation reduces the protection against slope failure provided by the root network of a forest and this increases the
potential for slope failure. Thus the results of Tsukamoto agree with those of the present study.
Table 1: Comparison of the percentage areas of slope failures in the deforested area and the area not deforested
Percentage areas of slope failures (%) Aerial
photographs Deforested area
Area not deforested
Period since deforestation
(years)
May 1977 0.8 1.0 3-7
November 1990 3.1 1.3 16-20
May 2004 1.9 1.6 30-34
4 Conclusions
The results of the present study are as follows.
(1) Slope failures were distributed mainly on steep slopes of not less than 30 degrees in the lower and upper reaches in the basin, and they were seen to have debris flows among them. Shallow landslides on cutting and natural slopes and deep-seated landslides on natural slopes were observed. The areas of slope failures for May 1977 ranged from 59 to 9277 m2 and had an
average of 693 m2, those for November 1990 ranged from 78 to 10156 m2 and had an average of 446 m2, and those for May 2004 ranged from 117 m2 to 19738 m2 and had an average of 509 m2. The percentage areas of slope failures for May 1977, November 1990, and May 2004 were about 1.0%, 1.2%, and 1.6%, respectively.
(2) The relationship between rainfall responsible for the occurrence of slope failure and the scale of slope failure was investigated. Aerial photographs taken in May 2004, for which the number of prior heavy rain days was the greatest, showed the greatest total area of slope failure.
(3) Aerial photographs taken in November 1990, for which the period since deforestation was 16 to 20 years, showed the greatest percentage area of slope failure in the deforested area. This result agreed the result of Tsukamoto (1998).
Acknowledgments
The authors would like to express their appreciation of the cooperation of students of the Erosion Control Engineering and Forest Hydrology Laboratory at the Faculty of Agriculture, Kagoshima University.
References
[1] Kagoshima prefecture (1990): Superficial geological map of Kagoshima Prefecture
[2] Masahiko Ohsawa, Hideo Tagawa and Jyuichi Yamagiwa
�2006�: World heritage Yakushima, Asakurasyoten, 278pp.
(in Japanese)
[3] Etsuro Shimokawa and Akira Iwamatsu �1982�: Landslides and debrisflow at Nagata, Yakushima �No.1�, Journal of the Japan Society of Erosion Control Engineering, 34(4), pp.26-31. (in Japanese)
[4] Etsuro Shimokawa and Akira Iwamatsu �1983�: Landslides and debrisflow at Nagata, Yakushima �No.2�, Journal of the Japan Society of Erosion Control Engineering, 35(3), pp.20-27. (in Japanese)
[5] Yakushima automated meteorological data acquisition system (1942-2004): Observed data.
[6] Yoshinori Tsukamoto �1998�: Conservation of forest, water and soil, Asakurasyoten, 138pp. (in Japanese)
〔Received August 26th,2009 Accepted December 9th,2009〕