Title- Morphological and Isozyme diversity in the accessions of two cultivated species of barnyard millet
Deepti prabha*
Ph.D., Deptt. of Seed Science and technology, College of Agriculture, G. B. Pant University of Ag. and Tech, U. S.
Nagar (Uttarakhand), India Y. K. Negi
Lecturer, Deptt. of Microbiology, SBS PG Institute of biomedical Sciences and Research, Balawala, Dehradun (Utarakhand), India
V. K. Khanna
Proffessor, Deptt. of Genetics and Plant Breeding, College of Agriculture, G. B. Pant University of Ag. and Tech, U.
S. Nagar (Uttarakhand), India [email protected]
Abstract: Present study was conducted to access genetic diversity among 33 accessions of two cultivated species of barnyard millet i.e., Echinocloa crus-galli (15 accessions) and E. frumentacea (18 accessions). Though crop possesses great nutritional value, little attention has been paid for the improvement of this crop. Peroxidase and esterase analysis showed seven loci possessing 23 alleles in all 33 accessions. Esterase was found to be more useful to assess diversity with more polymorphism in comparison to peroxidase. Based on allozyme frequencies, all the accessions of both the species were grouped separately in to two different groups at a linkage distance of 6.2. The data would be important in detailing the level of variation and relationship within and between species to plan future domestication trials and to manage the wild species collection that is available in the gene banks. [Academia Arena, 2010;2(9):29-34] (ISSN 1553-992X).
Key words: Barnyard millet, genetic diversity, isozyme analysis, peroxidase, esterase Introduction
Barnyard millet (Echinochloa sp.) is one of the oldest domesticated millets in the semi-arid tropics of Asia and Africa. The genus Echinochloa includes some 20 species that are distributed widely in the warmer parts of the world. Two of the main species, E. crus-galli and E. frumentacea are grown as cereals. In addition to these two domesticated species, the genus includes about 30 annual and biennial wild species distributed worldwide (Clayton and Renvoize, 1986). These millet species are morphologically very dissimilar. Indian barnyard millet (E. frumentacea) can easily be distinguished from Japanese barnyard millet (E. crus-galli) by its panicle, thinner texture of the glumes and lower lemma (Yabuno, 1971).
The crop is valued for its drought tolerance, good yield and superior nutritional value. It is the fastest growing crop among all millets and can be harvested in a short period of nine weeks. Barnyard
millet is an important dual-purpose crop. Its grains contain 6.2 % protein, 9.8 % crude fiber, 65.5 % carbohydrates and are consumed just like rice (Ruiz- santaella et al., 2006). Also it is a nutritive fodder for animals. These aspects make barnyard millet a valuable crop.
But, very little attention has however been paid for the genetic improvement of this crop towards augmenting its yield potential. Heterogeneity of environment and exposure to low temperature at higher elevation causes economic loss in both grain and fodder yields of barnyard millet cultivars.
Moreover, in absence of wide genetic diversity among local cultivars and released varieties, the selection for adaptation to cold temperature is discouraging (Gullord et al., 1975).
Genetic diversity of common morphological traits is difficult to measure in a natural population since the traits are influenced by environmental factors to a large degree. On the other hand, their
expression is largely governed by different interacting genes. Complementing the use of morphological markers, molecular techniques for evaluating genetic diversity have been improved in the last decades Measurement of genetic diversity with molecular markers is relevant to assessment of ecological conditions because it allows estimation of important population parameters e.g., characterization of the geographic structure or connectivity of populations. Molecular markers such as SDS-PAGE and isozymes have been found more useful to study genotypic diversity in many plant species (Tanksley et al., 1989; Paterson et al.,1991).
In the present study we evaluated genetic diversity among 33 different accessions of two cultivated species of barnyard millet (E. crus-galli and E. frumentacea) on the basis of morphological and biochemical markers. Results would be helpful to identify their role in crop improvement by identifying the diverse accessions.
Materials and methods Plant material
Two sets of different accessions of both the species (E. crus-galli and E. frumentacea) were examined. 15 accessions of E. crus-galli were procured from ICRISAT, Hyderabad (Andhra Pradesh, India) and 18 accessions of E. frumentacea were collected from VPKAS, Almora (Uttarakhand, India).
Morphological characters
All the 33 genotypes were sown in the fields in a Randomized Block Design (RBD) at G.B.P.U.A.
& T., Hill Campus, Ranichauri, Tehri Garhwal (Uttarakhand). Crop management was done according to the recommended agronomic practices.
Sowing was done in the plots (3m × 1m), plant to plant distance was maintained 10 cm., while row to row distance was kept 22.5 cm. Eight morphological characters, germination percentage, days to 50%
flowering, plant height, no. of fertile tillers, length of spikelet, days to maturity, 1000 grain wt and yield per plant were taken to assess genetic variability in accessions.
Isozyme analysis
Peroxidase and esterase were isolated to assess the genetic variability. For the isolation of both the isozymes, fresh leaves of plants were collected and washed in tap water followed by distilled water.
Water droplets were removed with the help of tissue paper. 500 mg leaves were weighed and crushed in minimum amount of extraction buffer (0.1 M tris + 2% β-mercaptoethanol) with the help of mortar and pestle under chilled conditions. The extracts were
quickly transferred to pre-cooled eppendorf tubes and kept in a refrigerator. Tubes were centrifuged at 12000 rpm for 30 min at 40C in a refrigerated centrifuge. The supernatant was transferred to fresh tubes. 1 part extract: 1 part glycerol: 1 part bromophenol blue (0.05 mg/ml) were mixed and then the samples were stored at -200 C for further use.
The experiments were carried out in order to characterize the genetic variability by Native Polyacrylamide Gel Electrophoresis (PAGE). The staining procedure for peroxidase and esterase isozyme was done according to method by Wendel and Weeden (1989) with minor modifications.
DATA analysis
Field data for morphological characters was evaluated by the analysis of variance (ANOVA) using RBD to calculate the significance by magnitude of F value (P= 0.01) and D2 statistics as suggested by Rao (1952) using computer software. The calculation of D2 values involved the steps followed by Murthy and Arunachalam (1996).
For isozyme analysis Pair-wise similarity and cluster analysis were done on the basis of presence and absence of bands. Squared Euclidean distances among the accessions were calculated by computer software (Statistica) to perform the similarity matrix analysis using unweighted pair- group method.
Results and discussion
Estimation of genetic diversity based on morphological characters
On the basis of D2 analysis, all the accessions were grouped into three clusters (Table-1).
Cluster-I comprised of accessions of E. frumentacea, cluster-II consists of E. crus-galli, while cluster-III had 2 accessions of E. crus-galli and rest 10 were of E. frumentacea (Table-1).
The average intra- and inter-cluster genetic distance (d values) shown in Table-1. Inter-cluster centeroids distance ranged from 0.00 to 3.14 and Intra-cluster distance ranged from 1.76 to 1.9.
Comparison of these morphological clusters revealed that maximum intra-cluster distance (D=2.25) was observed in cluster-II whereas, maximum inter cluster centeroids distance (D=3.41) was observed in between cluster-III and cluster-II (Table 1). It has previously been suggested that genetic drift and selection in different environments can produce greater diversity (Raje and Rao, 2001). We observed that accessions of E. crus-galli showed genetic superiority to E. frumentacea in different agronomic characters. The findings get support by Bandyopadhyay, 1998, 1999. He reported that the
accessions of E. crus-galli were better adapted for Uttarakhand hills and were promising for high grain yield. Average inter-cluster and intra-cluster distance (D) values presented in Table 1 indicated that the maximum variability was present in cluster-II and cluster-III for agronomic characters. So the clusters showing greater genetic diversity can be used in further crop improvement programme. Several workers suggested selection of parents for hybridization from two clusters having wide inter- cluster and intra-cluster distance to get maximum heterosis (Pradhan and Rao, 1990; Mehta et al., 2005).
Estimation of genetic diversity based on Isozyme
markers Dendrogram was prepared on the basis of
banding pattern obtained by both the isozyme patterns. Accessions of both the species (E.
frumentacea and E crus-galli) were grouped into two groups at a linkage distance of 10 (Figure 3). Again within the species of E. frumentacea, all the accessions were grouped at a linkage distance of 6.2 and were separated into two groups. Other branch of the tree, which separates accessions of E crus-galli, again divided into two subgroups at a 10 linkage distance of 5.4. Grouping of accessions near to 0 indicates the close similarity among them, whereas the increase in linkage distance to 9.9/10 tends to differentiate E. crus-galli were grouped into group 2.
The findings of our study get supporte by Werth et al.
(1994). They studied the isozyme variation in finger millet species and reported the distinct allelic composition between two species.
A total of 23 alleles were observed at the seven Isozyme loci in all 33 accessions of barnyard millet. Mean number of alleles per locus was 3.28 (Table 2). All allelic distribution is shown in Figure1, 2. Both the species of barnyard millet i.e. E.
frumentacea and E. crus-galli were clearly separated on the basis of both the Isozyme systems.
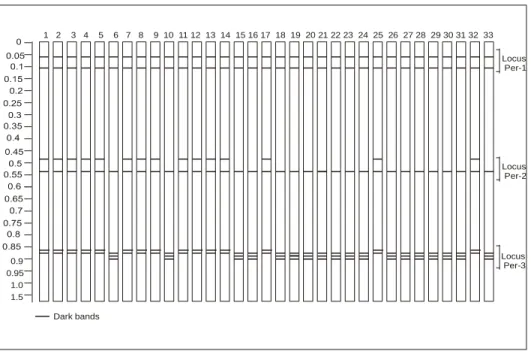
Three loci observed were named as Per-1, Per-2 and Per-3. Per-1 were monomorphic among the studied loci. The other two loci were polymorphic.
Two alleles (Per-2a and Per-2b) were observed at Per- 2 locus. Allele Per-2a was polymorphic and was present only in the accessions of E. crus-galli. Four alleles were detected at Per-3 locus (Per-3a, Per-3b, Per-3c and Per-3d). Allele Per-3a was present in the species E. crus-galli, while Per-3c and Per-3d were present among all accessions of E. frumentacea..
Among the three loci genetic diversity per locus for peroxidase followed the trend, Per-3> Per-2> Per-1.
Esterases showed abundant genetic variability among and within the barnyard species.
Four loci (Est-1, Est-2, Est-3 and Est-4) were detected. Locus Est-1 was highly diverse. Four
alleles were observed at Est-1 locus (Est-1a, Est-1b, Est-1c and Est-1d). Variation at isozyme loci revolutionized the research and evolution (Schwartz, 1969; Wendel and Weeden, 1989; Sachs et al., 1996,). Only the polymorphic bands are actually of use in genetical, physiological or taxonomical studies (Bassiri, 1976).
The maximum variability was present in cluster-II and cluster-III for agronomic characters.
The accessions from these clusters can be used in further hybridization programme. In isozyme analysis, peroxidase was able to differentiate both the species but, it was not able to differentiate accessions of the same species. Esterases showed large number of alleles and polymorphism to differentiate the two species as well as accessions of the same species.
Selection of better species can be made for species improvement on the basis of percent similarity with other species. Two more similar but possessing distinct characters can be chosen for the purpose.
Locus Per-1
Locus Per-2
Locus Per-3
Dark bands
1 2 3 4 5 6 7 8 9 10 11 12 13 14 15 16 17 18 19 20 21 22 23 24 25 26 27 28 29 30 31 32 33
0.9 0.95 1.0 1.5
Figure 1: Zymogram of protein profile of thirty-three barnyard millet accessions obtained through peroxidase. (1.
IEC-549, 2. IEC-555, 3. IEC-556, 4. IEC-546, 5. IEC-531, 6. VRS-MB-886, 7. IEC-535, 8. IEC-538, 9. IEC-547, 10. VRS-MB-1546, 11. IEC-335, 12. IEC-545, 13. IEC-542, 14. IEC-584, 15. VRS-MB-893, 16. VRS-MB-1377, 17. IEC-530, 18. VRS-MB-1554, 19. VRS-MB-1262, 20. VRS-MB-882, 21. VRS-MB-1506, , 22. VRS-MB-1839, 23. VRS-MB-1535, 24. VRS-MB-1542, 25. IEC-543, 26. VRS-MB-846, 27. VRS-MB-889, 28. VRS-MB-1508, 29.
VRS-MB-1361, 30. VRS-MB-1372, 31. VRS-MB-871, 32. IEC-533, 33. VRS-MB-1510).
0 0.05
0.1 0.15 0.2 0.25 0.3 0.35 0.4 0.45
0.5 0.55 0.6 0.65 0.7 0.75 0.8 0.85
Locus Est-1
Locus Est-2
Locus Est-3
Locus Est-4 1 2 3 4 5 6 7 8 9 10 11 12 13 14 15 16 17 18 19 20 21 22 23 24 25 26 27 28 29 30 31 32 33
Faint bands Medium bands Dark bands 0.9
0.95 1.0 1.5
Figure 2: Zymogram of protein profile of thirty-three barnyard millet accessions obtained through esterases. (1.
IEC-549, 2. IEC-555, 3. IEC-556, 4. IEC-546, 5. IEC-531, 6. VRS-MB-886, 7. IEC-535, 8. IEC-538, 9. IEC-547, 10. VRS-MB-1546, 11. IEC-335, 12. IEC-545, 13. IEC-542, 14. IEC-584, 15. VRS-MB-893, 16. VRS-MB-1377, 17. IEC-530, 18. VRS-MB-1554, 19. VRS-MB-1262, 20. VRS-MB-882, 21. VRS-MB-1506, , 22. VRS-MB-1839, 23. VRS-MB-1535, 24. VRS-MB-1542, 25. IEC-543, 26. VRS-MB-846, 27. VRS-MB-889, 28. VRS-MB-1508, 29.
VRS-MB-1361, 30. VRS-MB-1372, 31. VRS-MB-871, 32. IEC-533, 33. VRS-MB-1510).
0 1 2 3 4 5 6 7 8 9 10
VRS-MB-1508 VRS-MB-1361 VRS-MB-871 VRS-MB-1372 VRS-MB-889 VRS-MB-846 VRS-MB-858 VRS-MB-1202 VRS-MB-1542 VRS-MB-1535 VRS-MB-1839 VRS-MB-1506 VRS-MB-882 VRS-MB-1554 VRS-MB-1377 VRS-MB-893 VRS-MB-1546 VRS-MB-886 IEC-533 IEC-543 IEC-548 IEC-545 IEC-535 PRB-9404 IEC-538 IEC-531 IEC-546 IEC-556 IEC-555 IEC-530 IEC-542 IEC-547 IEC-549
Figure 3: Cluster analysis of 33 accessions of Barnyard millet (belonging to two cultivable species, Echinochloa crus-galli and Echinocloa frumentacea) on the basis of banding pattern of two isozymes (Peroxidase and Esterase).
The unweighted pair-group method, arithmetic mean (UPGMA) algorithm was applied to calculate Squared Euclidean Distance using computer software (Statistica).
Table 1: D2 statistics* based clustering pattern and average inter and intra cluster d values of the different accessions of two different species of Echinochloa.
d values of Clusters
Clusters Accessions grouped in different clusters I II III
I VRS-MB-1554, VRS-MB-1839, VRS-MB-886, VRS-MB- 846, VRS-MB-1361, VRS-MB-1535, VRS-MB-1377,
VRS-MB-871 (n=8) 1.76
II IEC-530, IEC-531, IEC-540, IEC-545, IEC-546, IEC-547, IEC-548, IEC-549, IEC-555, IEC-556, IEC-542, IEC-533, PRB-9404 (n=13)
3.40 2.25
III
IEC-535, IEC-538, VRS-MB-1202, VRS-MB-893, VRS- MB-889, VRS-MB-1506, VRS-MB-882, VRS-MB-1546, VRS-MB-1508, VRS-MB-1543, VRS-MB-858, VRS-MB- 1372 (n=12)
2.50 3.41 1.91
* The D2 analysis was done according to Murthy and Arunachalam, 1996.
Eight different morphological characters (Germination percentage, Days to 50 percent flowering, Plant height, Number of fertile tillers, Panicle length, 1000 seed weight, Days to maturity and Yield per plant) were considered to study genetic diversity.
IEC and PRB: Accession number for the accessions of E. crus-galli, VRS-MB: Accession number for the accessions of E. frumentacea.
Table 2: Inter and intra species diversity among E. frumentacea and E. crus-galli accession on the basis of isozyme (Esterase and Peroxydase) analysis
Accessions P A AP HT
All 54.50 3.28 3 10
E. frumentacea 22.75 3 0.57 6.2
E. crus-galli 45.45 2 0.57 5.4
P- Percent Polymorphic Loci, A- Mean number of alleles per locus, AP- Mean number of alleles per polymorphic loci, HT- Total genetic similarity based on linkage distance.
Each of the gel was run three times to confirm best reproducible results.
Acknowledgment:
We are thankful to Dr. R. Prasad, Dr. Arun Kumar for providing seed material, Usha for assistance.
Corresponding address:
Dr. Deepti Prabha 275-C, Rikhi Ram Gali Ghari, Cantt
Dehradun, Uttarakhand, India Mob:09720849962
* Email: [email protected] References
1. Bandyopadhyay BB. A study on variability in sink capacity and grain yield of barnyard millet (Echinochloa frumentacea). Annals of Agriculture Research 1998; 19:34-8
2. Bandyopadhyay BB. Genotypic difference in relation to climate adaption of two cultivated barnyard millet species at Garhwal hills. Indian Journal of Genetics and Plant Breeding 1999; 59:
105-8
3. Bassiri A. Barley cultivar identification by use of Isozyme electrophoretic patterns. Canadian Journal of Plant Science1976; 56: 1-6.
4. Clayton W D, Renvoize S A. Genera Geranium.
Kew bull. Add. Ser. 1986; 13: 280-1
5. Gullord M, Olien CR, Everson EH. Evaluation of freezing hardness in winter wheat. Crop Science 1975;15:153-7.
6. Murthy BR, Arunachalam V. The nature of genetic divergence in relation to breeding system in some crop plants. Indian Journal of Genetics 1996;26: 188-8.
7. Paterson AH, Tanksley SD, Sorrels ME. Marker in plant improvement. Advances of Agronomy 1991; 46: 39-90
8. Rao B, Murty VAR, Subramanya RJ. The amylase and amylopectin content of rice and their influence on cooking quality of cereals.
Proc. Indian Academy of Science1952; 36: 70-4.
9. Ruiz-Santaella, Bastida JP, Franco F, De Prado RAR. Morphological and Molecular Characterization of Different Echinochloa spp.
and Oryza sativa Populations. J. Agric. Food Chem 2006;54:1166–72
10. Schwartz D. An example of gene fixation resulting from selective advantage in suboptimal conditions. American Naturalist 1969;103:479- 81.
11. Tanksley SD, Young ND, Paterson AH, Bonierbale MW. RFLP mapping in plant breeding: new tool for an old science.
Biotechnology 1989;7:257-64.
12. Wendel JF, Weeden NF. Visualization and interpretation of plant isozymes. In: Soltis, D. E., Soltis, P. S., (Eds.), Isozymes in plant biology.
Discorides, Portland, OR, 1989; pp. 5-45
13. Werth CR, Hilu KW, Langher CA. Isozyme of Eleusine (Graminae) and the origin of finger millet. American Journal of Botany 1994;18:1186-97.
14. Yabuno T. A note on barnyard millet. SABURAO News letter1971; 3:43-5.
7/8/2010