Evaluation Index System for Railway Hub
Logistics Base System Layout Planning, Taking Hefei Railway Hub in China as an Example
著者 Chen Tao, Deng Bo‑er, Li Ran, Sun Yichen
出版者 法政大学イノベーション・マネジメント研究センタ
ー journal or
publication title
法政大学イノベーション・マネジメント研究センタ ー ワーキングペーパーシリーズ
volume 212
page range 1‑21
year 2019‑09‑17
URL http://hdl.handle.net/10114/00022372
WORKING PAPER SERIES
Chen Tao, Deng Bo-er, Li Ran and Sun Yichen
Evaluation Index System for Railway Hub Logistics Base System Layout Planning, Taking Hefei Railway Hub in China as an Example
September 17, 2019
No. 212
The Research Institute for Innovation Management, HOSEI UNIVERSITY
Evaluation Index System for Railway Hub Logistics Base System Layout Planning, Taking Hefei Railway Hub in
China as an Example
Chen Tao1,2,3, Deng Bo-er1,2,3, Li Ran1,2,3, Sun Yichen1,2,3
(1. School of Transportation and Logistics, Southwest Jiaotong University, Sichuan Chengdu 610031, China; 2. National Railway Train Diagram Research and Training Center, Southwest Jiaotong University, Sichuan Chengdu 610031, China; 3. National United Engineering Laboratory of Integrated
and Intelligent Transportation, Sichuan Chengdu 610031, China)
Abstract: The construction of a railway hub logistics base system has many influencing factors and a high construction cost. There is an extremely important social and economic significance to the evaluation of its planning scheme. This study has obtained practical experience from a large number of existing railway hub planning schemes in China, using the analytic hierarchy process. Then, macro- and micro-level layout planning principles were analyzed. Moreover, 16 evaluation indicators were established at the macro and micro levels. The analytic hierarchy process and a comprehensive evaluation index method were used to deal with all indicators and give the score of the planning scheme. Lastly, Hefei railway hub in China was taken as an example to test the theory above.
Key words:Railway Hub Logistics Base System,Layout Planning,Evaluation
0
Introduction
A railway hub, which is usually an intersection of a large number of passenger and cargo flows coming from more than three railway directions, is also the connecting point between the railway and ports, factories, as well as other enterprises. The logistics base system, as an important subsystem of the railway hub, relies on the traditional railway freight station and the newly built railway logistics centre in the hub area. With cargo transportation as its main purpose, it manages the warehousing, packaging, circulation, processing, distribution, information service and other value-added service activities of cargo at the same time. It is the future of railway freight transport in China.
Planning of the layout of the railway hub logistics base system (RHLBS) is not only related to the transport efficiency of the entire railway network, but is also of great significance to the optimal utilization of resources in the hub area and the integrated development of comprehensive urban transportation. Hence, it is
necessary to evaluate and select the most suitable design in the early stage of planning and construction, in order to avoid unnecessary costs and planning errors in the construction of the railway hub logistics base system.
The remainder of this paper is organized as follows. The definition of an RHLBS is first given, followed by an analysis of the objectives and principles of RHLBS layout planning. A quantitative evaluation index system for RHLBS layout planning is then proposed, as well as an evaluation methodology. Finally, a case study in Hefei hub in China was carried out to demonstrate the effectiveness of the proposed method.
1 Literature Review
Aiming to study the evaluation of hub layout planning, a comprehensive evaluation index system for a railway hub master plan was proposed (He, 2012), which consists of five target layers, effectively covering five basic aspects of evaluation: of the relative scale, urban coordination, the effects, implementability and prospective evaluation. He did not put forward more detailed indicators, though. (Lei, 2016) explained some representative indicators in the evaluation system based on He’s work, and proposed rules for the mathematical processing and weight processing of qualitative and quantitative indicators. But still some indicators were not explained and calculated quantitatively. (Lei et al., 2012)offer a more comprehensive description of the relevant qualitative indicators involved in the hub master plan. They propose the calculation formula for quantitative indicators, and recommend a reasonable weight value for each level. However, only qualitative explanations are given for some indicators, and the evaluation calculation is still inoperable.
There are domestic and international studies in the field of logistics base location. (Lan et al., 2003) summarized the distribution of logistics nodes, combined with an analysis of urban spatial structure and land use, and studied the spatial distribution of different urban land types and their relationship. (Zhang, 2003) and (Zhao, 2005) specifically discussed the layout planning of logistics nodes, providing a clear model and method for the layout level and location of logistics nodes in urban areas and their surrounding areas. However, all the above studies focus on the impact of urban development, without considering the impact of gateway relations.
In order to obtain a further solution to the evaluation problem, (Reza et al., 2009) pointed out that most of the data types in planning and location problems have fuzzy attributes. Hence, multi-objective and multi-attribute integrated planning problems can be solved by ANP, AHP, ELECTRE, MAUT, TOPSIS, SMAA and other methods. (Zhang et al., 2009) established a hierarchical evaluation structure network for the location of urban logistics parks, focusing on the potential, facilities, scale and development potential of these parks. (Kang, 2017) established an evaluation index system for railway logistics performance
and proposed an improved TOPSIS evaluation model of a logistics base. (Huang, 2017) used a fuzzy comprehensive evaluation method to evaluate the planning project of a comprehensive logistics base in the perspective of overall layout planning of the logistics base, and combined qualitative and quantitative analysis to analyze and summarize it. (Yang & Bo, 2013) established a hierarchical evaluation structure chart for a regional logistics base, and used the AHP method to determine the location of the base. While an evaluation model is used in all the above studies, the algorithm and the method are, however, rather simple and lack comprehensiveness. Based on the combination of the fuzzy analytic hierarchy process (FAHP) and artificial neural network (ANN), (Kayikci, 2010) provided a scientific basis for the location of a multimodal logistics centre, and verified the feasibility of the model by simulation. (Burak et al., 2010) analyzed the importance of urban cargo transportation for the sustainable development of the city, and gave the definition of a logistics centre. The problem of the location of a logistics centre in the Anatolia region of northern Turkey was solved by fuzzy mathematics based on the fuzzy TOPSIS method. More reliable results were obtained.
At present, the main problems with the domestic and international research results are as follows:
(1) The focus is mostly on the evaluation of the layout of the freight system of the railway hub, rather than the wider railway freight system, which can be regarded as the logistics base system for evaluation. Hence, the scope of the evaluation index is limited;
(2) The existing evaluation indicators highlight the performance of individual stations in the railway hub freight system, but neglect or underemphasize the evaluation of system effects caused by multiple sites; we believe these to be the key to evaluation.
2 Methodology
This section will first expound the definition of the railway hub logistics base system, summarize the current target principles of RHLBS layout planning, and then put forward the RHLBS layout planning evaluation index system and indicators.
2.1 Definition of RHLBS
A railway hub is composed of three parts: the passenger transport system, freight transport system and marshalling system. With the development of railway freight logistics in recent years, China Railway Corporation proposed ( Notice on the layout plan of the railway logistics base and the construction plan for 2015-2017). Many original freight stations are being transformed into a logistics base system with modern logistics functions, and are becoming part of a railway
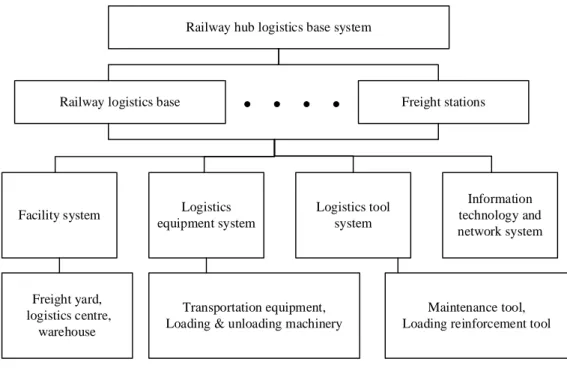
hub. A number of railway logistics bases are being set up to coordinate services to the cities or urban agglomerations where the hubs are located to meet logistics needs. Therefore, this paper understands the RHLBS to be a collection of stations, consisting of railway logistics bases and those traditional freight stations that are still working without upgrading, as Fig. 1 shows.
Railway hub logistics base system
Railway logistics base Freight stations
Facility system Logistics equipment system
Logistics tool system
Information technology and network system
Freight yard, logistics centre,
warehouse
Transportation equipment, Loading & unloading machinery
Maintenance tool, Loading reinforcement tool
Fig. 1 The composition of RHLBS
2.2 RHLBS Layout Planning Principles
By visiting and investigating government departments and design institutes, and by collecting relevant materials and papers published by designers, we found that the RHLBS layout plan is divided into two levels: (1) Macro-level layout planning. To determine the location and scale of each site of the logistics base system in the hub. To make sure the overall layout and scale of the system are compatible with the development of the railway network and the urban planning and logistics needs of the hub, while at the same time ensuring economic and environmental feasibility. (2) Micro-level layout planning. To make sure the logistics bases and freight stations belonging to the RHLBS have a reasonable division of labour, and are coordinated with the trunk lines and marshalling stations in the railway hub. Table 1 shows the principles followed in the layout planning of the railway logistics base system.
Table 1 RHLBS layout planning principles Planning
Level
Principle Specific Requirements
Macro-level Match the medium and long-term planning of railway network
The grade, scale and status of the railway hub system should be compatible with the railway network planning, and cannot be advanced or delayed.
Match the urban master planning
The passenger transportation system and the logistics base system in the hub are independent of each other, with passenger on the inside and logistics base on the outside;
Closely integrated with the logistics park and industrial zone development planning, and close to the city supply distribution centre;
Connected with urban traffic effectively and smoothly.
Match the urban logistics needs
The size of each logistics base and freight station should match the flow of goods in the area covered;
The logistics functions of each logistics base and freight station should match the logistics needs in the area covered.
Economic and environmental
development feasibility
Total investment feasibility of the project;
Environmental feasibility.
Micro-level Coordination of division of labour between various logistics bases and freight stations in the hub
The logistics functions of the various logistics bases and freight stations must be complementary.
The logistics bases and freight stations should match the railway network capacity in the hub
The capacity of each logistics base and freight station in the hub should be coordinated with the capacity of the trunk railway line;
The logistics bases and freight stations should have smooth connection lines.
The capacity of each logistics base and freight station in the hub should be coordinated with the capacity of the marshalling station
The marshalling station capacity should be greater than the amount of freight collected by each station in the logistics base system;
There should be smooth connection lines between the stations of the logistics base and the decoupling stations.
2.3 RHLBS Layout Planning Evaluation Index
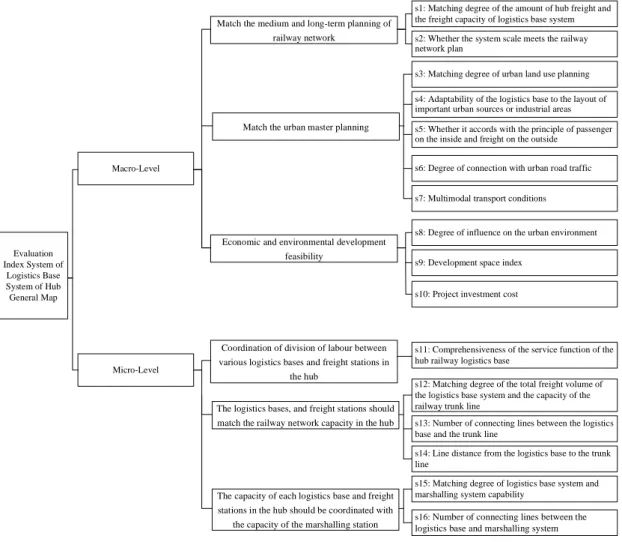
In order to investigate the advantages and disadvantages of each scheme of RHLBS layout planning, this paper proposes the evaluation indicators shown in Fig. 2.
Evaluation Index System of
Logistics Base System of Hub General Map
Macro-Level
Micro-Level
Match the medium and long-term planning of railway network
Match the urban master planning
Economic and environmental development feasibility
Coordination of division of labour between various logistics bases and freight stations in
the hub
The logistics bases, and freight stations should match the railway network capacity in the hub
The capacity of each logistics base and freight stations in the hub should be coordinated with
the capacity of the marshalling station
s1: Matching degree of the amount of hub freight and the freight capacity of logistics base system s2: Whether the system scale meets the railway network plan
s3: Matching degree of urban land use planning s4: Adaptability of the logistics base to the layout of important urban sources or industrial areas s5: Whether it accords with the principle of passenger on the inside and freight on the outside
s6: Degree of connection with urban road traffic
s7: Multimodal transport conditions
s8: Degree of influence on the urban environment s9: Development space index
s10: Project investment cost
s11: Comprehensiveness of the service function of the hub railway logistics base
s12: Matching degree of the total freight volume of the logistics base system and the capacity of the railway trunk line
s13: Number of connecting lines between the logistics base and the trunk line
s14: Line distance from the logistics base to the trunk line
s15: Matching degree of logistics base system and marshalling system capability
s16: Number of connecting lines between the logistics base and marshalling system
Fig. 2 RHLBS Layout Planning Evaluation Index System
1. Macro-level indicator description
(1) s1: degree of matching of the total amount of hub freight and the total freight capacity of the RHLBS. In planning, it is generally necessary to meet the requirement that, under the premise of maintaining a certain reserve capacity, the total freight capacity of the logistics base system should be greater than or at least equal to the long-term annual freight volume of the hub. It is considered to be an optimal match when the reserve capacity accounts for 15% of the total capacity in this paper.
1
1 Design n
i i
E N
N
=
=
∑
(1)whereNDesign is the total long-term annual freight volume of the hub; 𝑁𝑁𝑖𝑖 is the annual total capacity of the 𝑖𝑖𝑡𝑡ℎ logistics base or freight station; n is the number of logistics bases in the hub.
(2) s2: whether the system scale level meets the railway network plan. If the logistics base planned or reconstructed meets the quantity standards stipulated in the construction plan, the index value is 1, otherwise 0.
(3) s3: degree of matching of urban land planning. The location of the
logistics base should be maximized to coincide with the area of the urban land use plan that is divided into logistics and storage land.
0 1 3
1 1 n
i i
n i i
S E
S
=
=
=
∑
∑
(2)where 𝑆𝑆𝑖𝑖𝑂𝑂 stands for the overlapping area between the actual land use of the 𝑖𝑖𝑡𝑡ℎ logistics base and the planned land for urban logistics storage; 𝑆𝑆𝑖𝑖1 is the construction land area of the 𝑖𝑖𝑡𝑡ℎ logistics base.
(4) s4: adaptability of the logistics base to the layout of important urban sources or industrial areas. The service radius of the logistics base is closely related to its size. Therefore, when the source of supply or the industrial park is within the service radius of the logistics base, the logistics base can provide better service;
otherwise, the adaptability of the logistics base to the layout of important urban sources or industrial areas is low.
1 4
n i i
m
E M
=
∑
={ ,L L1 2,,Lmi}<Ri (3) where
mi
L is a collection of distances between a large industrial park in the hub and all logistics bases in the hub; 𝑅𝑅𝑖𝑖 stands for the service radius of the 𝑖𝑖𝑡𝑡ℎ logistics base; M is the number of large industrial parks in the hub; mistands for the number of industrial parks that are in the service radius of the 𝑖𝑖𝑡𝑡ℎ logistics base.
(5) s5: whether it accords with the principle of “passenger inside and freight outside”. This means that passenger transportation is developed in the central area of the city, while cargo transportation is developed in the outer circle of the city. It is reflected by the maximum of the distance between the logistics base in the hub and the city centre and the distance between the passenger station in the hub and the city centre. The final indicator result is a 0‒1 variable, where 0 indicates that the site selection does not conform to the principle and 1 means that it is consistent.
1 2
1 2
0, 1
max{D , D ,..., D }
1, 1
max{D , D ,..., D }
wi
k i
wi
k
D
e D
<
=
>
(4)
1 2 6
1 2
1, 1
0, 0
i i
e e e
E e e e
∩ ∩ ∩ =
= ∩ ∩ ∩ =
(5)
where 𝐷𝐷𝑤𝑤𝑖𝑖 is the distance from the 𝑖𝑖𝑡𝑡ℎ logistics base to the city centre; K is the number of passenger stations in the hub; {𝐷𝐷1,𝐷𝐷2, … ,𝐷𝐷𝑘𝑘} is a collection of distances from the various passenger stations in the hub to the city centre;
1 2 i 0
e ∩ ∩ ∩ =e e means that if one logistics base in the system does not meet the principle of “passenger inside and freight outside”, the whole system does not meet the principle.
(6) s6: degree of connection with urban road traffic. The greater the number of roads, the better the road traffic location of the logistics base is. This has important strategic significance for realizing door-to-door cargo transportation. It is expressed by the number of weighted articulated roads.
7
1 1
1 n m
j ij
i j
E n
n ε
= =
=
∑∑
(6)
where 𝜀𝜀𝑗𝑗 is the calculation factor for the 𝑗𝑗𝑡𝑡ℎ grade highway, as shown in Table 2;
𝑛𝑛𝑖𝑖𝑗𝑗 is the number of 𝑗𝑗𝑡𝑡ℎ grade highways connected to the 𝑖𝑖𝑡𝑡ℎ logistics base.
Table 2 Urban road grade calculation coefficient table Urban road grade Highway
Grade 1
Main road Level 2
Secondary road Level 3
Branch road Level 4
𝜀𝜀𝑗𝑗 4 3 2 1
(7) s7: multimodal transport conditions.
① Distance from the city airports. This reflects the convenience of cargo transfer between the logistics base and air transport.
1 8
1 1
1 n m
ij
i j
E L
n = =
=
∑∑
(7)where m1is the number of airports in the city; 𝐿𝐿𝑖𝑖𝑗𝑗 is the shortest road distance from the logistics base i to the airport j.
②Distance from the city ports. This reflects the convenience of cargo transshipment between the logistics base and water transport. It is reflected by the shortest distance between the logistics base and the port.
2 9
1 1
1 n m
ij
i j
E L
n = =
=
∑∑
(8)where m2 is the number of ports in the city; 𝐿𝐿𝑖𝑖𝑗𝑗 is the shortest road distance from the logistics base i to the port j.
(8) s8: degree of influence on the urban environment. According to the sound attenuation formula K = 10log(10,4π) + 20log(10, r), it is calculated that the storage logistics area should be at least 26.8 meters away from residential areas to ensure that the noise value is within the limited range. To reduce the noise level of the logistics base to 0, the base should be at least 45.3 meters away from residential areas. In order to facilitate statistics, it is now stipulated that a residential area within 30 meters of the logistics base will be greatly affected, and will be affected within 50 meters.
2 10
1 1
1 1
( 50 )
n a
ik
k i
E T
n = a =
=
∑ ∑
− (9)where 𝑇𝑇𝑖𝑖𝑘𝑘 is the linear distance between the logistics base k and the adjacent residential area i; a is the number of residential areas adjacent to the logistics base (within 50 meters).
(9) s9: development space index. For the planning and construction of the logistics base sufficient land should be reserved to ensure that the logistics base has sufficient potential for expansion when the freight demand changes.
11 1
1 n i iL
i i
S S E n = S
=
∑
− (3)where SiLis the actual construction area of the logistics base i; Si is the land area planned by the government for the construction of the logistics base i.
(10) s10: project investment cost. The project investment generally includes engineering investment such as land acquisition and demolition, excavation of stonework, construction of bridges and culverts and tracks. The indicator is expressed by the sum of the investment costs of each project.
12
1 0
1 n i
i i
E C
n = C
=
∑
(4)where 𝐶𝐶𝑖𝑖 is the investment cost of logistics bases i; 𝐶𝐶𝑖𝑖0 is the planning investment cost of logistics bases i.
2. Micro-level indicator description
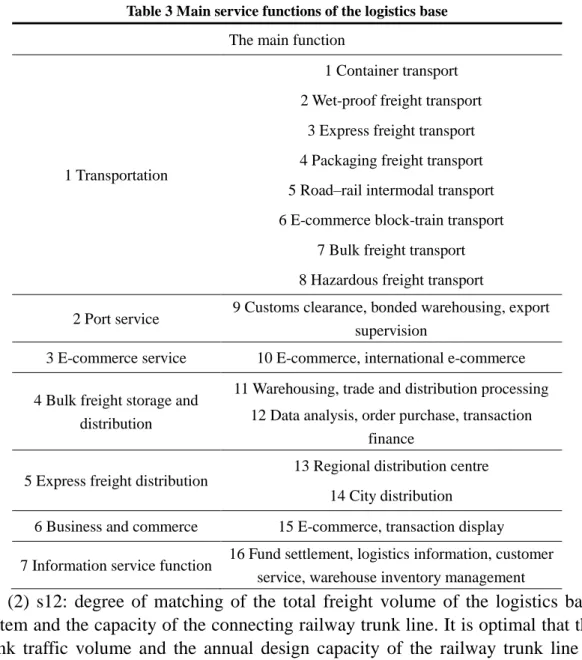
(1) s11: comprehensiveness of the service function of the hub railway logistics base. The service functions of the logistics base system will directly affect its service quality and its ability to attract surrounding cargo sources. The logistics base system contains a total of 17 specific service functions, as shown in Table 3 below. The closer the number of elements in the collection is to 16, the more comprehensive the logistics base system service function of the hub is. The formula for calculating the indicators in the system evaluation is as follows:
1 12
B B B
16
i n
E = ∪ ∪ ∪ (5)
where set Bi is the service functions included in the logistics base I;
B1∪Bi∪ ∪ Bn is the number of service functions that the logistics base system within the hub can provide.
Table 3 Main service functions of the logistics base The main function
1 Transportation
1 Container transport 2 Wet-proof freight transport
3 Express freight transport 4 Packaging freight transport 5 Road‒rail intermodal transport 6 E-commerce block-train transport
7 Bulk freight transport 8 Hazardous freight transport
2 Port service 9 Customs clearance, bonded warehousing, export supervision
3 E-commerce service 10 E-commerce, international e-commerce 4 Bulk freight storage and
distribution
11 Warehousing, trade and distribution processing 12 Data analysis, order purchase, transaction
finance 5 Express freight distribution
13 Regional distribution centre 14 City distribution
6 Business and commerce 15 E-commerce, transaction display 7 Information service function 16 Fund settlement, logistics information, customer
service, warehouse inventory management
(2) s12: degree of matching of the total freight volume of the logistics base system and the capacity of the connecting railway trunk line. It is optimal that the trunk traffic volume and the annual design capacity of the railway trunk line is 0.85. When the value exceeds 0.85, the railway trunk line capacity is in a state of tension.
1 1
13
1
i i
j
n m
local through
i j
m line j
u u
E
u
= =
=
+
=
∑ ∑
∑
(6)where ulocal is the total annual local freight volume of each logistics base; uthrough
is the total annual passing freight volume of each railway trunk line; uline is the annual designed transportation capacity of the trunk line.
(3) s13: number of connecting lines between the logistics base and the railway trunk line. The more connecting lines between the logistics base and the trunk line there are, the better the connection is between them. The calculation only considers the railway trunk lines connected by the logistics bases in the hub.
14
1 1
1 n m
ij
i j
E q
n = =
=
∑∑
(7)where 𝑞𝑞𝑖𝑖𝑗𝑗 is the number of connected lines from the logistics base i to the trunk line j in the logistics base system; n is the number of logistics bases in the system.
(4) s14: line distance from the logistics base to the trunk line. The shorter the line distance between the logistics base and the trunk lines in the hub, the better.
15
1 1
1 n m
ij
i j
E d
n = =
=
∑∑
(8)where 𝑑𝑑𝑖𝑖𝑗𝑗 is the length of the connecting line from the logistics base i to the trunk line j in the logistics base system; n is the number of logistics bases in the system;
m is the total number of trunk lines connected in the hub.
(5) s15: degree of matching of logistics base system and marshalling system capability. This indicator reflects the balance between the loading and unloading capacity of each logistics base and the sorting ability of the marshalling system.
The indicator can be calculated by the designed annual number of loading and unloading cargoes of the logistics base system divided by the designed number of annual marshalling cargoes of the marshalling system.
&
1 16
1 n
load unload i
m
marshalling j
w E
w
=
=
=
∑
∑
(9)where wload&unloadis the total number of the designed annual loading and unloading cargoes of the logistics base system in the hub; wmarshallingis the designed annual number of marshalling cargoes of the marshalling system.
(6) s16: number of connecting lines between the logistics base and the marshalling system. The more connecting lines between the logistics base and the marshalling system there are, the better the connection is between them.
17
1 1
1 n m
ij
i j
E q
n = =
=
∑∑
(10)where 𝑞𝑞𝑖𝑖𝑗𝑗 is the number of connected lines from the logistics base i to the marshalling system j in the logistics base system.
3 Model and Algorithm
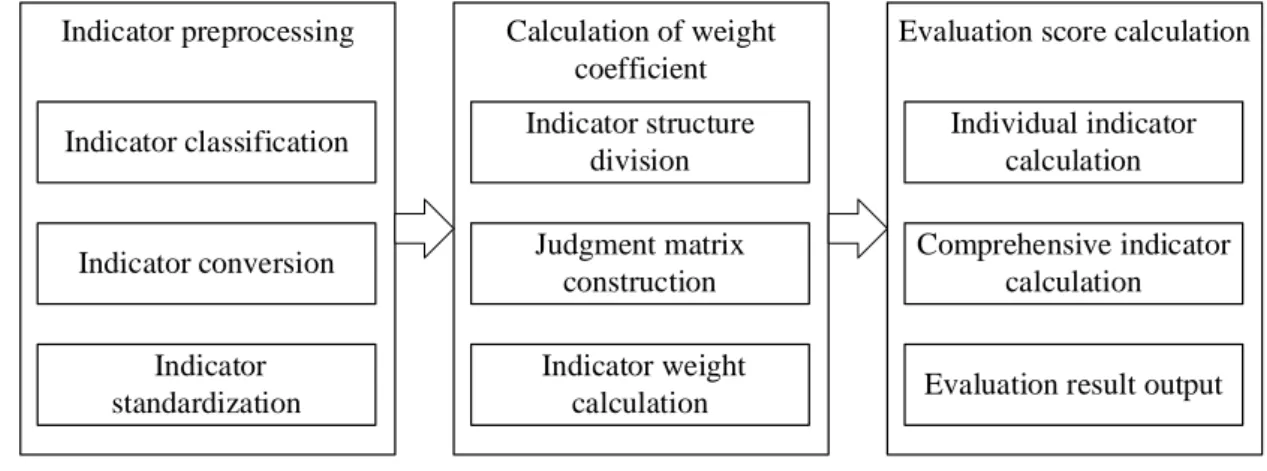
The indicators in the evaluation index system can only reflect the advantages and disadvantages of a certain aspect of the planning scheme. Hence, a comprehensive evaluation of the planning scheme, where the results of different planning schemes are measured by the same standard scale, is needed. The key to the evaluation method in this paper is the construction of the reference system at the index level and the determination of the index weight. The specific evaluation process is shown in Fig. 3. It consists of three steps: indicator pretreatment, weight determination, and evaluation model establishment.
Indicator preprocessing
Indicator classification
Indicator conversion Indicator standardization
Calculation of weight coefficient Indicator structure
division Judgment matrix
construction Indicator weight
calculation
Evaluation score calculation Individual indicator
calculation Comprehensive indicator
calculation
Evaluation result output
Fig. 3 RHLBS Layout Planning Evaluation Process
(1) Indicator pretreatment.
In the indicator system constructed in this paper, the raw data is processed by the following steps:
Step 1: Indicator classification. According to the data type, the indicators are divided into the following four categories:
The maximal indicator (the larger the index value, the better); the minimal indicator (the smaller the index value, the better); the intermediate indicator (the index value is controlled at a reasonable value); the 0‒1 type indicator (the optimal value is 0 or 1).
Step 2: Indicator conversion. Keep maximal indicators still and convert minimal indicators to maximal indicators.
Step 3: Indicator standardization. This is performed using the method of normalization where the sum of the columns equals 1. The formula is as follows:
'
' 1
(j 1, 2, 3..., n)
ij
ij m
ij i
x x
x
=
= =
∑
(11)Therefore, the pretreated indicator matrix is(xij)n m× where 𝑥𝑥𝑖𝑖𝑗𝑗 represents the value of the indicator after preprocessing of the 𝑗𝑗𝑡𝑡ℎ evaluation index in the 𝑖𝑖𝑡𝑡ℎ evaluation scheme.
(2) Calculation of weight coefficient.
The analytic hierarchy process is used to calculate the indicator weight, which is divided into the following four steps:
Step 1: Indicator structure division. Divide the relationship between the decision goal, criteria and objects into goal level, criterion level and indicator level. Draw the structure hierarchy diagram of the system evaluation index.
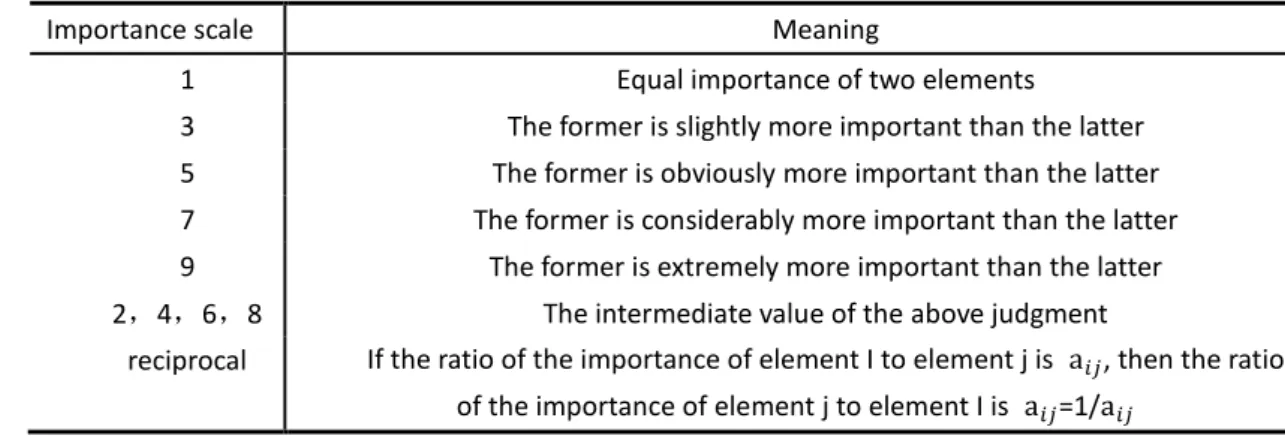
Step 2: Judgment matrix construction. The method of filling out the judgment matrix is to ask the person (expert) repeatedly for the criteria of the judgment matrix, to compare which of the two elements is more important and by how much. Then assign a value of 1‒9 to the importance level, as shown in Table 4.
Table 4 Meaning of Importance Scale
Importance scale Meaning
1 Equal importance of two elements
3 The former is slightly more important than the latter 5 The former is obviously more important than the latter 7 The former is considerably more important than the latter 9 The former is extremely more important than the latter 2,4,6,8 The intermediate value of the above judgment
reciprocal If the ratio of the importance of element I to element j is a𝑖𝑖𝑗𝑗, then the ratio of the importance of element j to element I is a𝑖𝑖𝑗𝑗=1/a𝑖𝑖𝑗𝑗
Step 3: The single-level sequencing in AHP (weight vector calculation) and its inspection. For a consistent judgment matrix, each column is normalized to the corresponding weight. For an inconsistent judgment matrix, each column is normalized to approximate its corresponding weight. Then calculate the arithmetic mean of the n column vectors to obtain the final weight, as shown in the formula.
∑
=∑
=
= n
j n
k kl ij i
a a
W n
1 1
1 (12)
In the hierarchical ordering, the consistency of the judgment matrix is inspected. The consistency index is calculated as follows:
. 1
. max
−
= − n I n
C
λ
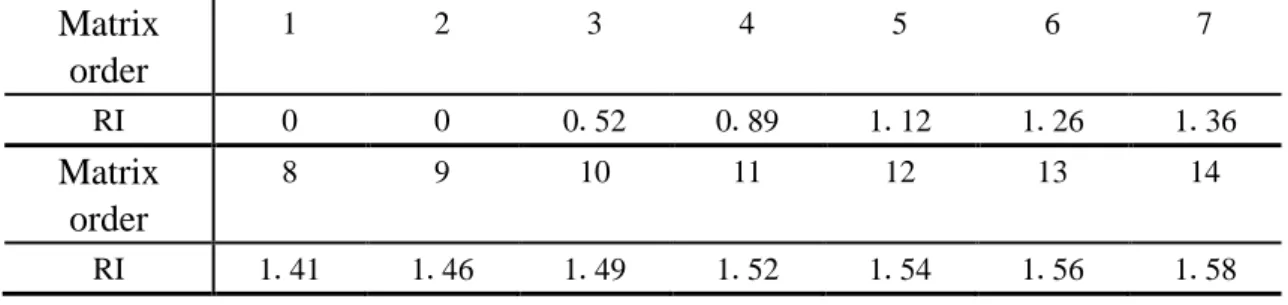
(13) According to different orders of the judgment matrix, the corresponding
average random consistency indicator RI is determined by looking up Table 5, and consistency ratio CR is calculated and judged.
Table 5 Average random consistency indicator RI Matrix
order
1 2 3 4 5 6 7
RI 0 0 0.52 0.89 1.12 1.26 1.36
Matrix order
8 9 10 11 12 13 14
RI 1.41 1.46 1.49 1.52 1.54 1.56 1.58
𝐶𝐶𝑅𝑅 = 𝐶𝐶𝐶𝐶𝑅𝑅𝐶𝐶 (14)
When CR < 0.1, it is considered that the consistency of the judgment matrix is acceptable. When CR > 0.1, it is considered that the judgment matrix does not meet the consistency requirement, and the judgment matrix needs to be corrected.
Step 4: Total ordering of hierarchy and inspection. The total ordering refers to the relative weight of each factor of the judgment matrix for the target layer (the top layer). This weight is calculated using a top-down approach, layer by layer.
Let P(k) = (p1(k), p2(k), . . . , pn(k)), denoting the order of the k𝑡𝑡ℎ layer elements for the (k−1)𝑡𝑡ℎ layer elements. The total order of the k𝑡𝑡ℎ layer elements for the goal layer elements is:
( ) ( 1)
1
(I 1, 2,3,..., n)
(k) k k
m
i ij j
j
w p w −
=
=
∑
= (15)Similarly, a consistency inspection of the total ordering results is required.
(3) Evaluation score calculation.
The evaluation indicators are classified using the idea of a comprehensive index method based on the above steps. The individual index of the indicator is then calculated, after the analysis of the range of indicators and the optimal value, according to the type of system evaluation indicator. Finally, the comprehensive index of the system is obtained, which is also the final score of the system. The comprehensive evaluation is mainly divided into the following four steps:
Step 1: Determine the optimal value of the indicator. According to the
“Indicator classification” in the “Indicator preprocessing”, the optimal value of the indicator 𝑥𝑥𝑦𝑦 is obtained. The formula is as follows in Table 6.
Table 6 Index Optimal Value Calculation Formula Indicator type Optimal value calculation formula Maximum xy= Max xi , i = 1,2,3 … … m Minimum xy= Min xi , i = 1,2,3 … … m Intermediate xy= xi , i = 1,2,3 … … m
0-1 xy= 0 or 1
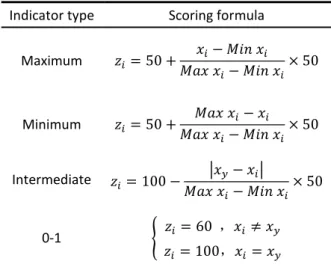
Step 2: Calculate the score of the individual indicator. According to the
indicator range xi ∈[Min xi, Max xi ] and the optimal value xy, the score formula of each indicator is determined by the indicator type. And the individual indicator score is determined according to the formula zi. Set the lower limit of the score to 50 points and the upper limit to 100 points. The specific formula is as follows in Table 7.
Table 7 Indicator Scoring Formula Indicator type Scoring formula
Maximum 𝑧𝑧𝑖𝑖= 50 + 𝑥𝑥𝑖𝑖− 𝑀𝑖𝑖𝑛𝑛 𝑥𝑥𝑖𝑖
𝑀𝑎𝑥𝑥 𝑥𝑥𝑖𝑖− 𝑀𝑖𝑖𝑛𝑛 𝑥𝑥𝑖𝑖× 50 Minimum 𝑧𝑧𝑖𝑖= 50 + 𝑀𝑎𝑥𝑥 𝑥𝑥𝑖𝑖− 𝑥𝑥𝑖𝑖
𝑀𝑎𝑥𝑥 𝑥𝑥𝑖𝑖− 𝑀𝑖𝑖𝑛𝑛 𝑥𝑥𝑖𝑖× 50 Intermediate 𝑧𝑧𝑖𝑖= 100− �𝑥𝑥𝑦𝑦− 𝑥𝑥𝑖𝑖�
𝑀𝑎𝑥𝑥 𝑥𝑥𝑖𝑖− 𝑀𝑖𝑖𝑛𝑛 𝑥𝑥𝑖𝑖× 50 0-1 � 𝑧𝑧𝑖𝑖= 60 ,𝑥𝑥𝑖𝑖≠ 𝑥𝑥𝑦𝑦
𝑧𝑧𝑖𝑖= 100,𝑥𝑥𝑖𝑖=𝑥𝑥𝑦𝑦
Step 3: Determine the indicator weight vector. Finally, by determining the system indicator weight, after calculation, the weight vector of the indicator is W(w1, w2, wi… , wm).
Step 4: Calculate the scheme weighted score. According to the upper and lower limits of the score, the range of the evaluation grade is determined, and the results are as follows in Table 8.
Table 8 Classification of Evaluation Grades
Evaluation level E D C B A
Evaluation score 50-60 60-70 70-80 80-90 90-100
According to the single index score 𝑧𝑧𝑖𝑖 and the single index weight 𝑤𝑤𝑖𝑖, use the following formula to calculate the weighted score Z:
Z = 𝑧𝑧𝑖𝑖×𝑤𝑤𝑖𝑖 , 𝑖𝑖 = 1,2,3 … …𝑚𝑚 (16) The weighted score Z is the final score of the systematic evaluation, and the level is determined with reference to the classification of the evaluation grades table.
4 Case Study
This section will validate the models and algorithms presented above in actual cases. Firstly, the raw data of the evaluation index is given, taking the logistics base system in China’s Hefei Hub as an example. Then we use the evaluation indexes and methods of this paper to calculate the program indexes.
Finally, the calculation results are analyzed.
4.1 Hefei Hub Basic Information
Hefei, as the provincial capital of Anhui, China, is the political, economic, science and technology, educational and cultural centre of the province. Hefei is also one of the most important regional hubs in east China. It connects 10 major trunk rail-lines including the Huhanrong fast railway, Shangqiu‒Hangzhou high-speed Railway and Beijing‒Fuzhou high-speed railway. It is also a road, water, and air transportation centre of Anhui Province.
Within the Hefei Railway Hub, there is a marshalling station named Hefeidong Railway Station with four yards in two stages. There are four freight stations (Hefeibei, Nangang, Zhuxi and Cuozhen Railway Stations) that will be upgraded and converted into logistics bases. Hefeibei Railway Station will be the largest logistics base among them, and they will together constitute the Hefei RHLBS, serving Hefei and surrounding cities. The indexes and methods proposed in this paper will be used to evaluate the layout of this logistics base system. Fig. 2 shows the Hefei Railway Hub map. The stations in black circles are the logistics base stations and marshalling stations.
Fig. 4 Overview of Hefei Railway Hub
4.2 Hefei RHLBS Layout Planning Evaluation (1) Data process
Hefeibei, Nangang, Zhuxi and Cuozhen Railway Stations constitute a whole logistics base system. We collect all the stations’ data and calculate the indicators and pretreatment. Table 9 lists the indicators’ ranges, optimal values, and index values.
Table 9 Pretreatment of Indicators of Hefei RHLBS Index Name Index Type Index Range Optimal
Values
Index Values
s1 Intermediate [0,1] 0.85 0.82
Hefeibei
Hefeidong
Zhuxi
Cuozhen Nangang
S2 0-1 0 or 1 1 1
S3 Maximum [0,1] 1 1
S4 Maximum [0,1] 1 1
S5 0-1 0 or 1 1 0
S6 Maximum [0,12] 12 6.3
S7(1) Minimum [0,60] 0 46.2
S7(2) Minimum [0,120] 0 45.7
S8 Minimum [0,50] 0 0
S10 Minimum [0,1] 0 0.85
S11 Maximum [0,1] 1 0.9412
S12 Maximum [0,1] 1 0.8192
S13 Maximum [0,3] 3 2.0556
S14 Minimum [0,40.3] 0 16.8111
S15 Intermediate [0,1] 0.18 0.144
S16 Maximum [0,4] 4 2
(2) Weight calculation
According to the scores given by experts, the importance of the evaluation indicators is sorted. The results are shown in Table 10:
Table 10 Hierarchical Ordering of Indicators’ Importance
S1 S2 S3 S4 S5 S6 S7(1) S7(2) S8 S10 S11 S12 S13 S14 S15 S16
1 1 1 2 2 3 3 3 3 3 4 5 6 6 5 6
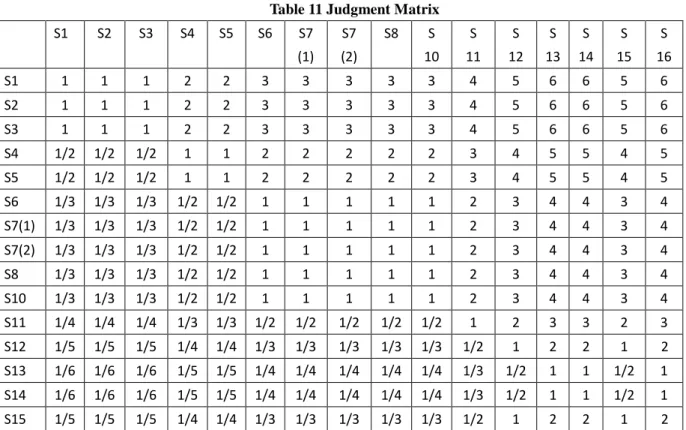
The judgment matrix is shown in Table 11.
Table 11 Judgment Matrix S1 S2 S3 S4 S5 S6 S7
(1) S7 (2)
S8 S 10
S 11
S 12
S 13
S 14
S 15
S 16
S1 1 1 1 2 2 3 3 3 3 3 4 5 6 6 5 6
S2 1 1 1 2 2 3 3 3 3 3 4 5 6 6 5 6
S3 1 1 1 2 2 3 3 3 3 3 4 5 6 6 5 6
S4 1/2 1/2 1/2 1 1 2 2 2 2 2 3 4 5 5 4 5
S5 1/2 1/2 1/2 1 1 2 2 2 2 2 3 4 5 5 4 5
S6 1/3 1/3 1/3 1/2 1/2 1 1 1 1 1 2 3 4 4 3 4
S7(1) 1/3 1/3 1/3 1/2 1/2 1 1 1 1 1 2 3 4 4 3 4
S7(2) 1/3 1/3 1/3 1/2 1/2 1 1 1 1 1 2 3 4 4 3 4
S8 1/3 1/3 1/3 1/2 1/2 1 1 1 1 1 2 3 4 4 3 4
S10 1/3 1/3 1/3 1/2 1/2 1 1 1 1 1 2 3 4 4 3 4
S11 1/4 1/4 1/4 1/3 1/3 1/2 1/2 1/2 1/2 1/2 1 2 3 3 2 3 S12 1/5 1/5 1/5 1/4 1/4 1/3 1/3 1/3 1/3 1/3 1/2 1 2 2 1 2 S13 1/6 1/6 1/6 1/5 1/5 1/4 1/4 1/4 1/4 1/4 1/3 1/2 1 1 1/2 1 S14 1/6 1/6 1/6 1/5 1/5 1/4 1/4 1/4 1/4 1/4 1/3 1/2 1 1 1/2 1 S15 1/5 1/5 1/5 1/4 1/4 1/3 1/3 1/3 1/3 1/3 1/2 1 2 2 1 2
S16 1/6 1/6 1/6 1/5 1/5 1/4 1/4 1/4 1/4 1/4 1/3 1/2 1 1 1/2 1
The index weight is shown in Table 12.
Table 5 Index Weight (%)
S1 S2 S3 S4 S5 S6 S7(1) S7(2) S8 S10 S11 S12 S13 S14 S15 S16 13.7 13.7 13.7 8.9 8.9 5.6 5.6 5.6 5.6 5.6 3.6 2.4 1.6 1.6 2.4 1.5
(3) Score evaluation
According to the single indexes scores and index weight calculation above, the comprehensive index of each indicator is calculated. We add all the index scores to obtain 85.75, which is the final score of the Hefei Hub logistics base system. Table 13 shows the system evaluation results of the Hefei Hub logistics base system.
Table 63 System Evaluation Results of Hefei Hub Logistics Base System
Sequence Index Name Individual Index Comprehensive Index
1 S1 97.2 13.4
2 S2 100.0 13.7
3 S3 100.0 13.7
4 S4 100.0 8.9
5 S5 0.0 0.0
6 S6 76.3 4.2
7 S7(1) 61.5 3.4
8 S7(2) 81.0 4.5
9 S8 100.0 5.6
10 S10 57.5 3.22
11 S11 97.1 6.75
12 S12 91.0 5.6
13 S13 84.3 3.5
14 S14 79.1 2.2
15 S15 98.2 1.3
16 S16 75.0 1.3
Final Score 91.27
Evaluation Level A
4.3 Analysis of Evaluation Results
By analyzing the results of the evaluation, it can be obtained that the indicators with the lowest scores are the degree of matching between the freight volume of the hub and the total capacity of the logistics base system, the degree of matching with the airport, and the principle of passengers on the inside and goods on the outside.
The results reveal that: a) the current Hefei Hub logistics base system's total capacity cannot meet the demand of the recent hub freight volume, and it needs to be expanded accordingly. Building more logistics bases might enable it to meet the demand; b) the locations of the existing logistics bases have not been well selected.
Hefeibei Station is too close to the city centre, affecting the development of the forward city to the north; c) the current logistics base system and the airport are poorly connected, and the long-term growth of express transportation in some parts needs to rely to some extent on air transportation. Upon completion, the links with air transport should be appropriately strengthened.
The evaluation results are consistent with the long-term planning opinions formulated in the actual planning, which proves that the evaluation system and method proposed above can evaluate the overall logistics base system in a better way, and the evaluation effect is consistent with the actual demand.
5 Conclusion
The evaluation of the RHLBS is very important at the initial stage of construction. This paper studies the related domestic and international literature, summarizes the system evaluation objectives, and proposes a set of evaluation indicators. All the evaluation indicators were quantified to improve the operability of the evaluation. An evaluation model and algorithm are then proposed, in which the weight calculation uses the analytic hierarchy process. Finally, the rationality of the model and the feasibility of the algorithm are verified by examining the case of Hefei Railway Hub.
References
Burak, E., Emin, G. (2010). A Fuzzy Topsis Approach For Logistics Center Location Selection. Journal of Business Case Studies, 39(7), 49-55.
Farahani, R. Z., Seifi, M. S., Asgari, N. (2009). Multiple criteria facility location problems: A survey. Applied Mathematical Modeling, 34, 1689-1709.
He Zhigong. (2012). Analysis on the Railway Hub Layout Planning &
Evaluation System. Railway Standard Design, 12, 5-8.
Huang Dianhui. (2017). Study on Layout Planning of Railway Logistics Center. Railway Transport and Economy, 39(01), 24-28.
Kang Fuquan. (2017). Research on the Performance Evaluation of Railway Logistics Center [Master]. Beijing Jiaotong University.
Kayikci, Y. (2010). A conceptual model for intermodal freight logistics centre location decisions. Social and Behavioral Sciences, 2(3), 6297-6311.
Lan Jianhua (2004). Study on Railway Logistics Center Planning and Design [Master]. Southwest Jiaotong University.
Lan Jianhua, Yan Yusong, et al. (2003). Research on Logistics Park Planning of Railway. Railway Transport and Economy, 25(10), 9-11.
Lei Zhiren. (20015). Study on the Selection of Logistics Center in Western China [Master]. Shanghai Maritime University.
Lei Zhonglin, He Zhigong, et al. (2012). Research on the Railway Hub Layout Planning & Evaluation System. Wuhan: China Railway Siyuan Survey and Design Group Co. Ltd.
Lei Zhonglin. (2016). Deepen Research on the Railway Hub Layout Planning
& Evaluation System. Journal of Railway Engineering Society, 33 (02), 1-5.
Notice on the layout plan of the railway logistics base and the construction plan for 2015-2017.
Shi Xinping. (2005). Study on the Macro Layout of Logistics Parks in the Yangtze River Delta [Master]. Shanghai Maritime University.
Sun Wei (2004). Research on Railway Logistics Center Planning [Master].
Beijing Jiaotong University.
Yang Hualong, Bo Lingxiang. (2003). Researches on location choice of regional logistics base. Journal of Dalian Maritime University , (01), 102-105.
Zhang Xiaodong, Pan Hua, Wan Tao. (2009). Site Selection Method for Railway Logistical Parks. Urban Transportation of China, 7(05), 12-20.
Zhang Xiaodong. (2003). Study on the Theory and Practice of Logistics Park Layout Planning [Doctor]. Beijing Jiaotong University.
Zhao Chuang. (2005). Research on Theory and Method of Urban Logistics Node Layout Planning [Doctor]. Beijing Jiaotong University.
Acknowledges:This research was supported by National Natural Science Foundation of China (Project No. 61703351) , the Fundamental Research Funds
for the Central Universities(2682017CX022, 2682017CX018), the National Key R&D Program of China (2017YFB1200702,2016YFC0802208)
本ワーキングペーパーの掲載内容については、著編者が責任を負うものとします。
〒102-8160 東京都千代田区富士見2-17-1 TEL: 03(3264)9420 FAX: 03(3264)4690 URL: http://riim.ws.hosei.ac.jp
E-mail: [email protected]
(非売品) (非売品) (非売品) (非売品)
The Research Institute for Innovation Management, HOSEI UNIVERSITY