Influence of vesicular glutamate leakage on synaptic transmission at the mammalian
presynaptic terminal
著者(英) Chihiro Takami
学位名(英) Doctor of Philosophy in Science 学位授与機関(英) Doshisha University
学位授与年月日 2017‑03‑22
学位授与番号 34310甲第862号
URL http://doi.org/10.14988/di.2017.0000016967
1
Influence of vesicular glutamate leakage on synaptic transmission at the mammalian presynaptic terminal
DOCTORAL DISSERTATION
A thesis submitted in partial fulfillment of the requirements for the degree of Doctor of Philosophy
By:
Chihiro Takami
Supervisor:
Dr. Shigeo Takamori
Graduated School of Brain Science Doshisha University
March 2017 Kyoto, Japan
2
Table of contents
Abstract ... 1
List of Figures ... 3
1. Introduction 1.1. Synaptic transmission ... 4
1.2. Parameters that determine the strength of neurotransmission ... 7
1.3. Synaptic vesicle recycling ... 10
1.3.1. Exocytosis ... 10
1.3.2. Endocytosis ... 11
1.3.3. Re-acidification ... 12
1.3.4. Vesicular neurotransmitter uptake ... 14
1.4. Functional vesicle pools ... 17
1.5. Presynaptic regulation of quantal size ... 19
1.5.1. Cytosolic neurotransmitter concentrations... 20
1.5.2. Regulation of the driving force ... 21
1.5.3. Transporter expression ... 22
1.5.4. Leakage at equilibrium... 23
1.6. Aim of this work ... 25
1.7. Calyx of Held ... 26
2. Materials and Methods 2.1. Ethical approval ... 28
2.2. Preparation of slices for patch clamp experiments ... 28
2.2.1. Slicing ... 28
2.2.2. Mechanical fixation for recording ... 29
2.2.3. Optical setup ... 30
2.3. Whole-cell patch clamp recordings ... 30
2.3.1. Whole-cell recording ... 30
2.3.2. Simultaneous pre- and postsynaptic recordings ... 31
2.4. Capacitance measurement ... 33
3
2.5. Variance-mean analysis ... 34
2.6. Analysis of electrophysiological data ... 36
2.6.1. Detection of mEPSCs with a scaled template ... 36
2.6.2. mEPSC amplitude compensation ... 37
2.7. Statistical analysis ... 38
3. Results 3.1. Washout of presynaptic cytosolic glutamate ... 39
3.2. Block of vacuolar ATPase with bafilomycin A1 ... 41
3.3. mEPSCs reduced by CNQX ... 43
3.4. Influence of filling state on vesicle recycling ... 46
3.5. Quantal size can be monitored during high frequency stimulation by the non-stationary variance-mean analysis. ... 48
3.6. The variance-mean analysis reliably reports changes of quantal size during repetitive stimulation. ... 53
3.7. Quantal size during repetitive stimulation markedly decreased in the absence of cytosolic glutamate. ... 55
4.Discussion ... 60
Appendix. Technical concerns on the non-stationary fluctuation analysis ... 64
Acknowkedgments ... 66
Bibliography... 68
1
Abstract
Since the amount of neurotransmitters in single synaptic vesicles ultimately defines the strength of neurotransmission, it is important to understand how neurotransmitters are concentrated and maintained in synaptic vesicles at the presynaptic terminals. Although previous studies have suggested that both the neurotransmitter uptake and leakage can regulate the amount of neurotransmitter content, relative contribution of neurotransmitter leakage from synaptic vesicles to synaptic transmission has caught little attention. While the major excitatory neurotransmitter glutamate leaks out of synaptic vesicles relatively fast when trans-vesicular proton gradient is dissipated in isolated vesicle preparations, it is controversial whether glutamate can also leak out of vesicles in the nerve terminal. To address this issue, I abolished vesicular glutamate uptake by washing out presynaptic cytosolic glutamate in whole-cell dialysis, or by blocking vacuolar-type H+ ATPase using bafilomycin A1 (Baf) at the calyx of Held synapses in mice brainstem slices. Then, I postsynapitically recorded the miniature excitatory postsynaptic currents (mEPSCs), each of which is elicited by neurotransmitters released from a single vesicle, thereby a good readout of the vesicular neurotransmitter content.
Both presynaptic glutamate washout and Baf application reduced the mean amplitude and frequency of mEPSCs and the mean amplitude of EPSCs evoked every 10 min, which are evoked by neurotransmitters released from multiple vesicles. However, the percentage reduction of mEPSC amplitude was much less than those of EPSC amplitude and mEPSC frequency, and tended to reach a plateau. One possible reason is that the postsynaptic receptors failed to detect small amount of
2
glutamate released from partially-filled vesicles. The amplitude of mEPSCs after glutamate washout or Baf application sustained high above the detection limit which was deduced from the reduction of mEPSC amplitude by an AMPA receptor blocker, CNQX. In addition, membrane capacitance measurements from the presynaptic terminals indicated no effect of glutamate washout on exocytosis or endocytosis of synaptic vesicles, indicating that the amount of glutamate in the lumen did not affect synaptic vesicle recycling. However, the CNQX experiments also indicated that there must have been small miniature events which eluded detection. In a separate series of experiments, I estimated quantal size originated from synaptic vesicles resulted from evoked release by taking advantage of the variance-mean analysis, and overall results were consistent between variance-mean analysis and the analysis of mEPSCs.
Collectively, my results indicated that glutamate can leak out of vesicles unless it is continuously taken up from presynaptic cytosol. However, the magnitude of glutamate leakage was small and had only a minor effect on synaptic responses. In contrast, prominent rundowns of EPSC amplitude and mEPSC frequency observed after glutamate washout or Baf application are likely to be caused by accumulation of unfilled vesicles in presynaptic terminals retrieved after spontaneous and evoked glutamate release. I concluded that unlike isolated vesicles, glutamate leakage from synaptic vesicles in living synapses is limited, and there must be a mechanism to sustain glutamate in the lumen even in the absence of glutamate transport.
3
List of Figures
Fig 1-1. The schema of neuron ... 6
Fig 1-2. Synaptic transmission ... 6
Fig 1-3. Frog neuromuscular junction ... 8
Fig 1-4. Synaptic vesicle recycling ... 14
Fig 1-5. Vesicular neurotransmitter uptake ... 15
Fig 1-6. Characteristics of the functional synaptic vesicle pools ... 19
Fig 1-7. Leakage at equilibrium ... 24
Fig 2-1. Accessories for maintenance and mechanical fixation of slices ... 29
Fig 2-2. Patch clamp recording ... 31
Fig 2-3. The simultaneous whole-cell recordings ... 32
Fig 2-4. Detection of mEPSCs ... 37
Fig 3-1. Rundowns of EPSCs and mEPSCs after whole-cell washout of cytosolic glutamate in the presynaptic terminal ... 40
Fig 3-2. Rundowns of EPSCs and mEPSCs after block of glutamate uptake by bafilomycinA1 ... 42
Fig 3-3. Reductions in the amplitudes of EPSCs and mEPSCs by CNQX titration ... 45
Fig 3-4. Exo-endocytic membrane capacitance changes in presynaptic terminals after glutamate washout ... 47
Fig 3-5. Nonstationary variance-mean analysis in the presence of glutamate ... 51
Fig 3-6. Nonstationary analysis in the presence of CTZ... 52
Fig 3-7. Pharmacological reduction of quantal size by applying CNQX ... 54
Fig 3-8. mEPSC amplitude and quantal size estimated by nonstationary analysis after whole-cell washout of glutamate in the presynaptic terminal ... 58
4
1. Introduction
The aim of this thesis is to study the impact of neurotransmitter leakage from synaptic vesicles on synaptic transmission in physiological conditions. Therefore, I will start review the principles of neural signaling and synaptic transmission and then explain the rationale to study such phenomenon in this study.
1.1 Synaptic transmission
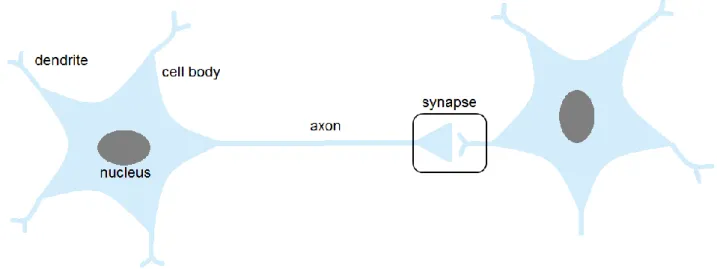
Neural networks consisting of neurons govern all aspects of brain functions, such as sensory cognition, motor control, learning and memory. A neuron is composed of a cell body, dendrites, and an axon (Fig 1-1). A cell body consists of the cytosol, the nucleus, mitochondria and other organelles.
Dendrites usually receive numerous synaptic inputs and work as neural antennas. Axons have specialized structures for neural signal propagation. Neurons produce action potentials (APs), thereby conveying neural information. Hodgkin and Huxley revealed that APs are generated by a transient influx of sodium ions, followed by an efflux of potassium ions (Hodgkin and Huxley, 1952). Neural membranes are normally maintained at -60~80 mV at rest. When a neuron is depolarized above the threshold of voltage-dependent sodium channel activation, an AP is generated. Essentially, sodium ions enter into the neuron through voltage-gated sodium channels according to an electrochemical gradient, and the membrane potential rises rapidly toward the sodium equilibrium potential (~ +50 mV). This is soon followed by a fall of the membrane potential toward the potassium equilibrium potential (-100 mV) due to a subsequent opening of voltage-gated potassium channels.
5
Upon an arrival of APs at the presynaptic terminals, neurotransmitters stored in synaptic vesicles (SVs) are released to the synaptic cleft, a space between a presynaptic terminal and a postsynaptic cell, and reach specific receptors at the postsynaptic membrane, leading to their activation (Fig 1-2).
There are two types of receptors for neurotransmitters. One is the ionotropic receptors whose activation results in an increase in the permeability of the membrane to certain ions. Ion influx through the receptors alters the membrane potential, thereby eliciting rapid signaling. Another is the metabotropic receptors which trigger activation of various intracellular signaling molecules such as GTP-binding proteins, thereby eliciting relatively slow responses. In case of the ionotropic receptors, whether they are excitatory or inhibitory depends on the charge of ions that they permeate to which direction. In the mammalian central nervous system, ionotropic glutamate receptors influx Na+, thereby depolarizing the membrane and triggering an excitatory postsynaptic potential (EPSP).
Conversely, ionotropic GABA receptors allow influx of Cl–, thereby hyperpolarizing the membrane and triggering inhibitory postsynaptic potentials (IPSPs). Likewise, the currents mediated by these ionotropic receptors can be measured as excitatory postsynaptic currents (EPSCs) and inhibitory postsynaptic currents (IPSCs) using the patch-clamp recording under the voltage-clamp mode (see the Chapter 2 for more details on the electrophysiological recording).
6 Fig. 1-1. The schema of neuron
A cell body of a neuron extends branches (dendrites) on which other neurons form synapses, and an axon that, in turn, make connections with other neurons
Figure 1-2. Synaptic transmission
Synapses are contact points between nerve cells or between nerve cells and their targets where signals are transmitted on from one cell to the next. At chemical synapses, the neurotransmitters released from the presynaptic terminal activate receptors in the postsynaptic membrane.
7
1.2. Parameters that determine the strength of neurotransmission
One of the most prominent features in neurotransmitter release is their quantal nature. Pioneering work by Katz and colleagues revealed that neurotransmitters are released as a shape of quantal packets of neurotransmitters (del Castillo and Katz, 1954; Katz and Miledi, 1969).
Fatt and Katz obtained the first clue as to the quantal nature of synaptic transmission when they made recordings from the neuromuscular junction (NMJ) of the frog without presynaptic stimulation and observed small spontaneous postsynaptic potentials of about 0.5 mV (Fatt and Katz, 1952).
Because the synaptic potentials at vertebrate nervemuscle synapses are called end-plate potentials (EPPs), Fatt and Katz called these spontaneous potentials miniature EPPs (mEPPs). They reduced the amplitude of the evoked EPPs by lowering the extracellular calcium and adding extracellular magnesium. Under these conditions the responses fluctuated in a stepwise manner. Some stimuli produced no response at all; a failure of transmission. Some stimuli produced a response similar in size and shape to a mEPP. Others evoked responses that appeared to be two, three, or four times larger.
This remarkable observation led them to propose the quantum hypothesis: that the single quantal events observed to occur spontaneously also represented the building blocks for the synaptic potentials evoked by stimulation.
8 Fig1-3. Frog neuromuscular junction
A. A sketch of a terminal of a motor axon at the frog neuromuscular junction. Synaptic vesicles are clustered in the nerve terminal. B. miniature EPPs occur spontaneously and are confined to the end-plate region of the muscle fiber. C. presynaptic release of ACh was reduced by lowering the calcium concentration in the bathing solution. Sets of intracellular records, showing three superimposed responses to nerve stimulation, the amplitude of the EPP varies in a stepwise fashion. (Modified from “From Neuron to Brain fifth edition”; Fatt and Katz, 1952; del Castillo and Katz, 1954)
The quantum hypothesis was addressed by del Castillo and Katz using statistical analysis of the EPPs (del Castillo and Katz, 1954). When the NMJ is bathed in a solution low in calcium, all evoked
9
EPPs larger than the quantal synaptic potential are integral multiples of the unit potential. When the external calcium concentration is increased, the amplitude of the unit synaptic potential does not change. However, the number of failures decreases and the incidence of higher-amplitude responses increases. These observations demonstrate that alterations in external calcium concentration do not affect the size of a quantum of transmitter but rather affect the average number of quanta that are released in response to a presynaptic action potential.
Shortly after Katz and his colleagues demonstrated by electrophysiological methods that transmitter release was quantal, the electron micrographs of the NMJ revealed that axon terminals contain many small membrane-bound synaptic vesicles (Reger, 1958; Birks et al., 1960). Thus, it was suggested that a quantum of transmitter corresponds to the content of a single vesicle.
The amount of neurotransmitter released from presynaptic terminals is therefore determined by the number of available vesicles, the probability of the available vesicles to be released, and the amount of neurotransmitter in a vesicle. The strength of neurotransmission, which can be measured electro- physiologically as postsynaptic currents (PSCs), can be therefore described as the product of these
parameters;
PSCs = N × Pr× q
where N, Pr, and q represent the number of release sites (or the number of vesicles available for release), release probability, and the quantal size, respectively (del Castillo and Katz, 1954). The quantal size is, unlike other parameters, defined by both the amount of neurotransmitters from a single vesicles and the sensitivity of postsynaptic receptors. This corresponds to the magnitude of the current
10
evoked at the postsynaptic membrane via ionotropic receptors activated by neurotransmitter released from a single SV, which is the miniature excitatory postsynaptic current (mEPSC) for excitatory synapses.
1.3. Synaptic vesicle recycling
Upon the arrival of action potentials, the voltage-dependent Ca2+ channels open and a transient calcium influx into the presynaptic terminals triggers exocytosis of SVs, and therefore discharge of neurotransmitters to the synaptic cleft. After exocytosis, SV constituents are retrieved by a process, called endocytosis. Newly formed SVs that are subsequently re-acidified and refilled with neurotransmitters undergo the next rounds of exocytosis (Fig 1-4). As such, SVs are recycled locally at the presynaptic terminals for sustained neurotransmission. In the following section, I will describe brief overview of current knowledge on SV recycling (Südhof and Rizo, 2011).
1.3.1. Exocytosis
Exocytosis of SVs is achieved by the cooperative actions of a number of intracellular proteins, principally by SNARE proteins that mediate the fusion between the vesicle membrane and the presynaptic plasma membrane (Jahn and Fasshauer, 2012; Sühof and Rizo, 2011). One SNARE protein, synaptobrevin/VAMP2 sits on the SV membrane (vesicle-or- v-SNARE), whereas two SNARE proteins called syntaxin 1 and SNAP-25 reside on the plasma membrane (target-or-r- SNARE). Their assembly is shown to be sufficient to promote membrane fusion by making two
11
opposing membrane close enough to merge in vitro (Weber et al., 1998).
Besides the SNARE proteins, synaptotagmin 1 and Munc-18 play important roles in synaptic vesicle fusion. Synaptotagmin 1 is a type I transmembrane protein which is expressed on the SV membrane and has low binding affinity to Ca2+ (Zhou et al., 2015) Multiple lines of evidence suggest that it is synaptotagmin 1 that synchronizes the activity-dependent Ca2+ influx through presynaptic Ca2+
channels to rapid exocytosis of SVs (Rizo et al., 2006). Although the mechanism of synaptotagmin 1 in Ca2+-dependent exocytosis is not completely understood, it has been proposed that its interaction with both SNAREs and/or acidic phospholipids at the plasma membrane is involved (Chapman, 2008).
Munc 18 in mice is a cytosolic protein, which was originally identified as a binding partner of syntaxin 1 (Hata et al., 1993). The precise action of Munc-18 in exocytosis is also unclear. However, the deletion of munc-18 in mice completely abolished exocytosis in neurons, indicating its pivotal role in neuronal exocytosis (Verhage et al., 2000).
In addition to SV proteins, scaffolding proteins at the active zone, a confined area at the presynaptic terminal where SV exocytosis occurs, such as RIMs (Wang et al., 1997; Wang et al., 2000), CAST, Bassoon and Piccolo (tom Dieck et al., 1998; Wang et al., 1999; Fenster et al., 2000), also contribute to regulate SV exocytosis, although many of them are not necessary but serve regulatory roles in exocytosis.
1.3.2. Endocytosis
After exocytosis, the components of the SV membrane are retrieved from the plasma membrane
12
and recycled into new SVs. At the classical endocytotic pathway, vesicles flatten completely into the plasma membrane following exocytosis, and vesicle constituents are retrieved via clathrin-coated pits (clathrin-mediated endocytosis; CME) (Heuser and Reese, 1973). Dynamin is critical for membrane fission of clathrin-coated vesicles from the presynaptic plasma membrane. After the fission, vesicles lose their coats to reform SVs and are refilled with transmitter. In contrast, following intense stimulation, a second pathway is activated in which vesicles pass through endosome-like structures that appear transiently in the cytoplasm. The endosomes are probably the result of direct retrieval of large pieces of membrane from the plasma membrane, which is called bulk endocytosis (Wu et al., 2007). Alternatively vesicles do not always collapse fully into the terminal membrane but instead form a transient fusion pore, after which they are recovered directly into the cytoplasm (kiss-and-run exocytosis). In this mode, vesicle contents are discharged partially or completely, depending on the size of the pore and duration of the pore opening (He et al., 2006; He et al., 2007). However, the presence of kiss and run mode of exocytosis is a matter of debate. Recently, “ultrafast endocytosis”
has been proposed that is specialized to rapidly restore the surface area of the membrane (Watanabe et al., 2013). As will be discussed in the following section (‘Functional vesicle pool’), a time required
for endocytosed vesicles to return to recycling vesicle pool would potentially limit the availability of vesicles for exocytosis at presynaptic terminals.
1.3.3. Re-acidification
After endocytosis, the activity of vaculolar-type H+ ATPase (V-ATPase) generates an H+
13
electrochemical gradient (ΔµH+) across the SV membrane. The V-ATPase structurally resembles with mitochondrial F0F1-ATP synthase. Like the F0F1-ATP, it consists of a peripheral V1 domain which is responsible for ATP hydrolysis and an integral V0 domain which is responsible for H+ transport (Marshansky et al., 2014). Whereas F0F1-ATP synthase is an enzyme that produces ATP molecules
by using an H+ electrochemical gradient across the mitochondrial membrane, the V-ATPase does the opposite task. The ΔμH+ consists of two components; a chemical gradient (ΔpH) and a membrane potential (ΔΨ). Since the V-ATPase is an electrogenic pump, shunting ionic currents are needed for
sufficient transport of protons. In synaptic vesicles, Cl- is a candidate for this shunt, thus promoting ΔpH rather than ΔμΨ, although molecular identify of the Cl- permeation has been enigmatic. It is also
known that SVs contain cation/H+ exchanger that essentially dissipates ΔpH. Since the proportion of ΔΨ and ΔpH has impact on neurotransmitter loading into synaptic vesicles (see below), changes in activities of these enigmatic ion transporters on synaptic vesicles might regulate neurotransmitter contents.
14
Figure 1-4. Synaptic vesicle recycling (modified from Südhof and Rizo, 2011)
Before synaptic exocytosis, SVs are docked at the active zone, and primed via an ATP-dependent process.
Following calcium influx through voltage-gated calcium channels, they undergo exocytosis and release neurotransmitter to the synaptic cleft. Exocytosis occurs at release sites mainly within specialized areas of the presynaptic membrane, called active zones, which are defined by their spatial proximity to voltage- activated calcium channels and by the presence of scaffolding proteins. Endocytosis of SV membranes occurs within the periactive zone that surrounds the active zone area. SV endocytosis is predominantly mediated by a clathrin-and dynamin-dependent pathway. Kiss-and run mode of exocytosis has been postulated, though a matter of debate. Newly-endocytosed SVs are energized by the activity of the V-ATPase that drives neurotransmitter refilling into SVs for the next round of exocytosis.
1.3.4. Vesicular neurotransmitter uptake
Unlike plasma membrane neurotransmitter transporters that utilize Na+ gradient across the plasma
15
membrane, uptake of neurotransmitters into synaptic vesicles depends on a H+ electrochemical gradient (ΔμH+) that is generated by the V-ATPase. A relative requirement of the two components of ΔμH+ (ΔΨ or ΔpH) for the uptake of neurotransmitter depends on the charge of the substrate. Uptake
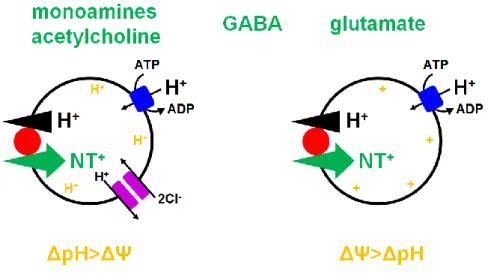
of positively-charged transmitters such as monoamine and acetylcholine depends predominantly on ΔpH, whereas that of negatively charged transmitters such as glutamate depends on ΔΨ. Uptake of
zwitter-ionic transmitters such as GABA and glycine depends equally on both of the components (Fig 1-5) (Edwards, 2007).
Figure 1-5. Vesicular neurotransmitter uptake (Modified from Edwards, 2007)
The movement of H+ down their electrochemical gradient is coupled to the transport of transmitter in the opposite direction. Despite this common H+ exchange mechanism, different vesicular neurotransmitter transporters rely to differing extents on the two components of the H+ electrochemical gradient, the chemical gradient ΔpH and the electrical gradient ΔΨ. Vesicular monoamine and ACh transport, which involves the exchange of protonated cytosolic transmitter for two luminal H+, involves more H+ than charge movement and hence depends more on ΔpH than ΔΨ. Conversely, transport of negatively charged glutamate depends more on ΔΨ than ΔpH. Transport of the zwitterion GABA with no net charge equally depends on both ΔpH and ΔΨ.
16
In consistent with distinct bioenergetics of the vesicular transporters, there are five transporter families that are structurally distinct, vesicular monoamine transporter1/2 (VMAT1/2), vesicular acetylcholine transporter (VAChT), vesicular glutamate transporter1~3 (VGLUT1~3), vesicular GABA/inhibitory amino acid transporter (VGAT/VIAAT), and vesicular nucleotide transporter (VNUT) (Omote and Moriyama, 2013). In the following paragraph, I will focus on the VGLUTs, since the preparations that I used throughout the study were glutamatergic synapses that utilize VGLUTs for vesicle refilling.
The VGLUTs belong to the solute carrier (SLC) 17 family that includes the type I phosphate transporter. VGLUT1 and VGLUT2 were originally identified as plasma membrane inorganic phosphate transporters. In fact, heterologous expression of the proteins conferred Na+-dependent Pi uptake activity to xenopus oocytes. However, they were localized preferentially to synaptic vesicles of seemingly glutamatergic neurons in rodent brains and the expression of these proteins conferred an ability to transport glutamate into intracellular acidic compartments. Although transport properties, such as substrate specificity and affinity of VGLUT1 and VGLUT2 were indistinguishable, VGLUT1 and 2 show a mutually exclusive distribution in the mammalian CNS (Fremeau et al., 2004).
VGLUT1 is strongly expressed in the cerebral cortex and hippocampus, whereas VGLUT2 is expressed in the thalamus, brainstem, and deep cerebellar nuclei. In the cerebellum, parallel fiber express VGLUT1, whereas climbing fiber terminals express VGLUT2 (Fremeau et al., 2002).
Indistinguishable from the wild type at birth, VGLUT1 knockout (KO) mice older than 2 to 3 weeks fed poorly and do not survive unless cared individually. After weaning, they can survive
17
independently for several months, but show progressive neurological phenotypes that included blindness, incoordination, and an enhanced startle response (Fremeau et al., 2004; Wojcik et al., 2004).
VGLUT2 KO mice die at birth that demonstrates the importance of VGLUT2 in early development and its predominance in the brainstem and pons, in which the neurons controlling the basic functions of respiration and the autonomic nerve system reside (Moechars et al., 2006; Wallen-Mackenzie et al., 2006).
VGLUT3 is expressed in a small population of neurons that were not considered as glutamatergic neurons. VGLUT3 KO mice showed subtle global deficiencies, although they were found to be deaf due to the degeneration of inner hair cells in the organ of Corti (Seal et al., 2008).
1.4. Functional vesicle pools
Not all synaptic vesicles clustered at the presynaptic terminals are constantly engaged in vesicle recycling. Rather, vesicles are divided into three functionally distinct vesicle pools; a readily releasable pool (RRP), a recycling pool, and a reserve pool (Rizzoli and Betz, 2005). Synaptic vesicles in the RRP are immediately available on stimulation. These vesicles are generally thought to dock at the presynaptic active zone, and prepared for immediate release ("primed"). Vesicles in the recycling pool maintain release during relatively mild stimulation. This pool is thought to contain about 5~20 % of all vesicles that are continuously recycling to sustain transmitter release. The reserve pool is defined as a depot of synaptic vesicles from which release is only triggered during intense stimulation.
These vesicles constitute the majority (typically 80~90 %) of vesicles in most presynaptic terminals.
18
These distinct vesicle pools have been investigated using techniques such as electrophysiology and electron and fluorescence microscopy. The main characteristics of the vesicles pools in two preparations, rodent cultured hippocampal neurons and rodent calyx of Held neurons in slice preparation, are summarized below.
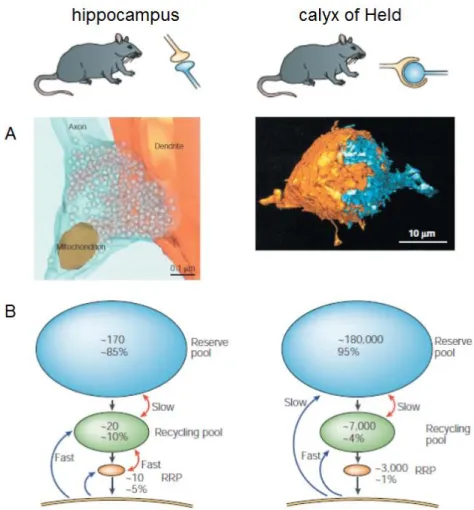
In cultured hippocampal neurons, the total vesicles population in each bouton comprises 100~200 vesicles (Schikorski & Stevens, 1997). A RRP in this type of synapses, consisting of only 5~20 vesicles, is experimentally defined as vesicles released by hypertonic shock, indicating that they are adjacent to the plasma membrane and fully primed (Rosenmund and Stevens, 1996). A recycling pool comprises 10~20 % of the vesicles (Harata et al., 2001), and the rest represents the resting pool. In contrast, a giant calyx of Held presynaptic terminal contains a much larger number of vesicles, approximately ~200,000 in total (de Lange et al., 2003). At postnatal day (P) 8~11, the RRP consists of ~ 2,500 vesicles (Sakaba and Neher, 2001) and the recycling pool consists of ~10,000 vesicles (Fig 1-5) (de Lange et al., 2003). Interestingly, inhibition of cyclin-dependent kinase 5 (CDK5), a kinase implicated in neural development and signaling, strongly shifted a portion of the reserve pool to the recycling pool, leading to a presynaptic potentiation (Kim and Ryan, 2010). Thus, functional vesicle pool is inter-changeable depending on the usage, and therefore contributing to various types of presynaptic regulation in the physiological and pathological context.
19
Fig. 1-6. Characteristics of the functional synaptic vesicle pools. (Modified from Rizzoli and Betz, 2005) Left is a typical image of the rat cultured hippocampal synapse, and right is that of the rat calyx of Held synapse. A. Three dimensional reconstruction (left; a bouton. Right; presynaptic terminal in orange and postsynaptic cell in blue.) B. Pool size and mixing rates. Blue arrows indicate endocytosis and red arrows indicate mixing between pools.
1.5. Presynaptic regulation of quantal size
Classically, it has been considered that the amount of neurotransmitters in individual vesicles is constant and not regulated under physiological conditions. However, this notion has not been tested due to the lack of suitable experimental techniques and in-depth quantitative analyses. In this thesis, I attempted to develop such techniques and analyses to better understand whether neurotransmitter leak can occur. This would fill our knowledge gap in the synaptic physiology and provide insights into the sustainability and energetics of the presynaptic machinery. In the following sections, I will
20
briefly discuss current knowledge and concepts in respect to the presynaptic regulation of quantal size with special focus on glutamatergic synapses.
1.5.1. Cytosolic neurotransmitter concentrations
Biochemical assays using isolated SVs have suggested that the rate of substrate transport as well as the amount of substrates accumulated into vesicles depend on the transmitter concentration in the cytosol (Naito and Ueda, 1985; Maycox et al., 1988). In case of glutamatergic synapses, physiological cytoplasmic glutamate concentrations are estimated to be 3~5 mM at the calyx of Held (Ishikawa et al., 2002). Neurotransmitter glutamate is synthesized locally at the presynaptic terminal from glutamine by the activity of phosphate-activated glutaminase (PAG), therefore the expression of PAG might play important roles in glutamatergic transmission. However, basal glutamatergic transmission was intact in PAG-knockout mice, indicating other synthetic pathways for neurotransmitter glutamate (Masson et al., 2006).
Impacts of presynaptic glutamate concentration on synaptic transmission was directly investigated using the calyx of Held synapses as a model (see also below (1.6. Calyx of Held). In support with in vitro observations, loading of high concentration of glutamate into the presynaptic terminal via whole-
cell dialysis resulted in marked enhancement of EPSC (Ishikawa et al., 2002; Yamashita et al., 2003).
On the other hand, glutamate washout from the presynaptic terminals caused a gradual rundown of EPSCs, collectively indicating that cytosolic glutamate concentrations might affect the quantal size (Ishikawa et al., 2002; Hori and Takahashi, 2012).
21
1.5.2. Regulation of the driving force
Since vesicular neurotransmitter transporters are secondary transporters that critically depend on the driving force supplied by the V-ATPase, changes in the driving force might have a substantial
impact on the rate and the amount of transmitters transported into vesicles. As explained in 1.3.4, the contributions of either ΔΨ or ΔpH on transmitter uptake vary depending on transmitters and the
balance of two components is regulated mainly by extravesicular (cytosolic) Cl– concentrations (Edwards, 2007). In case of positively charged transmitters such as monoamines and acetylcholine, high concentrations of Cl– facilitates ΔpH, resulting in larger uptake. In contrast, glutamate uptake exhibits an unusual Cl– dependency (Naito and Ueda, 1985): Uptake is most efficient at medium Cl- concentration but becomes sub-maximal at high or low concentrations. While attenuation of transport by high concentration of Cl– may be explained by the reduction of ΔΨ, the transport activity is also reduced at low Cl– concentrations. The reason for this biphasic effect of Cl– on glutamate transport has been enigmatic, and direct activation of VGLUTs by Cl– ions has been proposed (Bellocchio, 2000). Whatever the mechanism is, the biphasic Cl– dependency of glutamate uptake was recapitulated in the calyx of Held synapses, where glutamate transport into vesicles were assessed under various cytosolic Cl– concentrations (Hori and Takahashi, 2012). Contributions of cytosolic cations on quantal size of glutamate were also demonstrated in the calyx of Held. In consistent with
biochemical observations that cation/H+ exchanger expressed on SVs enhances ΔΨ in the expense of ΔpH, removal of K+ from the terminals attenuate glutamate release, presumably due to reduced ΔΨ (Goh et al., 2011). Furthermore, Na+ influx into the terminals via HCN channels during intense
22
stimulations caused an increase of quantal size (Huang and Trussell, 2014).
1.5.3. Transporter expression
Increase in the expression of transporters on vesicles would, theoretically, affect the transport rate rather than the final concentration of transmitter in the lumen. However, overexpression of vesicular transporters in various preparations resulted in increase of transmitter contents. For instance, overexpression of VGLUT1 in hippocampal neurons caused a significant increase in the mEPSC amplitudes (Wojcik et al., 2004; Wilson et al., 2005), indicating an increase of the quantal size.
Consistently, the remaining mEPSCs in VGLUT1 knockout neurons were significantly smaller than those in wild-types neurons (Wojcik et al., 2004). Moreover, in drosophila mutants that overexpress drosophila VGLUT (DVGLUT) in motor neurons exhibited an increase in the quantal size (Daniels et al., 2004). In the latter case, increase in the vesicular volume was evident, implying a possible mechanism for the increased quantal size. Despite the clear evidence for the enhanced quantal size by the increased transporter expression, other work suggested that expression levels of VGLUTs do not affect quantal size. First, neurons derived from VGLUT1-heterozygous knockout mice that express ~ 50 % of VGLUT1 compared to wild-type did not display any changes in mEPSC amplitudes (Wojcik et al., 2004; Fremeau et al., 2004). Also, neuromuscular junctions of drosophila mutants that expressed minimum levels of DVGLUT exhibited only reduction in a frequency of miniature events but not in their amplitudes (Daniels et al., 2006). Currently, there is no coherent model that can explain all the observations described above.
23
1.5.4. Leakage at equilibrium
The amount of transmitters in a vesicle might be set at a balance between active transport via the transporters and passive leakage either via reverse transport or via non-specific leakage through the membrane. Indeed, isolated vesicles from rat brains lost their contents (glutamate and GABA) during purification process, which could be prevented when the V-ATPase was kept working (Burger et al., 1989), indicating a pathway for leakage. However, since the vesicle isolation required relatively long time (several hours to 2 days), contributions of the transmitter leakage on synaptic transmission during a short period remained unclear.
With in vitro assays, relatively fast glutamate leakage (< several min) from vesicles was observed only when vesicles were imposed to pharmacological manipulations that selectively dissipated ΔpH
after glutamate transport reached at equilibrium (Wolosker et al., 1996). Furthermore, when vesicle acidification was monitored in the presence of glutamate uptake, an addition of bafilomycin A1 (Baf ), the specific inhibitor of the V-ATPase, caused a fast alkalization whose kinetics was distinct from that of vesicles pre-acidified by Cl– (Hnasko et al., 2010). These observations supported a concept that glutamate can leak out of vesicles once the driving force was modulated.
In contrast to in vitro assays, application of Baf to neural preparations resulted in somewhat contradicting observations. By using hippocampal cultured neurons, Zhou et al. demonstrated that mEPSC amplitudes were slightly reduced after a long incubation with Baf (Zhou et al., 2000). In parallel, the frequency of miniature events was dramatically reduced, leaving a possibility that miniature events from partially-filled vesicles had eluded detection. Conversely, another study using
24
autaptic cultures derived from hippocampus demonstrated that Baf application did not reduce mEPSC amplitudes at all (Ikeda and Bekkers, 2009). The gradual EPSC rundown after a brief Baf application was, therefore, explained solely by accumulation of empty recycling vesicles that had released their content by exocytosis. One of the intrinsic problems using Baf to block glutamate refilling was that Baf is a membrane permeable reagent that may also produce unexpected effects on properties of synaptic membranes such as the permeability, stability, and lipid dynamics. Indeed, it was demonstrated that Baf induced a rapid increase in release probability during application, which may cause a rapid depletion of some recycling vesicle pools (Zhou et al., 2000), contributions of which had not been considered carefully in the previous analysis. Thus, it is still controversial whether neurotransmitter can leak out of SVs in native nerve terminals.
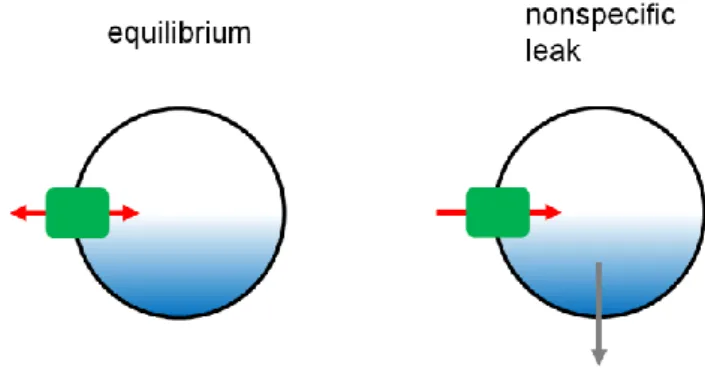
Fig 1-7. Leakage at equilibrium (Modified from Edwards, 2007)
There are two possible pathways for neurotransmitter leakage from SVs. Left: At equilibrium, the ionic coupling of vesicular neurotransmitter transporters together with the H+ electrochemical driving force should dictate the direction transmitter movements through the respective transporters. Right: Depending on properties of neurotransmitters, there is a nonspecific leak through vesicle membranes which is not mediated by the neurotransmitter transporters.
25
1.6. Aim of this work
Glutamate leakage from SVs can directly alter the quantal size and could be one of the critical determinants of synaptic transmission. However, characterizing the leak pathway and its mechanism has been proven difficult in living neurons due to the lack of techniques. Instead of the pharmacological blockade of the V-ATPase, previous work in Takahashi’s laboratory has taken advantages of the giant calyx of Held synapses, in which cytosolic glutamate could be dialyzed through a patch pipet to minimize glutamate refilling into newly-formed SVs specifically. Although unexpected side effects of the mechanical membrane rapture and the dialysis of cytosolic components indispensable for synapse functions could not be completely ruled out, this manipulation provided an alternative method to track glutamate leakage from preloaded vesicles.
Interestingly, glutamate washout caused rundown of the EPSC and mEPSC amplitudes, similar to that under Baf application (Zhou et al., 2000), but the magnitudes of rundown differed between EPSCs and mEPSCs, with a steeper decline in the evoked EPSC amplitudes (Ishikawa et al., 2002;
Wu et al., 2007). One of the explanations for such a difference was that, as described above for Baf experiments, leakage of glutamate from synaptic vesicles can increase the number of undetectable events which could not be detected beyond the background noise. Alternatively, as shown in the previous studies, contributions of spontaneously fusing vesicles between stimulation pulses on the rundown of the evoked EPSCs (assuming that the same vesicle pool is used both for spontaneous release and activity-dependent exocytosis) were not carefully considered to explain faster rundown of the evoked EPSCs. In other words, spontaneous events accumulate empty vesicles and one does
26
not have to assume leakage of glutamate from synaptic vesicles.
In this thesis, I attempted to clarify impact of glutamate leakage on quantal size regulation by analyzing the quantal size during glutamate washout from the presynaptic terminals of the calyx of Held. First, I performed a series of experiments to clarify whether, and to what extent, glutamate can leak out of vesicles during glutamate washout by monitoring mEPSCs under minimum stimulation conditions. Next, I attempted to examine whether glutamate washout would alter quantal size during high frequency stimulation. For this purpose, I developed a novel analytical method, by which quantal sizes during evoked release could be estimated.
1.7. Calyx of Held
Throughout this study, I used the calyx of Held synapses as a model synapse. The calyx of Held is a giant nerve terminal located in the auditory brainstem, superior olivary complex. Auditory signals arriving at the cochlea are transmitted to the ipsilateral anterior ventral cochlear nucleus by excitatory synapses onto globular and spherical bushy cells. The axons of globular bushy cells cross the brainstem midline and make a synaptic contact onto the principal cells of the contralateral medial nucleus of the trapezoid body (MNTB). These myelinated axons have a large diameter, allowing a fast conduction velocity, and give rise to the calyx of Held. Thanks to their exceptionally large structures, various molecules can be directly loaded into the calyx of Held via whole-cell patch pipettes, while simultaneous recording from both the presynaptic terminal and the postsynaptic cell are possible (Hori et al., 1999; Takahashi et al., 2000). Although calyx of Held is large, electron
27
microscopic studies revealed that individual active zones, which are separated by 0.4 µm (Meinrenken et al., 2002), resemble those of small conventional synapses found in other regions of the mammalian CNS (Lenn and Reese, 1966). Throughout its postnatal developmental period, a single calyx synapse express both VGLUT1 and VGLUT2, and they exhibit segregated localizations within the synapse (Billups, 2005).
The large size of the presynaptic terminal allows us to remove cytosolic glutamate through the patch pipettes, which cannot be done in conventional synapses such as those in cultured hippocampal preparation. In addition, because the terminal makes a synapse directly onto the postsynaptic soma, postsynaptic events such as EPSCs and mEPSCs could be reliably measured using voltage clamp. We took advantage of this unique preparation to measure the impact of glutamate washout and address the issue of glutamate leakage on synaptic transmission in the present study.
28
2. Materials and Methods
2.1. Ethical approval
All experiments were performed in accordance with the guideline of the Physiological Society of Japan and Doshisha University, and were approved by the local committee for handling experimental animals in Doshisha University.
2.2. Preparation of slices for patch clamp experiments
2.2.1. Slicing
C57BL6 mice at postnatal day (P) 12- to -15 were deeply anaesthetized by inhalation of isoflurane (Wako Chemicals, Japan) and killed by decapitation prior to rapid dissection of the brain. This procedure took within 1~1.5 min. The tissue was kept cold throughout sectioning, thereby presumably minimizing damage from anoxia and improving the texture of the tissue for slicing. For this purpose, the tissue was submerged in ice-cold cutting solutions (mM): 234 sucrose, 2.5 KCl, 1.25 NaH2PO4, 10 MgCl2, 0.5 CaCl2, 26 NaHCO3, 11 glucose (nacalai tesque, Japan). Mechanical stability of the tissue is essential for making thin slices. For this purpose, the brainstem containing the calyx of Held- MNTB region was cut by hand. A surface of this block, trimmed parallel to transverse of the slices, was glued to the stage of the slices. The slicing chamber was immediately filled with physiological saline and surrounded with ice while slicing. A vibrating microslicer (VT1200S, Leika, Germany) was used to cut slices of 175 μm thickness. After sectioning, each slice was immediately placed in oxygenated artificial cerebrospinal fluid (aCSF) containing (mM): 125 NaCl2, 2.5 KCl, 26 NaHCO3,
29
1.25 NaH2PO4, 2 CaCl2, 1 MgCl2, 10 glucose, 3 myo-inositol, 2 sodium pyruvate, and 0.5 ascorbic acid (pH 7.3 with 95% O2, 5% CO2, 310 mosmol/kg) at 37℃, where it remains until use. In order to ensure efficient oxygenation and continuous movement of the solution, the slices were bubbled directly from below. A method using simple disposable accessories is illustrated in Fig 2-1.
2.2.2. Mechanical fixation for recording
One slice at a time was placed in the glass bottomed recording chamber and held in place with a grid of parallel nylon thread (Fig2-1). Such a grid, placed over the slice, held it firmly in position on the bottom of the recording chamber.
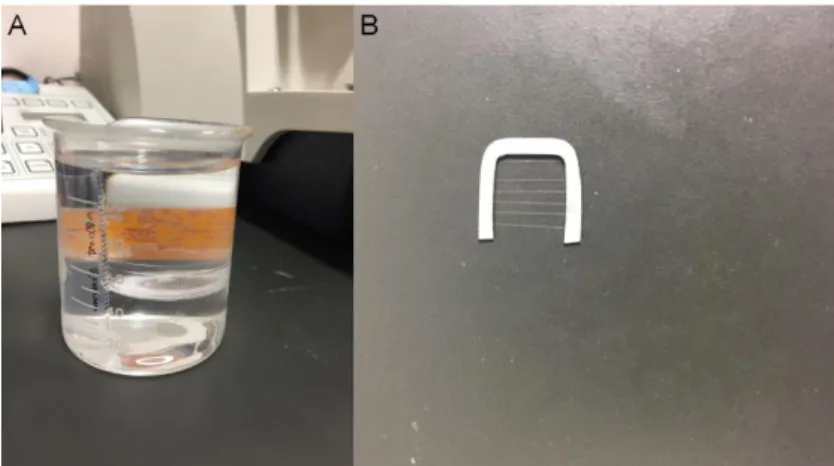
Figure 2-1. Accessories for maintenance and mechanical fixation of slices.
A. Maintenance of slices following sectioning. A holding chamber is placed on top of a 50 ml beaker. A suitable chamber is made by breaking the top and bottom out of a small plastic Petri dish, forming two rings. The ring formed from a lid is made so that, when inverted, it fits tightly onto the lip of the base. A piece of fine cotton mesh is stretched over the ring made from the base and can be clamped in place by the ring made from the lid. B. Grid fir mechanical fixation of the slice during recording, the slice is fixed on the bottom of the recording chamber by a grid of nylon threads glued to a platinum frame.
30
2.2.3. Optical setup
An upright microscope (Axioskop, Carl Zeiss, Germany) with Nomarski optics was used to see the upper surface of the slice. Two changes have been made to the microscope which make recording easier. The focusing mechanism has been altered to move the objective instead of the stage. A hinge has been added to the microscope frame so that the top half of the microscope can be tipped back making it much easier to place the patch pipettes in position in the bath. The objective is an Achromat 60×water immersion lens (LUMPlanFl, Olympus, Tokyo) with a working distance of 1.6 mm. For improved visibility when using thicker slices, a black and white television camera was attached to the microscope via an adapted phototube. All procedures were then observed on a screen.
2.3. Whole-cell patch clamp recordings
2.3.1. Whole-cell recording
The patch clamp technique offers an increased resolution in the recording of currents across cell membrane. The development of the patch clamp by Neher, Sakmann, and their colleagues, has made an enormous contribution to the knowledge of the functional behavior of membrane channels (Hamill et al., 1981). Patch clamp recordings involve sealing the tip of a small (1 μm internal diameter) glass pipette to the membrane of a cell. Patch pipettes were pulled from borosilicate glass (GC150F-10, HARVARD APPARATUS, UK). The pipettes are pulled using a micropipette puller (MODEL P-97, Sutter Instrument, USA) and standard Nichrome heating coils supplied with it. In the pull, the capillary is thinned to obtain a tip diameter of 1~5 μm. Due to the small working distance (1.6 mm)
31
of the water immersion objective, the pipette approached the neurons at a low angle (~15° to the
horizontal plane). Under ideal condition, with slight suction on the pipette, a seal resistance of greater than 10 GΩ is formed around the rim of the pipette tip between the cell membrane and the glass. In
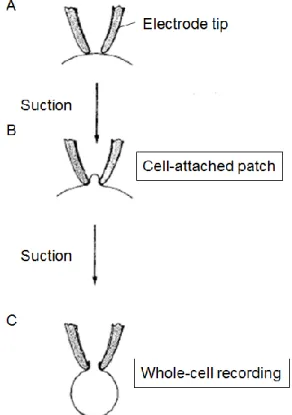
this thesis, I used the whole-cell recording configuration in which I applied slight additional suction to rupture the membrane inside the patch, thereby providing access to the cell cytoplasm (Fig2-2).
Figure 2-2. Patch clamp recording
Patch configurations are represented schematically. The electro forms a seal on contact with the cell membrane (A), which is converted to a gigaohm seal by gently suction (B). The membrane within the electrode tip may be ruptured by further suction to obtain a whole-cell recording(C) (modified from Hamill et al., 1981).
2.3.2. Simultaneous pre- and postsynaptic recordings
Simultaneous pre- and postsynaptic recordings from calyces of Held and the MNTB principal cells were made in the presence of 100 μM picrotoxin to block GABAA receptors, 0.5 μM strychnine to
32
block glycine receptors and D (-)-2-amino-5-phosphonopentanoic acid (D-AP5, 50 μM) to block N- methyl-D-aspartate receptors (Fig2-3).
Whole-cell recordings from calyx of Held and MNTB cells were made with an Axopatch 700A amplifiers. The postsynaptic pipette solution contained (mM): 140 CsCl, 40 Hepes, 5 EGTA, 1 MgCl2, 5 QX-314 (pH 7.3, 320 mosmol/kg). The presynaptic pipette solution contained (mM): 100 K methanesulfonate, 30 KCl, 40 Hepes, 0.5 EGTA, 12 phosphocreatine (Na salt), 3 ATP (Mg salt), 0.5 GTP (Na salt), 0 or 3 K glutamate (pH 7.3, 310-320 mosmol/kg). The postsynaptic pipette was pulled
to 5-7 MΩ and had a series resistance of 10-25 MΩ, which was compensated by up to 75% for a final value of 7 MΩ. The resistance of the presynaptic pipette was 7-10 MΩ, and series resistance was
typically 14-20 MΩ, which was not compensated. When the postsynaptic series resistance increased by > 15 MΩ during recording, data were discarded. The postsynaptic holding potential was -70 mV.
The liquid junction potential between pipette and external solution was not corrected. In simultaneous presynaptic and postsynaptic recordings, EPSCs were evoked by presynaptic action potentials elicited by a 1 msec depolarizing pulse (Takahashi et al., 1996).
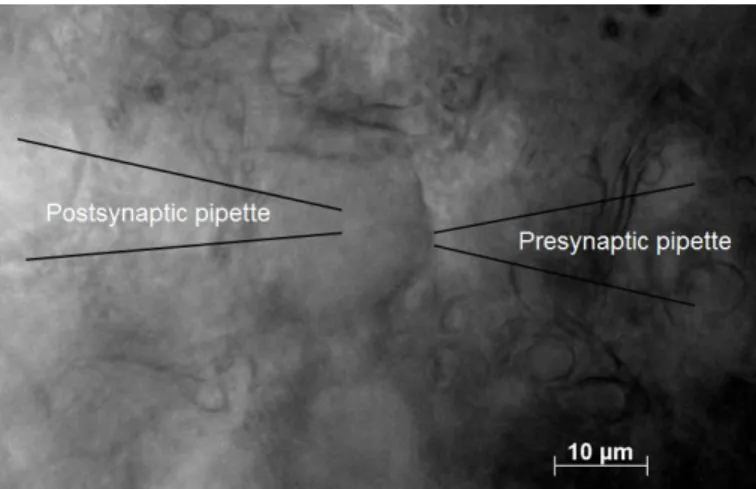
Figure 2-3. The simultaneous whole-cell recordings
The simultaneous whole-cell recordings from the calyx of Held (right) and MNTB principle cell (left).
Glass pipettes are patched to the calyx of Held and MNTB from both sides.
33
2.4. Capacitance measurement
Fusion of synaptic vesicles with the plasma membrane leads to a transient increase of membrane surface area, soon followed by a surface decrease corresponding to endocytosis. These changes in the cell surface area can be followed by monitoring the electrical capacitance of the cell. The starting point is a conventional whole-cell patch clamp recording, which can be modeled electrically by an access resistance in series with the parallel membrane resistance and capacitance. The circuit parameters in the model are typically estimated by applying sinusoidal command voltages to the patch pipette and by analyzing the resulting currents (Lindau and Neher, 1988).
Membrane capacitance measurements were made from calyx of Held presynaptic terminals in whole-cell configuration at room temperature (Yamashita et al. 2010; Eguchi et al. 2012). Calyceal terminals were voltage-clamped at a holding potential of -80 mV and a sinusoidal voltage command with a peak-to-peak voltage of 60 mV was applied at 1 kHz. The presynaptic pipette solution contained (mM): 125 Cs-methanesulfonate, 30 CsCl, 10 HEPES, 0.5 EGTA, 12 Na2-phosphocreatine, 3 MgATP, 1 MgCl2, 0.3 Na2GTP, 0 or 3 Cs-Glutamate (pH 7.3, 315-320 mosmol/kg). Single-pulse step depolarization (to +10 mV, 10 ms) was used to induce presynaptic ICa. Membrane capacitance (Cm) changes within 450 ms of square-pulse stimulation were excluded from analysis to avoid contamination by conductance-dependent capacitance artifacts (Yamashita et al, 2005). To avoid the influence of capacitance drift on baseline, we discarded data when the baseline drift measured 0-10 s before stimulation was > 5 fF/s. When the capacitance baseline drift was 1-5 fF/s, we subtracted a linear regression line of the baseline from the data for the baseline correction.
34
Data were acquired at a sampling rate of 100 kHz, using an EPC-10- patch-clamp amplifier controlled by PatchMaster software (HEKA Elektronik) after on-line filtering at 5 kHz. The recording pipette was pulled to 5-7 MΩ and had a series resistance of 9-14 MΩ, which was compensated by up to 50 % for a final value of 7 MΩ. Care was taken to maintain series resistance < 14MΩ to allow diffusion of drugs into the terminal.
For recording presynaptic Ca2+ currents, the aCSF contained 10 mM tetraethylammonium chloride, 0.5 mM 4-aminopyridine, 1 μM tetrodotoxin, 10 μM bicuculline methiodide and 0.5 µM strychnine hydrochloride.
The postsynaptic pipette solution contained (mM): 140 CsCl, 40 Hepes, 5 EGTA, 1 MgCl2, 5 QX- 314 (pH 7.3, 320 mosmol/kg). The presynaptic pipette solution contained (mM): 100 K methanesulfonate, 30 KCl, 40 Hepes, 0.5 EGTA, 12 phosphocreatine (Na salt), 3 ATP (Mg salt), 0.5 GTP (Na salt), 0 or 3 K glutamate (pH 7.3, 310-320 mosmol/kg).
2.5. Variance-mean analysis
Various forms of fluctuation analysis have been used in the past to estimate the quantal parameters, including N (number of release sites), Pr (release probability) and q (quantal size) (Silver et al. 1998;
Clements & Silver, 2000; Meyer et al. 2001). They are all based on the quantal theory, according to which the average evoked EPSC peak amplitude (I) is,
I = N×Pr×q (1) Knowing q, the quantal content (M) is readily obtained from:
35
M = N Pr = I /q (2) Assuming binomial statistics, the variance (σ2) of evoked EPSC peak amplitudes can be written as:
σ2 = Nq2 Pr (1 − Pr) (3) Dividing σ2 by I yields:
σ2/I = q(1 − Pr) (4)
If release probability were extremely low (Pr <<1), q can, thus, be approximated from the variance of evoked EPSC peak amplitudes divided by their mean amplitude (σ2/I).
For analysis, a suitable stretch of repetitively applied trains with sufficiently stable whole-cell parameters (Rs and leak current) was used. I applied a stimulation protocol consisting of 200 trains of 10 stimuli at 200 Hz, and repeated 30 times with a 100 msec intervals. Total stimulation period is 30 sec at this protocol. At the calyx of Held synapses, long lasting trains of stimuli induce noticeable synaptic depression, which has been proposed to result from depletion readily releasable pool. The release probability might be low during train (Pr <<1). In addition, a 100 msec interval between trains courses partial recovery from synaptic depression which developed during 200 Hz train stimulation.
To estimate quantal size during high frequency stimulation, the mean EPSC amplitudes and the variance of EPSC amplitudes were analyzed for last 30 trains. The mean amplitude of EPSCs and the variance of EPSCs are plotted on a graph, and slopes of variance–mean plots were estimated by linear regression.
36
2.6. Analysis of electrophysiological data
Signals were low-pass filtered at 5 kHz and digitized at 20 kHz with Digidata 1322A using pClamp 8 acquisition software (Molecular Devices).
2.6.1. Detection of mEPSCs with a scaled template
mEPSCs can be difficult to detect when their amplitudes are close to the background noise. For detecting mEPSCs, I used a sliding template method implemented in Axograph. The templates were made by initially averaging 50-150 mEPSCs selected manually. A waveform with the time course of the template was slid along the current or voltage trace and optimally scaled to fit the data at each position. The decay of averaged mEPSC was fitted by double exponential functions, and its weighted mean time constant (τm) was calculated from individual time constants (τ1, τ2) and their relative amplitude (a1, a2) as follows: τm= a1τ1 + a2τ2.
A detection criterion was calculated from the scaling factor and the quality of the fit. An event was detected when this criterion crosses a threshold level. Overlapped mEPSCs were excluded from analyses by visual inspection.
37 Figure 2-4. Detection of mEPSCs
A detection criterion, calculated from the optimally scaled template, was used to detect small synaptic events. A simulated data trace containing one mEPSC superimposed on recording noise. The mEPSC is 60 pA in amplitude and occur at 210 ms. A template with the same time course as the synaptic events (0.5 ms rise, 0.6 ms decay time constant), was stepped along the record. The detection criterion exhibits a sharo negative going peak when the template is optimally aligned with a synaptic event. With theh detection threshold set to -1.4 (dashed line).
2.6.2. mEPSC amplitude compensation
In the CNQX experiments, the mEPSC frequency should be constant even if CNQX concentration has a graded increase. However, mEPSC frequency decreased in proportion to mEPSC amplitudes.
This indicates that undetectable quantum increases with the mEPSC decreasing. The decreasing percentage of mEPSC frequency consists with undetectable quantum. In the glutamate washout experiments, the relationship between mEPSC frequency and undetectable quantum refer to the following table (modified from Fig 3-3D).
Normalized mEPSC frequency (Normalized EPSC amplitude)
The number of undetectable quantum/
total synaptic vesicle number of exocytosis
0.2 0.5
0.4 0.4
0.6 0.3
In the glutamate washout experiments, the decreasing percentage of mEPSC frequency consists with
-140 -120 -100 -80 -60 -40 -20 0 20
Currents (pA)
240 230
220 210
200
Time (ms)
-10 -8 -6 -4 -2 0 2
Detection Criteria
38
that of EPSC amplitude.
At the variance-mean analysis, I compensated the mEPSC amplitude assuming that undetectable mEPSC amplitudes were 0 pA.
2.7. Statistical analysis
All statistical analyses were performed using IBM-SPSS 24-sofware (SPSS Inc., Chicago, IL, USA).
The effects of glutamate washout were analyzed by a repeated-measures ANOVA with glutamate concentrations ([Glu]: 3mM, 0mM) as between-subjects factor and time (0, 10, 20, 30 min after glutamate washout) as within-subjects factor. The effects of Baf were equally analyzed by a repeated- measures ANOVA with drug (DMSO, Baf) as between-subjects factor and time (before drug application, 0, 10, 20, 30 min after drug application) as within-subjects factor. Bonferroni tests were used for post hoc comparisons. All data were expressed as mean ± S.E.M.
39
3. Results
3. 1. Washout of presynaptic cytosolic glutamate
Glutamate is concentrated in synaptic vesicles at 60-150 mM (Burger et al. 1989) by vesicular glutamate transporters (VGLUTs; Takamori et al. 2000; Bellocchio et al. 2000) using trans-vesicular proton gradient produced by the V-ATPase (Naito & Ueda, 1985). Endogenous cytosolic glutamate concentration in presynaptic terminals is estimated to be 1-10 mM at the calyx of Held in different postnatal periods (Ishikawa et al. 2002; Yamashita et al. 2009). In simultaneous whole-cell recordings from a calyx of Held presynaptic terminal and a postsynaptic MNTB neuron in slices of mice brainstem, I dialyzed presynaptic terminals with a glutamate-free pipette solution (Ishikawa et al.
2002; Yamashita et al. 2009; Hori & Takahashi, 2012). I then evoked EPSCs every 10 min (Fig. 3-1) and meanwhile recorded spontaneous mEPSCs, which represent quantal, or single vesicular, EPSCs at this synapse (Sahara & Takahashi, 2001). After glutamate washout, EPSCs decreased in amplitude with a time constant of 22 min, whereas mEPSC amplitude underwent a less significant decline with a tendency to reach a plateau (Fig. 3-1B). These results are similar to those reported by Ishikawa et al. (2002), where EPSCs are evoked at 0.1 Hz. During glutamate washout, mEPSC frequency significantly decreased from 33 ± 12 Hz to 3.6 ± 2.0 Hz (n=5 pairs) in 30 min (Fig. 3-1C). In control experiments, when glutamate was included in the presynaptic pipette at 3 mM, no significant change was observed in the mean amplitude of EPSCs, mEPSCs or the mean frequency of mEPSCs. The number of vesicles undergoing spontaneous exocytosis during glutamate washout was estimated as 24,700 ± 6,700 (n=5 pairs). This number could be an underestimate, because empty vesicles due to
40
glutamate washout should be added to this number. Thus, fast rundown of EPSCs can be explained, at least in part, by increased number of empty vesicles involved in EPSCs.
Fig 3-1. Rundowns of EPSCs and mEPSCs after whole-cell washout of cytosolic glutamate in the presynaptic terminal.
A. Sample traces of EPSCs and mEPSCs, before and 10-30 min after glutamate washout (lower traces, superimposed), and controls with 3 mM glutamate in presynaptic pipettes (upper traces). B. Mean amplitudes of EPSCs (triangles) and mEPSCs (circles) at different time periods after glutamate washout (filled symbols) or controls with 3 mM glutamate (open symbols). Each data derived from five experiments and normalized to the mean amplitudes at time 0 just after rupturing presynaptic membrane (ordinate). Error bars indicate + or - SEMs in this and following Figures. Exponential curves were best fit
41
to data points with an equation of 𝐼=𝐼0+ (1 − 𝐼0)𝑒−𝑡𝜏 , where the time constant (τ) and I0 was 22 min and 0, respectively for EPSCs, whereas 9.4 min and 0.65, respectively for mEPSCs. At time 0, mean amplitudes of evoked EPSCs was 7.5 ± 0.5 nA (3 mM Glu control, n=5 pairs) and7.8 ± 0.7 nA (0 mM Glu, n=5 pairs) and those of mEPSCs was 35 ± 1.4 pA (3 mM Glu control, n=5 pairs) and 43 ± 7.2 pA (0 mM Glu, n=5 pairs). Glutamate concentrations ([Glu]) had significant effects on the amplitude of mEPSCs (repeated-measures ANOVA: main effect of [Glu]: F1, 8 = 5.03, P> 0.05; main effect of time: F3, 24 = 8.3, P< 0.001; [Glu]×time interaction F 3, 24 = 4.2, P< 0.05) and that of EPSCs (repeated-measures ANOVA:
main effect of [Glu]: F 1, 7 = 31, P< 0.001; main effect of time: F1.4, 10 = 35, P< 0.001; [Glu]×time interaction F1.4, 10 = 18, P< 0.001). Miniature EPSC amplitudes between 0 min and 30 min without glutamate in presynaptic pipettes were significantly different (Bonferroni tests: P< 0.05). The difference in rundown magnitude between controls with 3 mM glutamate and those without glutamate was statistically significant for EPSCs at 10 min, 20 min and 30 min (Bonferroni tests: P< 0.01). C. Mean frequency of mEPSCs at different time periods after glutamate washout, normalized to the mean frequency at time 0. The mean frequency of mEPSCs at time 0 was 17 ± 1.3 Hz (3 mM Glu control, n=5 pairs) and 15 ± 4.2 Hz (0 mM Glu, n=5 pairs). Glutamate concentration had significant effects on the frequency of mEPSCs (repeated-measures ANOVA: main effect of [Glu]: F1, 8 = 7.4, P< 0.05; main effect of time: F 3, 24 = 9.7, P< 0.001; [Glu]×time interaction F 3, 24 = 5.4, P< 0.05). Statistical difference between controls and 0 mM glutamate was significant at 20 min (Bonferroni tests: P< 0.05) and 30 min (Bonferroni tests: P< 0.01). D. Representative amplitude histograms of mEPSCs (open bars) at different time periods after glutamate washout. Traces in inset show mEPSCs at a slow time scale in this Figure and Figure 2C.
Total number of events is 100 for each histogram. Background noise distributions (filled bar) were obtained from the baselines of records with no clear mEPSC events. Arrows indicate mean amplitude of mEPSCs in this Figure and Figure 2. Gaussian curves are fit to mEPSC amplitude histograms using the least-square method. The coefficient of variation (c.v.) of mEPSC amplitudes was 0.47, 0.52, 0.45, and 0.40, respectively for 0, 10, 20 and 30 min after glutamate washout.
3.2. Block of vacuolar ATPase with bafilomycin A1
To make a direct comparison with previous studies possible, I bath-applied the V-ATPase blocker bafilomycin A1 (Baf in DMSO, 5 μM for 100 s, Fig. 3-2) in intact synapses without presynaptic whole-cell recording, as previously reported at cultured hippocampal synapses (Ikeda & Bekkers, 2009). In control experiments, I bath-applied DMSO alone (0.5 %). Within 5 min after Baf application (100 s), the mEPSC amplitude started to decline and remained similar thereafter, whereas the EPSC amplitude and mEPSC frequency continuously declined. These results are consistent with those by