Developmental fine‑tuning of excitatory
synaptic transmission at input synapses in the rat inferior colliculus
著者(英) Mako Kitagawa
学位名(英) Doctor of Philosophy in Science 学位授与機関(英) Doshisha University
学位授与年月日 2020‑03‑22
学位授与番号 34310甲第1094号
URL http://doi.org/10.14988/di.2020.0000000184
Developmental fine-tuning of
excitatory synaptic transmission at input synapses in the rat inferior colliculus
DOCTORAL DISSERTATION
By:
Mako Kitagawa
Graduate School of Brain Science, Doshisha University
Supervisor:
Dr. Takeshi Sakaba
A thesis submitted for the degree of
Doctor of Philosophy in Science March 2020
i
Abstract
The inferior colliculus (IC) is the primal center of convergence and integration in the auditory pathway. Although extensive functional changes are known to occur at the relay synapses in the auditory brainstem during development, the changes in the IC remain to be investigated. Here, I have measured excitatory synaptic currents (EPSCs) of the neurons in the central nucleus of the IC in response to stimulation of the lateral lemniscus and the commissure of the inferior colliculus. Before hearing onset, the lemniscus inputs exhibited short-term depression, whereas commissural inputs showed facilitation. After hearing onset, the NMDA-EPSCs exhibited faster decay for both pathways, whereas the decay of the AMPA-EPSCs were unaltered. Furthermore, the EPSCs showed more constant responses during repetitive stimulation in both pathways. These developmental changes may ensure faster and more reliable signal transmission to the inferior colliculus after onset of hearing.
ii
Acknowledgements
I would like to thank my supervisor, Dr. Takeshi Sakaba for his continuous guidance, scientific advice, and encouragement during last 5 years.
I would like to thank Dr. Shin-ya Kawaguchi, Dr. Mitsuharu Midorikawa, Dr. Takafumi Miki, Dr.
Yuki Hashimotodani, and Dr. Ryota Fukaya. I also thank Dr. Shigeo Takamori, Dr. Yoshio Sakurai and Dr. Fumino Fujiyama for being my thesis committee members during their busy schedule.
I am also profoundly grateful to the past and the present members in the Sakaba lab, colleagues in Doshisha and my friends for all the good times. A special thanks to my family for everything.
I would like to thank inferior colliculus for making me realize that my understanding of the brain is limited. Part of this study has been published in Kitagawa & Sakaba (2019).
iii
Table of contents
Abstract ... i
Acknowledgements ... ii
Table of contents ... iii
List of tables ... v
List of figures ... vi
1. Introduction... 1
1.1. Background ... 1
1.2. An overview of the ascending auditory pathway. ... 2
1.3. General overview of the IC in the auditory pathway and synaptic inputs ... 3
1.3.1. Afferent synapses to the IC in the auditory midbrain pathway ... 3
1.3.2. The CNIC neurons receive ascending synaptic inputs in the auditory pathway ... 4
1.4. The morphology and physiological cell types of the IC ... 6
1.4.1. Physiological heterogeneity of IC neurons ... 6
1.4.2. Morphological heterogeneity of IC neurons ... 6
1.5. Synaptic transmission and short-term plasticity ... 7
1.5.1 Synaptic transmission at chemical synapses ... 7
1.5.2. Short-term plasticity ... 10
1.6. Synaptic responses of CNIC neurons mediated by ionotropic receptors. ... 12
1.7. Developmental changes of synaptic plasticity in the auditory pathway. ... 12
1.7.1. The calyx of Held synapse is a model synapse of developmental maturation in the auditory pathway. ... 13
1.7.2. Developmental changes of synaptic wiring in the IC. ... 14
1.8. Aims of this thesis ... 15
2. Materials and Methods... 17
2.1. Slice preparation ... 17
2.2. Electrophysiology ... 17
2.3. Data analysis ... 21
3. Results ... 23
3.1. Firing pattern of CNIC neurons ... 23
3.2. Synaptic responses of CNIC neurons in response to extracellular stimulation of LL and CoIC in P9-11 rats. ... 23
3.3. Developmental changes in the amplitude and decay of the AMPA- and NMDA-EPSCs at synapses from the LL and CoIC pathways. ... 26
3.4. Distinct short-term synaptic plasticity of LL- and CoIC- evoked EPSCs and its developmental changes. ... 30
3.5. Developmental changes in short-term synaptic plasticity of LL- and CoIC-evoked AMPA-EPSCs. .. 34
3.6. Developmental changes in short-term synaptic plasticity of LL- and CoIC-evoked NMDA-EPSCs. . 38
4. Discussion ... 44
4.1. Developmental changes in the EPSC kinetics. ... 44
iv
4.2. Short-term plasticity of EPSCs before the onset of hearing. ... 46
4.3. Developmental changes in short-term synaptic plasticity. ... 47
4.4. Conclusions ... 49
5. Future outlook & concluding remarks ... 51
5.1. Future outlook ... 51
5.2. Concluding remarks ... 53
6. References ... 54
v
List of tables
Table 1. Summary of the maturation of synaptic properties at the calyx of Held. ... 14
Table 2. Comparison of the EPSC amplitudes between LL and CoIC at P9–11 ... 26
Table 3. Decay time constants and amplitudes of the AMPA- and NMDA- EPSCs, and the NMDA/AMPA ratios ... 29
Table 4. Differences of short-term plasticity in two pathway (LL vs. CoIC) between two age groups. ... 43
Table 5. Developmental changes of synaptic plasticity (P9–11 vs. P15–18) in LL or CoIC pathway... 43
Table 6. Differences in the time courses of ANPA and NMDA EPSCs in each pathway. ... 43
vi
List of figures
Figure 1. Schematic drawing of ascending auditory pathway in the rats. ... 2
Figure 2. Schematic drawings of ascending auditory pathways of the mammalian midbrain inferior colliculus. ... 4
Figure 3. Basic mechanisms of synaptic transmission ... 8
Figure 4. The factors relevant to short-term plasticity ... 11
Figure 5. The calyx of Held is a giant glutamatergic synapse. ... 13
Figure 6. Whole-cell patch clamp recording... 20
Figure 7. LL-evoked postsynaptic currents recorded in CNIC neuron to single pulse stimulation. ... 21
Figure 8. Lateral lemniscus (LL)- and commissure of the inferior colliculus (CoIC)-evoked postsynaptic currents (PSCs) have excitatory and inhibitory components. ... 25
Figure 9. Acceleration of the EPSC decay, but no change in the NMDA/AMPAR ratio after hearing onset. 28 Figure 10. Short-term synaptic plasticity of excitatory synapses evoked by stimulation of the LL and CoIC pathways and its developmental changes. ... 32
Figure 11. Summary of short-term plasticity of the lateral lemniscus (LL)- (open circles) and CoIC- (filled triangles) evoked excitatory postsynaptic currents (EPSCs). ... 34
Figure 12. Short-term synaptic plasticity of the AMPA-EPSCs and its developmental changes. ... 37
Figure 13. Summary of short-term plasticity of the AMPA excitatory postsynaptic currents (EPSCs). ... 38
Figure 14. Short-term synaptic plasticity of the NMDA-EPSCs and its developmental changes. ... 41
Figure 15. Summary of short-term plasticity of the NMDA-EPSCs. ... 42
Figure 16. Developmental changes occur at the synapses that input to the CNIC around the time of hearing onset. ... 49
Figure 17. The schematic drawing of changes in synaptic strengths from LL- and CoIC-pathway around onset of hearing. ... 50
1
1. Introduction
1.1. Background
The localization of sound is performed by the auditory nervous system. To locate a sound source, auditory information from each ear is processed separately, by the cochlear nucleus (CN), and is converged at the superior olivary complex (SOC) in the auditory brainstem. Afferent projections from these nuclei converge in the inferior colliculus (IC). IC neurons are considered to compute sound location. Moreover, commissural connections between the contralateral and ipsilateral IC enhances the response of IC neurons (Orton et al., 2016) and may play a role in sound localization.
In sensory systems, neural activity adjusts synaptic and circuit functions by sensory experience during development. In the auditory pathway of rodents, morphological and functional properties change dramatically during postnatal development, especially around the onset of sensory inputs. For example, the first two weeks of postnatal development transforms synapse operation from moderate to very high-frequency signaling, allowing for high-fidelity signal transmission (Schneggenburger &
Forsythe, 2006). However, how synaptic response properties in the central nucleus of the inferior colliculus (CNIC) change around the onset of hearing remains uncertain. This study mainly focuses on how these changes occur.
I will first provide some general information about the IC in the auditory pathway and synaptic maturation in the IC.
2
1.2. An overview of the ascending auditory pathway.
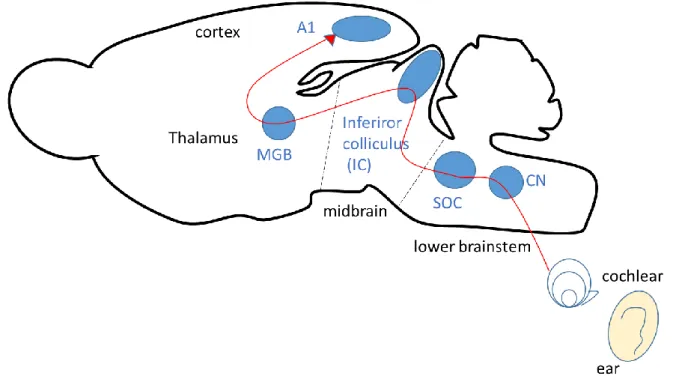
Auditory neurons encode and extract various properties of sound. Sound coming from the external ear induces vibrations of the tympanic membrane. Hair cells in the cochlea detect these vibrations and release the neurotransmitter glutamate in response to transmit the signals to the CN (Winer & Schreiner, 2005; Brian, 2013). The auditory information passes many nuclei from the CN to the cerebral cortex. The central auditory pathway is composed of an interconnected network of relay stations such as the CN, the SOC, the lateral lemniscus, the IC, the medial geniculate body, and the auditory cortex (Fig. 1). Before reaching the cerebral cortex, auditory information is processed within a particular nucleus or by interaction between multiple nuclei by feedforward and feedback pathways.
Figure 1. Schematic drawing of ascending auditory pathway in the rats.
The auditory information is transmitted from the cochlear nucleus (CN) to the primary auditory cortex (A1) by passing through many relay stations, such as superior olivary complex (SOC), lateral lemniscus, inferior colliculus (IC), medial geniculate body (MGB), and auditory cortex. See Winer & Schreiner (2005), Caspary et al. (2008), and Asaba et al., (2014) for details.
3
When sound information is transmitted from the cochlea to the CN and is segregated into different brainstem regions, different aspects of sounds such as sound intensity and the timing of sound onsets, are encoded. The majority of ascending signals from the brainstem regions are integrated at the IC in the midbrain. Neurons of the IC sending outputs to the thalamus display selective responses to various physical features of sounds. For example, the spectral, temporal, and binaural disparities of sounds are encoded by different neurons (Ehret & Schreiner, 2005). The spatial location of sound source information is computed by the binaural disparity of sounds. Within the barn owl IC, spatial location cues of sound source information are synthesized from horizontal and vertical cues measured by both ears (Knudsen, 2002).
1.3. General overview of the IC in the auditory pathway and synaptic inputs 1.3.1. Afferent synapses to the IC in the auditory midbrain pathway
The IC is the primary subcortical auditory center of convergence and integration in the mammalian midbrain. The main subdivision of the mammalian IC is the central nucleus. A main feature of the CNIC is the fibrodendritic lamina, an entity comprising disc-shaped neurons in which the laminar plexus of afferent axons terminate (Oliver, 2005). In the CNIC, axons from the lower auditory brainstem ascend through the lateral lemniscus (LL) and synapse onto CNIC neurons (Cant, 2013; Ono & Ito, 2015). Other major inputs, referred to as commissural inputs, pass through the commissure of the inferior colliculus (CoIC) from the contralateral IC to the CNIC (Saldaña &
Merchań, 1992; Malmierca et al., 2009). Intracellular studies in gerbil coronal brain slices have shown that most CNIC neurons receive convergent inputs from the LL and the contralateral IC via commissural projections (Moore et al., 1998).
4
1.3.2. The CNIC neurons receive ascending synaptic inputs in the auditory pathway
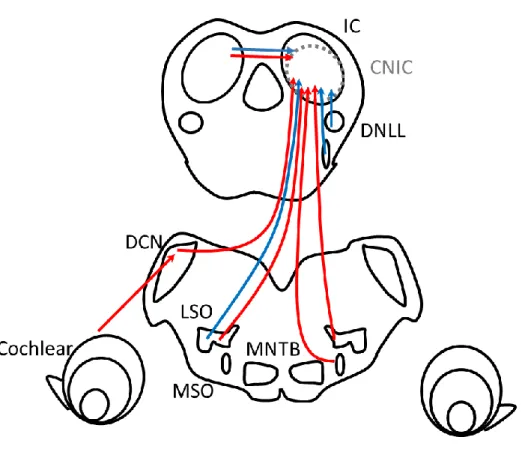
CNIC neurons receive ascending excitatory inputs from the medial superior olive (MSO), the lateral superior olive (LSO), the dorsal cochlear nucleus (DCN), and the ventral cochlear nucleus (Kelly & Caspary, 2005). Simultaneously, CNIC neurons receive ascending inhibitory inputs from the LSO, the ventral nucleus of the lateral lemniscus, and the dorsal nucleus of the lateral lemniscus (DNLL) (Kelly & Caspary, 2005). The largest afferent source of each IC is the contralateral IC (Moore et al., 1998). CoIC fibers are both glutamatergic and GABAergic (Nakamoto et al., 2013; Ito
& Oliver, 2014).
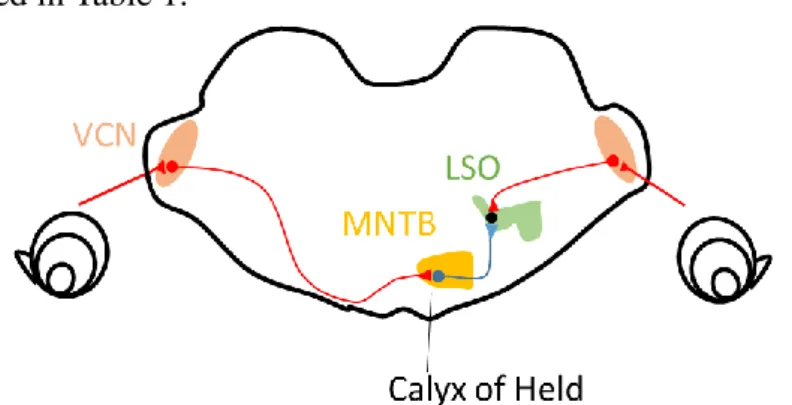
Figure 2. Schematic drawings of ascending auditory pathways of the mammalian midbrain inferior colliculus.
Red lines indicate excitatory pathways. Blue lines indicate inhibitory pathways, respectively. See Winer & Schreiner (2005), Caspary et al. (2008), Ono & Oliver (2014), and Ono & Ito (2015) for details.
5
A recent study in mice showed that excitatory CNIC neurons receive excitatory inputs from different combinations of specific nuclei. Inhibitory neurons, in contrast, receive inputs from the same combination of all nuclei (Chen et al., 2018).
Ipsilateral and contralateral LSOs send extensive excitatory inputs to the CNIC (Oliver, 2005).
The inputs from ipsilateral and contralateral LSOs and those from the MSO overlap in the CNIC, and these inputs are distributed heterogeneously within the CNIC (Cant, 2013). In addition to excitatory inputs, the ipsilateral LSO also provides inhibitory inputs to the CNIC. DNLL provides inputs to the dorsolateral CNIC (Cant & Benson, 2006). Principal cells in the medial nucleus of the trapezoid body do not send inputs to the IC, but lateral nucleus of the trapezoid body (LNTB) innervates bilaterally to the IC (Cant, 2013)
Ipsilateral and contralateral CN innervates lateral part of the CNIC. The inputs from the CN are distributed heterogeneously within the CNIC. Patch-like innervation patterns from the ipsilateral and contralateral CN do not overlap fully within CNIC (Cant & Benson, 2008). Oliver and colleagues found that the ipsilateral anteroventral CN constitutes up to 18 % of the excitatory terminals in the pars lateralis CNIC, whereas the contralateral anteroventral CN constitutes up to 13 %. The contralateral DCN constitutes up to 11 % of the excitatory terminals (Oliver, 2005; Cant, 2013).
Previous studies have demonstrated that commissural neurons in the CNIC send divergent projections to the equivalent frequency-band laminae in the CNIC and the dorsal and lateral cortices on the opposite side (Malmierca et al., 2005). In a more recent study, the superior paraolivary nucleus, which mainly projects GABAergic axons to the ipsilateral IC, was shown to also send GABAergic axons to the contralateral IC via the CoIC (Saldaña et al., 2009).
6
1.4. The morphology and physiological cell types of the IC
IC neurons show diverse responses to sounds and differ morphologically and physiologically.
1.4.1. Physiological heterogeneity of IC neurons
. In vivo extracellular recordings showed that IC neurons respond to specific sound frequencies and are arranged tonotopically (Palmer et al., 2013). In addition, there are different types of firing patterns in response to sounds. Firing of the IC neurons do not necessarily follow sound stimulation, as seen in the lower auditory brainstem. For example, some IC neurons show stimulus-specific adaptation to sounds and reduce their responses when stimulated repetitively (Pérez-González &
Malmierca, 2014). In vivo whole-cell recordings showed that GABAergic and glutamatergic IC neurons exhibit similar responses to pure tones but their ability to follow amplitude modulation is different (Ono et al., 2017). The offset neurons are known as the neurons firing at the sound stimuli offset and are induced by several underlying cellular and circuit mechanisms, (Kasai et al., 2012).
The mechanisms underlying the heterogeneous response properties remain to be elucidated. In vitro whole-cell recordings in IC neurons revealed heterogeneous intrinsic firing patterns. Six firing patterns were found in response to depolarizing and hyperpolarizing current pulses (Sivaramakrishnan & Oliver, 2001). These diverse firing patterns do not directly correlate to the neuronal morphology or neurotransmitter phenotype (Reetz & Ehret, 1999; Peruzzi et al., 2000;
Sivaramakrishnan & Oliver, 2001; Ono et al., 2005).
1.4.2. Morphological heterogeneity of IC neurons
The majority of CNIC neurons are classified into two main types by studies using three- dimensional reconstructions of Golgi impregnated neurons in rats: flat neurons and less flat neurons.
7
Flat neurons have flattened dendritic arbors. Less-flat neurons have less flat dendritic trees and their dendritic arbors often extend across the laminae (Oliver, 2005). The thickness of the dendritic arbor in flat neurons is 50–70 µm. Less-flat neurons cross the axis of the fibrodendritic laminae, although the dendritic trees are thicker (approx. 100 µm) and less dense compared to those of flat neurons (Ito
& Malmierca, 2018).
1.5. Synaptic transmission and short-term plasticity 1.5.1 Synaptic transmission at chemical synapses
Chemical synapses transmit signals from presynaptic to postsynaptic cells (Fig. 3). Chemical transmission is composed of two processes. The first process is the release of neurotransmitters. When an action potential reaches the presynaptic axon terminal, it elicits Ca2+ influx through voltage-gated Ca2+ channels in the terminal. Ca2+ influx triggers the fusion of neurotransmitter-containing synaptic vesicles with the plasma membrane and the release of neurotransmitters into the extracellular space, called the synaptic cleft. The second process is the binding of the released transmitter to receptors and activating them. The postsynaptic responses depend on the type of receptor. For example, glutamate can activate ionotropic glutamate receptors, such as ɑ-amino-3-5-methyl-4- isoxazolepropionic acid (AMPA) receptors and N-methyl-D-aspartate (NMDA) receptors (Fig. 3) AMPA receptors, permeable to Na+ and K+, activate and deactivate rapidly within milliseconds, desensitize upon prolonged application of glutamate, and mediate rapid signal transmission between neurons. NMDA receptors activate and deactivate more slowly within tens of milliseconds, desensitize to a lesser degree, and are also important for induction of long-term synaptic plasticity
8
through permeation of Ca2+ into postsynaptic neurons. Furthermore, G-protein-coupled metabotropic glutamate receptors (mGluRs) are coupled to second messengers, exerting excitatory or inhibitory action on a much slower time scale (Kandel et al., 2000). Similarly, GABA receptors are classified into several types. GABAA receptors are ionotropic receptors and permeate Cl- whereas GABAB
receptors are metabotropic receptors. Glycine receptors are considered to be ionotropic. The ionotropic glutamate receptor (iGluR) family has structurally related glutamate-gated excitatory channels that differ in their sensitivities and responses. NMDA, AMPA, and kainate receptors belong to the iGluR family (Iacobucci & Popescu, 2017).
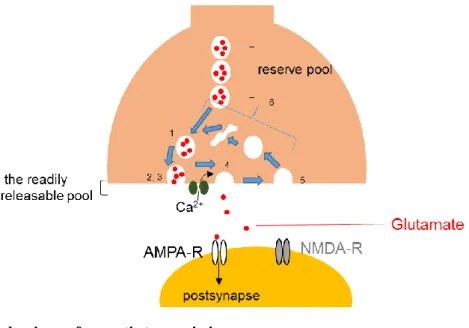
Figure 3. Basic mechanisms of synaptic transmission
Invasion of presynaptic action potentials to the presynaptic terminal opens Ca channels, and Ca influx into the terminal triggers release of neurotransmitters that act on postsynaptic receptors and modulate postsynaptic activity.
Excitatory synapses enhance firing of the postsynaptic neurons and inhibitory synapses do the opposite, or cause shunting inhibition, blocking the excitatory action of other inputs. Excitatory neurotransmitter, glutamate can activate ionotoropic glutamate receptors, such as fast AMPA receptors (AMPA-Rs) and slow NMDA receptors (NMDA-Rs). The synaptic vesicle cycle has several steps. (1) vesicle replenishment, (2) docking, (3) priming, (4) exocytosis, (5) endocytosis, and (6) synaptic vesicle recycling. For details, see von Gersdorff & Borst (2002);
Zucker & Regehr (2002), and Friauf et al. (2015).
9
AMPA receptors mediate fast synaptic transmission at excitatory synapses. AMPA receptors are tetramers composed of the GluR1–4 or GluR A–D subunits. Each subunit exists in two distinct forms, flip and flop. Desensitization occurs much quicker in the flop variants (Koike et al., 2000).
NMDA receptors have slow deactivation kinetics, are highly Ca2+ permeable, and depolarization is necessary for activation, in order to relieve the channel block by external Mg2+, which happens at resting membrane potential. Deactivation kinetics and Mg2+ block depend strongly on the type of GluN2 subunits (Glasgow et al., 2015). NMDA receptors with GluN2A have relatively fast response kinetics (deactivation), decaying within tens of milliseconds. NMDA receptors with GluN2B have slow response kinetics decaying over hundreds of milliseconds. The GluN2B subunit is expressed dominantly at auditory synapses during early development, while GluN2A subunit is expressed at more matured synapses (Sanchez et al., 2015).
Katz and colleagues have proposed the quantal hypothesis, which states that the efficacy of synaptic transmission upon arrival of an action potential depends on three main factors: the number of release sites (N), the postsynaptic response caused by transmitter release from a quantal packet of transmitters or a single synaptic vesicle (q), and the probability of neurotransmitter release at each release site (Pr) (Castillo and Katz, 1954). According to the quantal hypothesis, the amplitude distribution of the postsynaptic responses follows a convolution of Poisson statistics with a Gaussian distribution, the latter of which is determined by the fluctuation of single quantal events. This holds when Pr is low. When Pr is high, the amplitude distribution follows a binominal form (del Castillo &
Katz, 1954; Neher, 2017). N and Pr are mediated by presynaptic mechanisms such as the number of releasable pool of vesicles (N) as well as the amounts of Ca2+ influx and Ca2+ sensitivity of the fusion
10
machinery, which determine Pr. Q is determined by postsynaptic factors such as the sensitivity of postsynaptic receptors to transmitters as well as the number and density of postsynaptic receptors.
1.5.2. Short-term plasticity
The amplitudes of postsynaptic responses change rapidly in an activity-dependent manner, which last over milliseconds to minutes (Friauf et al., 2015). Such short-term synaptic plasticity occurs in most chemical synapses. Repetitive stimulation of presynaptic neurons facilitates or depresses synaptic responses. Short-term synaptic plasticity supports various types of neural computations (Regehr & Abbott, 2004). For example, short-term plasticity is able to act as gain control and operates as a filter of the information flow between neurons (von Gersdorff & Borst, 2002).
The valence of short-term plasticity (facilitation vs depression) is determined by the initial release probability. Synapses with a high initial release probability tend to depress, whereas those with a low initial probability usually facilitate (Zucker & Regehr, 2002; Regehr, 2012). The mechanisms of short-term depression and facilitation are diverse (Fig. 4). For depression, Ca2+
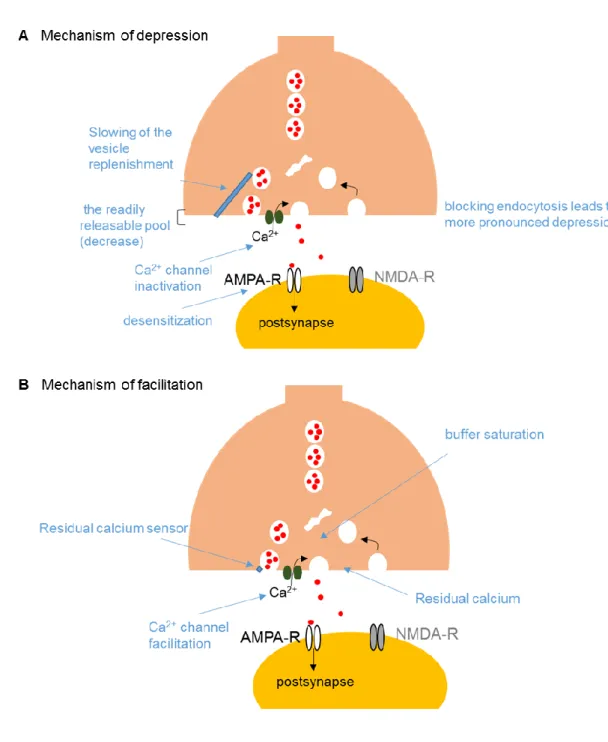
channel inactivation and depletion of the readily-releasable pool of synaptic vesicles are the two major presynaptic mechanisms. In addition, a failure of action potential invasion, the slowing of synaptic vesicle replenishment, and the inactivation of release sites though delayed clearance of released materials due to slow endocytosis may be responsible, too. For postsynaptic mechanisms, the desensitization of postsynaptic receptors is a major mechanism at particular synapses. For synaptic facilitation, Ca2+ channel facilitation, broadening of action potentials, accumulation of residual Ca2+, activation of the facilitation sensor, and saturation of endogenous Ca2+ buffers are
11
candidate mechanisms (Regehr, 2012). Quantitative analyses are necessary to dissect the precise mechanisms of short-term plasticity.
Figure 4. The factors relevant to short-term plasticity
(A) Schematic illustrating mechanisms of depression. (B) Schematic illustrating mechanisms of facilitation. For details, see von Gersdorff & Borst (2002), Zucker & Regehr (2002), and Regehr (2012).
12
1.6. Synaptic responses of CNIC neurons mediated by ionotropic receptors.
Whole-cell voltage-clamp recordings from CNIC neurons revealed mixed inhibitory and excitatory postsynaptic responses upon direct stimulation of the LL and the CoIC (Moore et al., 1998;
Vale & Sanes, 2002; Vale et al., 2004; Sivaramakrishnan & Oliver, 2006; Yassin et al., 2016; Moore
& Trussell, 2017). The excitatory postsynaptic responses consist of fast and slow responses mediated by AMPA and NMDA receptors, respectively (Wu et al., 2004). The inhibitory postsynaptic responses are mediated by GABAA and glycine receptors (Moore et al., 1998; Wu et al., 2004; Moore & Trussell, 2017). Although these studies revealed basic synaptic properties, many studies focus on the synaptic properties before hearing onset, while developmental changes of synaptic responses, especially around the time of hearing onset remain to be investigated.
1.7. Developmental changes of synaptic plasticity in the auditory pathway.
Hearing onset occurs around postnatal day 12 (P12) in rodents when the auditory canals open (Schneggenburger & Forsythe, 2006). Before hearing onset, spontaneous neural activity is necessary for forming proper auditory circuits such as synapse wiring (Clause et al., 2014; Wang & Bergles, 2015). Although acoustic inputs are not necessary for synapse wiring, they dramatically change synaptic properties at a given synapse. After the onset of hearing, bilateral deafness alters synaptic properties at the calyx of Held in the auditory brainstem. For example, the downregulation of postsynaptic NMDA receptors depends on acoustic activity (Futai et al., 2001). In addition, synaptic strengths are altered by hearing loss (Erazo-Fisher et al., 2007). Thus, the functional maturation or fine-tuning of auditory synapses relies to a large extent on acoustic inputs.
13
1.7.1. The calyx of Held synapse is a model synapse of developmental maturation in the auditory pathway.
The calyx of Held (Fig. 5), which is located in the auditory brainstem, is a large glutamatergic nerve terminal that innervates a single principal neuron of the medial nucleus of the trapezoid body.
The calyx synapse has been used as a model system for studying developmental changes of synaptic properties, by taking advantage of the large pre- and postsynaptic compartments that allow simultaneous electrical recordings (Taschenberger & von Gersdorff, 2000; Brenowitz & Trussell, 2001; Iwasaki & Takahashi, 2001; Joshi & Wang, 2002; Magnusson et al., 2005; Kim & Kandler, 2010; Crins et al., 2011). These studies revealed remarkable changes around the onset of hearing. In particular, presynaptic action potentials follow high-frequency stimulation up to a kHz range.
Furthermore, the combination of a large synaptic vesicle pool and the reduced release probability of synaptic vesicles at the presynaptic side ensure less short-term synaptic depression and hence reliable synaptic transmission during high-frequency firing. At the postsynaptic side, NMDA receptors are downregulated and the AMPA receptor isoforms exhibit fast activation and deactivation kinetics.
These features provide the cellular basis of circuit adaptation to high-frequency auditory signaling up to a kHz range. The functional parameters during synaptic maturation (before and after the onset of hearing) are summarized in Table 1.
Figure 5. The calyx of Held is a giant glutamatergic synapse.
The calyx of Held terminal terminates on the MNTB neurons. The neurons in the LSO, next station See von Gersdorff & Borst (2002) and Schneggenburger & Forsythe (2006) for details.
14
Table 1. Summary of the maturation of synaptic properties at the calyx of Held.
Various functional properties which have been changed during maturation are described. See von Gersdorff &
Borst (2002), Schneggenburger & Forsythe (2006), and Steinert et al. (2010) for details.
Calyx of Held
before hearing onset after hearing onset Morphology Spoon-shaped structure Multidigit-like structure Presynaptic AP waveform Faster with development
Release probability Reduce release probability The readily
releasable pool of vesicles
Larger with development
Ca2+ channel subtypes Mixture of R, N and P/Q Ca2+ channels
P/Q subtype
The amplitude of AMPA receptor mediated EPSC
Increase in the amplitudes or similar
The amplitude of NMDA receptor-mediated EPSC
Decrease in the amplitudes
The decay kinetics of AMPA receptor-mediated EPSC
Acceleration with development
The decay kinetics of NMDA receptor-mediated
EPSC
Acceleration with development
Short-term plasticity Decrease in synaptic depression with age
1.7.2. Developmental changes of synaptic wiring in the IC.
CNIC cells are generated at embryonic day 14 and some afferent axons from the CN reach the IC at embryonic day 17–18 in rats (Brunso-Bechtold & Henkel, 2005). The basic pattern of afferent inputs from DNLL to the CNIC is already present around birth or latest by P4 in rats. The refinement of auditory ascending projections continues until the onset of hearing (Gabriele et al., 2000; Brunso- Bechtold & Henkel, 2005).
Around the onset of hearing (around P12), CNIC neurons respond transiently to tone stimulation. After P15, some CNIC neurons start to respond reliably to tones in rats and the response
15
is similar to that in adults (Clopton & Winfield, 1976; Shnerson & Willott, 1979; Grécová et al., 2009), indicating that the properties of input synapses may be developmentally regulated to secure reliable transmission. Although developmental changes in the intrinsic connectivity within the CNIC have been studied on a cellular level (Sturm et al., 2014), those of the input synapses have not yet been examined quantitatively.
1.8. Aims of this thesis
In this study, I focused on the functional properties of synaptic transmission in the CNIC. The CNIC is the major auditory relay station in the mammalian midbrain. The CNIC integrates the ascending information from almost all lower brainstem nuclei as well as commissural connections between the contralateral IC. I examined how developmental changes of synaptic transmission allow reliable information transmission in the CNIC by focusing on excitatory synapses that provide inputs to the CNIC. Although previous studies have shown that synapses in the lower auditory relay stations, such as the calyx of Held, are developmentally optimized for fast signaling, little is known about developmental changes in the CNIC. In particular, developmental changes of two major inputs, ascending fibers from the lower brainstem (LL pathway) and commissural inputs from the CoIC pathway will be compared. Such information is necessary to understand how the neural circuits in the IC are adapted to sound information on a cellular level.
The overall goals of my thesis are as follows.
1. To characterize the developmental regulation of the synaptic responses mediated by AMPA and NMDA receptors in the CNIC.
16
2. To investigate the functional properties of synaptic transmission in the CNIC, I compared short-term plasticity of excitatory synapses in the LL and CoIC pathways at near-physiological temperature.
17
2. Materials and Methods
2.1. Slice preparation
All procedures, including animal experiments were performed in accordance with the guidelines of the Physiological Society of Japan and Doshisha University and were approved by the local committee for handling experimental animals at Doshisha University. Male and female Wister rats aged P9-11 and P15-18 were deeply anaesthetized by inhalation of isoflurane, and after decapitation brains were removed. Coronal brain slices through the IC (300 μm in thickness) were obtained using a Leica VT1200S slicer (Leica, Micro systems, Wetzlar, Germany) in cold oxygenated solution containing (mM): 60 NaCl, 130 sucrose, 2.5 KCl, 25 glucose, 25 NaHCO3, 1.25 NaH2PO4, 0.5 ascorbic acid, 3 myoinositol, 2 sodium pyruvate, 0.1 CaCl2 and 3 MgCl2 (pH 7.4, gassed with 95% O2 and 5% CO2). For preparing slices from P15-18 rats, NaCl was replaced by sucrose. Each slice contained the IC and visible fibers from the LL and CoIC to the IC. In order to allow the slices to recover from the cutting procedure, they were incubated at 37°C for 1-3 hours in artificial cerebrospinal fluid (ACSF; in mM: 125 NaCl, 2.5 KCl, 2 CaCl2, 1 MgCl2, 25 glucose, 25 NaHCO3, 1.25 NaH2PO4, 0.4 ascorbic acid, 3 myo-inositol, and 2 sodium pyruvate; pH 7.4; gassed with 95%
O2, 5% CO2).
2.2. Electrophysiology
For recordings, slices were continuously superfused in the recording chamber with oxygenated ACSF, or ACSF containing antagonists of postsynaptic receptors, at 30-34°C, and were visualized on
18
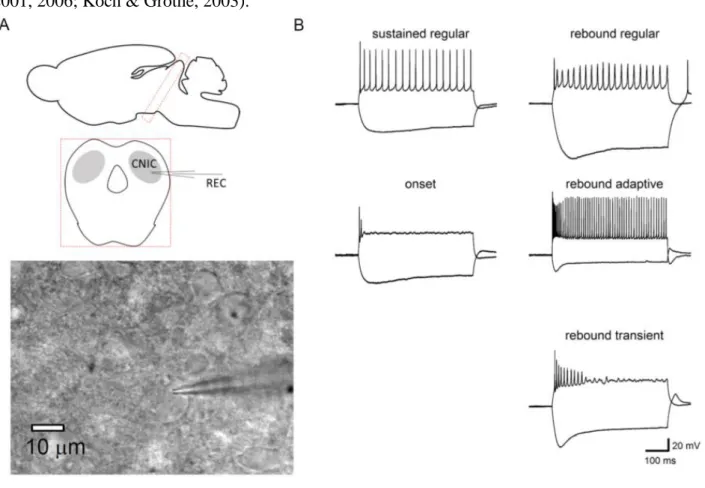
an upright microscope (BX-51, Olympus, Tokyo, Japan) equipped with a water immersion objective (x60, NA 0.90, Olympus). Whole cell patch-clamp recording from a neuron in the CNIC was performed using an EPC-10/2 amplifier (HEKA, Lambrecht, Germany) controlled by PatchMaster software (HEKA) in voltage- or current- clamp mode. Recordings were obtained with patch pipettes of 3.5-6 MΩ resistance made from borosilicate glass microcapillaries (Fig. 6) (1.5 mm open diameter, Harvard). Pipettes were filled with an intracellular solution containing (in mM): 140 K-gluconate, 20 KCl, 10 HEPES, 5 Na2-phosphocreatine, 5 MgATP, 0.5 NaGTP and 0.5 K-EGTA (pH 7.2). 5 mM QX-314 bromide was added to the internal solution to block Na channels. Series resistances were generally 10-30 (typically 15) MΩ and were compensated by 0-30%. The series resistance error could distort the amplitudes and kinetics of the recorded current. Furthermore, it could distort the synaptic depression ratio when the evoked currents were temporally overlapping. Synaptic responses were elicited with electrical stimuli (100 μs square pulses) and were delivered through bipolar tungsten electrodes (separated by approximately 1 mm) driven by stimulators (A.M.P.I, Jerusalem, Israel; or A-M Systems, USA). Stimulating electrodes were placed in the afferent pathways from LL, and the CoIC (Fig 8A), which followed the procedure of Moore et al. (1998). The stimulus required to produce maximal afferent currents was determined by the stimulus-response curves (the input-output curve; I-O curve). The I-O curve plots the relationship between stimulation intensity and synaptic current amplitudes. Stimulation strengths were 10-50 V, usually around 30 V. Stimulus trains were applied every 10 sec. I-O curve was usually continuous and was not all-or-none manner, suggesting that multiple fibers were stimulated in our conditions. At > 30 V, synaptic responses became relatively reliable and I adjusted the voltage so that it was strong enough to evoke reliable responses. I did not
19
notice changes of the threshold of stimulus intensity eliciting synaptic responses before and after onset of hearing (Fig. 7) (LL:10.4 ± 3.8 V vs 8.0 ± 2.9 V, CoIC: 15 ± 5 V vs 16.3 ± 4.7 V, n = 3-5), suggesting that fiber excitability was not changed drastically in the developmental range studied here.
The liquid junction potential between the pipette and the external solution was not corrected.
Measurements of postsynaptic currents (PSCs) were performed in whole-cell voltage-clamp mode.
Voltage-clamp recordings were made at a membrane holding potential (Vhold) of -40 mV. Some cells were held at -50 mV, but the data were similar to the ones at -40 mV, and the data were pooled together.
To assess short-term plasticity, 5 pulses of repetitive stimulation were applied extracellularly at frequencies of 10, 20, or 50 Hz. GABAA and glycine receptors were blocked by adding 50 or 100 μM picrotoxin and 2 μM strychnine to the ACSF, respectively. In some recordings, NMDA receptors were blocked by 25 or 50 μM D-(-)-2- Amino-5-phosphonopentanoic acid (D-AP5). D-AP5 and QX-314 bromide were obtained from Tocris Cookson (Bristol, UK). NBQX disodium salt (NBQX) was obtained from Abcam (Cambridge, UK). Other reagents were obtained from Nakalai Tesque (Kyoto, Japan). PSCs in ACSF and excitatory postsynaptic currents (EPSCs) in the presence of receptor antagonists were averaged over 5-20 sweeps. Inhibitory postsynaptic currents (IPSCs) were extracted by comparing the traces in the presence and absence of picrotoxin. NMDA receptor-mediated EPSCs (NMDA-EPSCs) were extracted by applying NBQX.
The EPSC amplitudes were measured as the difference between the peak amplitude and the extrapolated exponential decay of the previous EPSC. The EPSC decay time constants were obtained by fitting with a single exponential. For the analysis of the decay, I avoided using multisynaptically evoked responses. Namely, I examined each EPSC and only analyzed visually single-peak synaptic
20
responses. For monosynaptic AMPA-EPSCs, I considered that the time to peak was usually within 5 ms. For NMDA-EPSCs, time to peak was slower because of slow receptor activation (usually ~10 ms), but eliminated clearly multi-peaked responses. I should note that I have used fibre stimulation and cannot entirely exclude the possibility of multi-synaptic responses. Data were pooled from synaptic responses irrespective of cell types, because I did not detect any differences in synaptic properties among cell types. Firing patterns were analyzed according to their response to 500 ms (negative and positive) current injections with varied amplitudes (from -200 to +700 pA by a 100 ms step). In previous studies using depolarizing current injections, cell types were classified as regular, adapting, or transient types. By using responses to hyperpolarizing or pre-hyperpolarizing currents, cell types were classified as rebound, non-rebound, or pause-build types (Sivaramakrishnan & Oliver, 2001, 2006; Koch & Grothe, 2003).
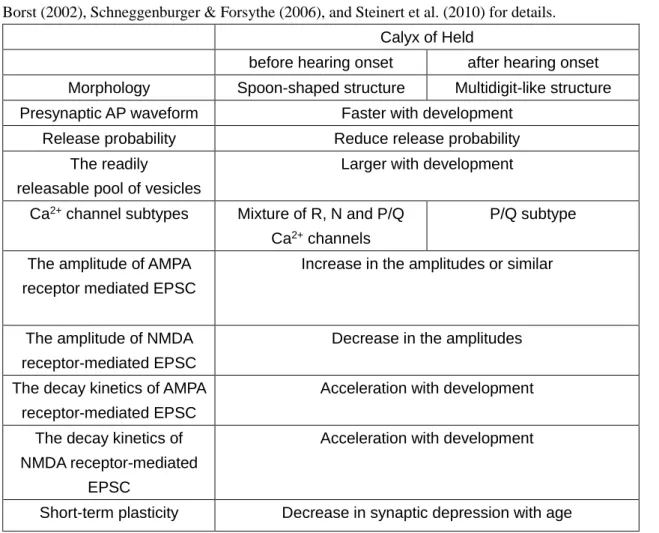
Figure 6. Whole-cell patch clamp recording
(A) Whole-cell recordings from the CNIC neuron. The glass pipette are used for whole cell clamp of the CNIC
21
neuron. Coronal brain slices (300 µm) containing in the CNIC. (B) The firing patterns of cell types were classified according to the previous studies. In this panel, firing patterns are classified into 5 types.
Figure 7. LL-evoked postsynaptic currents recorded in CNIC neuron to single pulse stimulation.
Recording was performed in the whole-cell voltage clamp mode. In Left and Right, pharmacologically isolated EPSCs recorded from one CNIC neuron and representative stimulus-response curve is shown, respectively. The increase was gradual but not all-or none, suggesting that multiple fibers were stimulated.
2.3. Data analysis
Data were acquired at a sampling rate of 20 kHz, after low-pass filtering at 2.9 or 6 kHz. Data were analyzed by IGOR Pro 6.22A (WaveMetrics, Lake Owswego, OR, USA), and MS Excel 2010 software (Microsoft). Statistical significance was assessed using Student’s t tests, Welch’s t tests, and three-way ANOVAs with post hoc multiple comparisons (Tukey- Kramer method), using statistical software (Excel or R version 3.3.3). When I applied three-way ANOVA, I first did ANOVA analysis for two pathways (LL and CoIC), three frequencies (10, 20, 50 Hz) and five stimuli, or else, two age groups, three frequencies and five stimuli. After this, I performed post-hoc comparisons for comparing each parameter (pathway-dependence, differences in the time courses) using Tukey- Kramer method. In order to examine whether statistical results are robust, I have also performed 3- way mixed ANOVA, in which I considered that stimulus train was obtained from the same cell.
However, the results are basically the same (p < 0.05) for the main findings of the study. Data were
100
50
EPSC amplitude (pA) 0
50 40 30 20 10 0
stimulus intensity (V) 20 ms
50 pA 5 V
50 V
22
considered statistically significant when p < 0.05. Data are presented as mean ± SEM.
23
3. Results
3.1. Firing pattern of CNIC neurons
Among 20 cells measured before the onset of hearing, 32% were sustained-regular type, 37%
were onset type, 11% were rebound-regular type, 5% were rebound-adapting type, and 16% were rebound-transient type. Among 17 neurons measured after the onset of hearing, 35% were sustained- regular type, 12% were onset type, approximately 18% were rebound-regular type, 24% were rebound-adapting type, and approximately 12% were rebound-transient type. The pause-build firing pattern was not identified in this study, because we did not apply pre-hyperpolarization current pulse.
Data was pooled from synaptic responses irrespective of cell types, because I did not detect any differences in synaptic properties among cell types.
3.2. Synaptic responses of CNIC neurons in response to extracellular stimulation of LL and CoIC in P9-11 rats.
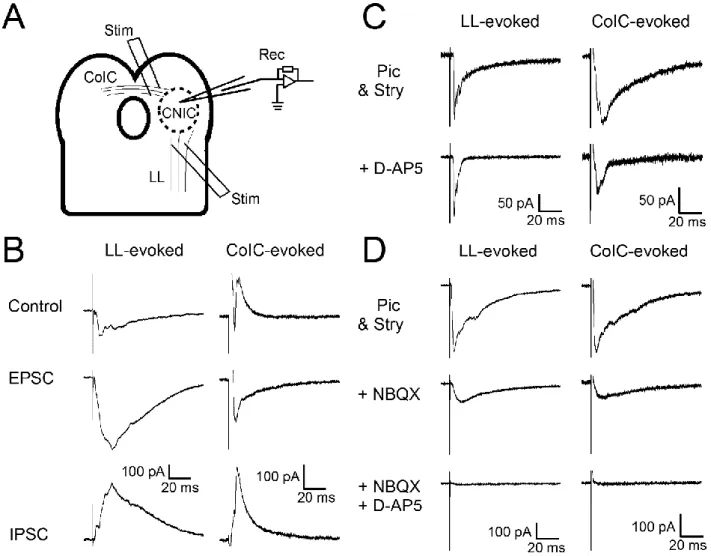
I have characterized the synaptic currents in response to electrical stimulation of the LL or CoIC using acute coronal brain slice preparations from rats (P9–11). The LL or CoIC pathways were stimulated extracellularly (Figure 8A). Figure 8B shows example traces of LL- and the CoIC-evoked PSCs in response to a single stimulus. The LL-evoked PSC was inward and the CoIC-evoked PSC was outward in this example, and the LL-and CoIC-evoked EPSCs were isolated by application of picrotoxin. GABAergic currents were extracted by comparing the responses in the presence and absence of picrotoxin. The EPSC amplitudes were measured in extracellular solution containing
24
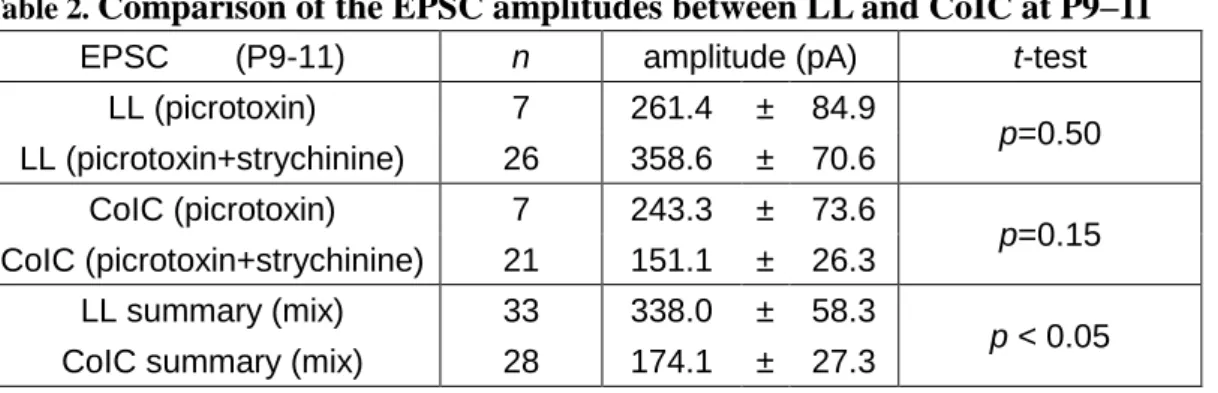
either only picrotoxin (LL, n = 7; CoIC, n = 7), or picrotoxin and strychnine (LL, n = 26; CoIC, n = 21). In the LL pathway the EPSC amplitudes with and without strychnine were 358.6 ± 70.6 pA (n = 26) and 261.4 ± 84.9 pA (n = 7, p = 0.50 from t-test, Table 2), respectively. In the CoIC pathway, they were 151.1 ± 26.3 pA (n = 21) and 243.3 ± 73.6 pA (n = 7, p = 0.15 from t-test, Table 2), respectively.
Because of the data scatter, I could not detect the difference between the two conditions. I have used extracellular stimulation, and it is not straightforward to compare the two conditions obtained from different cells. Indeed, it is well established that glycinergic IPSCs are observed at this preparation (Moore et al., 1998; Choi Buentello, Bishop, & Oliver, 2015; Moore & Trussell, 2017). Nevertheless, the main purpose of this study is to analyze the EPSCs. On average, the amplitudes of the LL-evoked EPSCs and CoIC-evoked EPSCs were 338.0 ± 58.3 and 174.1 ± 27.3 pA, respectively in our conditions (LL, n = 33; CoIC, n = 28, Table 2). Again, it is not straightforward to compare the EPSC amplitudes between two pathways because I have used extracellular fibre stimulation for evoking EPSCs. In Figure 8C, AMPA receptor-mediated (AMPA-) EPSCs were isolated by applying D-AP5 (25 or 50 μM), an NMDA receptor antagonist. The slow component was reduced, consistent with blockage of NMDA receptors (LL, n = 11; CoIC, n = 7, for further quantification, see Figure 9).
Conversely, when the AMPA-EPSCs were blocked by NBQX (10 μM), the slow component remained, which is likely to be indicative of NMDA-EPSCs (Figure 8D, LL, n = 7; CoIC, n = 9).
25
Figure 8. Lateral lemniscus (LL)- and commissure of the inferior colliculus (CoIC)-evoked postsynaptic currents (PSCs) have excitatory and inhibitory components.
(A) Schematic view of the experiments. Neurons in the central nucleus of the inferior colliculus were patch-clamped at Vhold = -40 mV. The LL- or CoIC-pathways was stimulated extracellularly by bipolar stimulation electrode. The LL-evoked (left) and the CoIC-evoked (right) currents under different conditions are shown in B-D.
(B) Top traces: Control responses were recorded with the brain slice perfused in normal ACSF. Middle traces: The EPSCs were recorded in the presence of picrotoxin (50-100 µM). Bottom traces: IPSCs were extracted by comparing the responses in the presence (middle traces) and absence (top traces) of picrotoxin.
(C) Similar to B, but the traces with (bottom traces) and without (top traces) D-AP5 are shown. Picrotoxin and strychnine were always present.
(D) Similar to B, but the traces under control conditions (top traces), in the presence of NBQX (middle traces), and in the presence of NBQX and D-AP5 (bottom traces) are shown.
26
Table 2. Comparison of the EPSC amplitudes between LL and CoIC at P9–11 EPSC (P9-11) n amplitude (pA) t-test
LL (picrotoxin) 7 261.4 ± 84.9
p=0.50 LL (picrotoxin+strychinine) 26 358.6 ± 70.6
CoIC (picrotoxin) 7 243.3 ± 73.6
p=0.15 CoIC (picrotoxin+strychinine) 21 151.1 ± 26.3
LL summary (mix) 33 338.0 ± 58.3
p < 0.05 CoIC summary (mix) 28 174.1 ± 27.3
3.3. Developmental changes in the amplitude and decay of the AMPA- and NMDA-EPSCs at synapses from the LL and CoIC pathways.
To examine developmental changes in the EPSC kinetics, the AMPA- and NMDA-EPSCs were compared at the synapses between the following two age groups: P9-11 (before hearing onset) and P15-18 (after hearing onset). The AMPA- and NMDA-EPSCs are presented in Figure 9A and B. The AMPA- and NMDA- EPSCs were isolated by applying D-AP5 (25-50 μM) and NBQX (10 μM), respectively.
The mean amplitudes of LL-evoked AMPA-EPSCs at P9-11 and P15-18 were 186.2 ± 65.2 pA (n = 11) and 299.0 ± 79.2 pA (n = 8), respectively (no statistical significance, p = 0.28 from Student’s t-test, Table 3). The amplitudes in the CoIC pathway were 55.9 ± 18.7 pA (n = 7), and 125.0 ± 53.0 pA (n = 6), respectively (not statistical significance, p = 0.48 from Welch’s t-test, Table 3). Because I have used extracellular fiber stimulation for evoking EPSCs, it is not straightforward to compare the EPSC amplitudes, although stimulus threshold for evoking EPSCs seemed unchanged during development (see methods). I also monitored developmental changes in the decay time course. The decay of AMPA-EPSCs did not change during development, as shown in Fig 9C. Specifically, the decay time constants of LL-evoked EPSCs were 4.09 ± 0.57 ms (n = 11) and 3.13 ± 0.81 ms (n = 8)
27
at P9-11 and P15-18, respectively (no statistical significance from t-test, p = 0.33, Table 3). The decay of the CoIC-evoked EPSCs were 4.88 ± 0. 53 ms and 3.74 ± 0.28 ms, at P9-11 (n = 7) and P15-18 (n
= 6), respectively (no statistical significance from t-test, p = 0.10, Table 3).
Figure 9D shows an exponential fit to the decay phases of the LL- and the CoIC-evoked NMDA-EPSCs, indicating that the time constant became significantly faster by 37% (LL: 21.8 ± 2.12 ms to 13.8 ± 2.41 ms, p < 0.05 from t-test, n = 8 and 12, respectively) and 34% (CoIC: 38.3 ms ± 2.54 ms to 25.4 ± 3.63 ms, p < 0.05 from t-test, n = 7 and 7, respectively), respectively, at P15-18 (Table 3). I failed to observe the difference in the mean amplitudes of the NMDA-EPSCs in both pathways. Specifically, the LL-evoked NMDA-EPSC amplitudes were 193.7 ± 49.3 pA and 78.5 ± 15.5 pA at P9-11 and P15-18, respectively (no statistical significance from t-test, p = 0.06, n = 8 and 12, respectively), whereas the CoIC-evoked EPSC amplitudes were 79.1 ± 29.3 pA and 40.0 ± 13.9 pA (no statistical significance from t-test, p = 0.25, n = 7 and 7), respectively (Table 3). I cannot exclude the possibility that NMDA EPSCs were decreased in the LL pathway. However, strong downregulation did not happen at the IC around hearing onset as seen in the calyx of Held (Taschenberger & von Gersdorff, 2000).
In addition, I did not observe changes in the amplitude ratio of the NMDA- to AMPA-EPSCs (P9-11 vs P15-18, no statistical significance from t-test LL, p = 0.23; CoIC, p = 0.19), although the values were variable among cells. The ratios were 0.50 ± 0.08 (LL, n = 8) and 0.78 ± 0.24 (CoIC, n
= 7) at P9-11 (Fig 9E). The NMDA/AMPA ratios at P15-18 were 0.37 ± 0.06 (LL, n = 12) and 0.40
± 0.12 (CoIC, n = 7, Table 3). The important point here is that strong downregulation of NMDA- EPSC amplitudes did not occur at the IC, in contrast to the auditory brainstem (Taschenberger & von
28
Gersdorff, 2000; Futai et al., 2001).
Figure 9. Acceleration of the EPSC decay, but no change in the NMDA/AMPAR ratio after hearing onset.
(A) Top: Example traces of LL-evoked EPSCs recorded before (left) and after (right) the onset of hearing. Control traces (black) and traces in the presence of D-AP5 (grey) are shown. Bottom: Control traces (black) and traces in the presence of NBQX (grey).
(B) The same as A, but CoIC-evoked EPSCs are shown.
(C) The decay time constants of AMPA-EPSC before (grey bars) and after (open bars) the onset of hearing are shown. Left and right show the data of the LL-evoked (P9-11, n = 11; P15-18, n = 8) and the CoIC-evoked (P9-11, n = 7; P15-18, n = 6) EPSCs, respectively. Both average and individual data are shown.
(D) Similar to C, but the decay time constants of NMDA-EPSC are shown. Left and right show the data of the LL- evoked (P9-11, n = 8; P15-18, n = 12) and the CoIC-evoked (P9-11, n = 7; P15-18, n = 7) EPSCs, respectively.
(E) The same as C and D, but the amplitude ratios of NMDA- to AMPA-EPSCs are shown. The same number of cells as D. In C-E, asterisks indicate statistically significant differences: * for p < 0.05.
29
Table 3. Decay time constants and amplitudes of the AMPA- and NMDA- EPSCs, and the NMDA/AMPA ratios
P9-11 P15-18 p-value
LL
AMPA Decay τ (ms) 4.09 ± 0.57
n=11 3.13 ± 0.81
n=8 0.33 amplitude (pA) 186.19 ± 65.21 299.00 ± 79.21 0.28
NMDA
Decay τ (ms) 21.81 ± 2.12 n=8
13.75 ± 2.41
n=12
0.03 amplitude (pA) 193.72 ± 49.44 78.52 ± 15.53 0.06 NMDA /AMPA ratio 0.50 ± 0.08 0.37 ± 0.06 0.21
CoIC
AMPA Decay τ (ms) 4.88 ± 0.53
n=7 3.74 ± 0.28
n=6 0.10 amplitude (pA) 55.92 ± 18.70 125.01 ± 52.99 0.26
NMDA
Decay τ (ms) 38.27 ± 2.54 n=7
25.39 ± 3.63
n=7
0.01 amplitude (pA) 79.07 ± 29.28 39.98 ± 13.89 0.25 NMDA /AMPA ratio 0.78 ± 0.24 0.40 ± 0.12 0.19
30
3.4. Distinct short-term synaptic plasticity of LL- and CoIC- evoked EPSCs and its developmental changes.
I examined short-term plasticity by stimulation of the LL and CoIC at P9-11 rats. EPSCs were isolated pharmacologically by adding picrotoxin (50 or 100 µM; LL, n = 7; CoIC, n = 7) or picrotoxin + strychnine (2 µM; LL, n = 16-17; CoIC, n = 14), and the LL or CoIC fibers were stimulated 5 times at 10, 20, or 50 Hz. Figure 10A shows example traces of LL-evoked EPSCs (left traces) and CoIC- evoked EPSCs (right traces) in response to 5 pulses of repetitive stimulation at 10, 20, and 50 Hz.
EPSCs were mixtures of AMPA- and NMDA-EPSCs at the holding potential of -40 mV. The amplitudes of LL-evoked EPSCs were depressed at all frequencies. In contrast, CoIC-evoked EPSCs exhibited no depression, and even facilitation at higher frequencies. To determine the extent of short- term synaptic plasticity, the EPSC amplitudes were measured and normalized to the first EPSC in each trace. Figure 11A shows a summary of short-term synaptic plasticity for LL- and CoIC-evoked EPSCs at 10 (LL, n = 23; CoIC, n = 21), 20 (LL, n = 23; CoIC, n = 21), and 50 Hz (LL, n = 24; CoIC, n = 21). The LL-evoked excitatory responses exhibited pronounced short-term synaptic depression (~ 50% of the initial response) at all frequencies. In contrast, the CoIC-evoked responses were constant at 10 Hz and slightly facilitated at 20 and 50 Hz. A significant difference was found between short-term synaptic plasticity at excitatory synapses in the LL and CoIC pathways (p < 0.001, F (1, 635) = 163.3, ANOVA test) at all frequencies (p < 0.001 at all frequencies from post hoc multiple comparisons, see above for the number of cells in each condition, Table 4).
To study developmental changes in short-term synaptic plasticity in response to repetitive stimulation of the LL and CoIC pathways, I recorded EPSCs in response to repetitive stimulation at
31
P15-18. After the onset of hearing, EPSCs showed slight depression at excitatory synapses in the LL and CoIC pathways. Figure 10B shows example traces of the LL-evoked (left traces) and CoIC- evoked EPSCs (right traces) in response to repetitive stimulation. Compared with P9-11, the amplitude of the LL-evoked EPSCs showed less depression particularly at 50 Hz in Fig 10. In contrast, the short-term plasticity of CoIC-evoked EPSCs did not change drastically, and showed constant responses or slight depression at all frequencies. Figure 11B shows a summary of short-term synaptic plasticity for LL- and CoIC-evoked EPSCs. Both LL-evoked (n = 20, 23, 18) and CoIC-evoked (n
=21, 20, and 18 for 10, 20, and 50 Hz, respectively). The data scattered in both LL- and CoIC- pathways. On average, EPSCs showed a slight depression or almost constant responses at all frequencies. At the LL pathway, significant differences were observed between two age groups (p <
0.001, F (1, 625) = 80.3, ANOVA test) when comparing the depression curve at all frequencies (p <
0.001 for 10, 20, and 50 Hz, from post hoc multiple comparisons, Table 5). In contrast, no significant difference was observed at the CoIC pathway (p < 0.001, F (1, 580), ANOVA test) at any frequencies (p = 0.94, 0.09, and 0.34 for 10, 20, and 50 Hz from post hoc multiple comparisons, Table 4). In addition, no significant difference was detected between the two pathways (p = 0.0044, F (1, 570), ANOVA test) at any frequencies at P15-18 (p = 0.77, 0.54, 0.35 for 10, 20 and 50 Hz, respectively, Table 4), suggesting that both pathways exhibit similar short-term plasticity after hearing onset.
32
Figure 10. Short-term synaptic plasticity of excitatory synapses evoked by stimulation of the LL and CoIC pathways and its developmental changes.
(A)Representative traces of LL-evoked (left) and CoIC-evoked (right) EPSCs in response to 5 repetitive stimulations. The data were obtained from P9-11 rats. Fibers were stimulated at 10, 20, or 50 Hz (from top to bottom).
The extracellular solution contained picrotoxin (50-100 µM) and strychnine (2 µM). Each trace is the average of 10 traces in a given cell.
(B)The same as A, but the data from P15-18 are shown
33
34
Figure 11. Summary of short-term plasticity of the lateral lemniscus (LL)- (open circles) and CoIC- (filled triangles) evoked excitatory postsynaptic currents (EPSCs).
(A) Summary of short-term plasticity of the LL- (open circles) and CoIC- (filled triangles) evoked EPSCs between P9-11. The EPSC amplitudes were averaged and subsequently normalized to the first one. The data from 10 (left;
LL, n = 23; CoIC, n = 21), 20 (middle; LL, n = 23; CoIC, n = 21) and 50 Hz (right; LL, n = 24; CoIC, n = 21) are shown. The average and the individual data are shown as black and grey symbols, respectively. The extracellular solution contained picrotoxin (50–100 μM; LL, n = 7; CoIC, n = 7) or picrotoxin+strychnine (2 μM; LL, 10–20 Hz, n = 16, 50 Hz, n = 17; CoIC, n = 14). Both conditions produced similar results. Significant differences were found in short-term plasticity between the LL and CoIC pathways. (B) Similar to A, but summary of normalized amplitude data from the LL‐ (open circles) and the CoIC‐ (filled triangles) evoked EPSCs between P15–18 is shown.
Stimulation frequency was 10 (LL, n = 20; CoIC, n = 21), 20 (LL, n = 23; CoIC, n = 20) or 50 Hz (LL, n = 18;
CoIC, n = 18). (C-D) The summary of short-term plasticity of the EPSCs recorded in voltage clamp at −70 mV without D-AP5. Because of negative holding potential, the AMPA-EPSCs should be a major component of the EPSCs. The peak amplitudes were measured by comparing the peak and the baseline just before the stimulus.
Exponential fits were not used to extrapolate the baseline level in C and D. The average data are shown as open circles (LL) and filled triangles (CoIC). C shows summary of the normalized amplitudes from the LL and the CoIC- evoked EPSCs at P8–10 rats (10–50 Hz; LL, n = 4-5; CoIC, n = 7-8). D is Similar to C, but the data were obtained from P15-18 rats (10–50 Hz; LL, n = 3-6; CoIC, n = 9).
3.5. Developmental changes in short-term synaptic plasticity of LL- and CoIC-evoked AMPA- EPSCs.
The extent of short-term plasticity is determined by both pre- and postsynaptic factors. If the time course of synaptic plasticity differs between AMPA- and NMDA-EPSCs, it is suggested that postsynaptic factors contribute to the plasticity. For example, AMPA receptors tend to be desensitized during repetitive stimulation whereas NMDA receptors do not (Koike-Tani et al., 2007). Conversely, if AMPA- and NMDA EPSCs show a similar time course, presynaptic factors are likely to determine the extent of plasticity. Indeed, by comparing the time course of AMPA- and NMDA-EPSCs during repetitive stimulation, von Gersdorff et al. (1997) suggested that the time course of synaptic depression is determined by presynaptic factors at the calyx of Held. In order to evaluate presynaptic and postsynaptic factors contributing to short-term plasticity, I examined the time course of synaptic
35
depression /facilitation between AMPA or NMDA receptor-mediated EPSCs. Particularly, I have examined whether the differences between LL- and CoIC pathways were mediated by pre- or postsynaptic mechanisms.
In order to examine short-term plasticity of AMPA-EPSCs, NMDA receptors were blocked by D-AP5 (25 or 50 µM) and the AMPA-EPSCs were recorded. Figure 12A shows example traces of LL-evoked AMPA-EPSCs (left traces) and CoIC-evoked AMPA-EPSCs (right traces) recorded from different CNIC neurons in response to repetitive stimulation. The amplitudes of the LL-evoked AMPA-EPSCs were depressed over the period of 5 stimulus pulses at all frequencies. In contrast, there was an increase in the amplitude of CoIC-evoked EPSCs in response to the 2nd stimulus pulse at all frequencies, and other responses were almost constant. Figure 13A shows a summary of short- term synaptic plasticity for LL- (n = 8, 9, 9 for 10, 20, and 50 Hz, respectively) and CoIC-evoked (n
=7, 7, 6 for 10, 20, and 50 Hz, respectively) AMPA-EPSCs. A significant difference was found between the LL and CoIC pathways (p < 0.001, F (1, 200) = 103, ANOVA test) at all frequencies (p
< 0.001 for 10, 20, and 50 Hz from post hoc multiple comparisons, Table 4). Similar results were obtained by holding the membrane potential at -70 mV in the absence of D-AP5, where contribution of the NMDA-EPSCs was supposed to be minor (Figure11C).
I next characterized short-term plasticity of the AMPA- EPSCs after the onset of hearing.
Figure 12B and 13B show example traces and a summary of the normalized EPSC amplitudes of the AMPA-EPSCs (LL, n = 10; CoIC, n = 7), respectively. In the example traces of Fig 12, synaptic depression was less pronounced in the LL pathway whereas slight facilitation was converted to depression in the CoIC pathway in older animals. I should note that the data scatter, as seen in
36
individual data in Fig 13. Compared with P9-11, the LL-evoked AMPA-EPSCs showed less depression in P15-18 (p < 0.001, F (1, 250) = 59.9, ANOVA test) at all frequencies (p = 0.0016, p <
0.001, p < 0.001 for 10, 20, and 50 Hz, respectively from post hoc multiple comparisons, Table 5), whereas CoIC-evoked AMPA –EPSCs remained relatively similar (p = 0.99, 0.99, 0.99 for 10, 20, and 50 Hz, respectively with post hoc multiple comparisons, p = 0.77. F (1, 175) = 0.089 from ANOVA test, Table 5) on average. In addition, no significant differences were detected between the LL and CoIC pathways (p = 0.160, F (1, 225) = 1.99, ANOVA test) at any frequencies at P15-18 (p
= 0.82, 0.99, and 0.99 for 10, 20 and 50 Hz, respectively from post hoc multiple comparisons, Table 4). Similar results were obtained by holding the membrane potential at -70 mV in the absence of D- AP5, where contribution of the NMDA-EPSCs was supposed to be minor (Figure 11D).
37
Figure 12. Short-term synaptic plasticity of the AMPA-EPSCs and its developmental changes.
(A) Representative traces of LL-evoked (left) and CoIC-evoked (right) AMPA-EPSCs in response to 5 repetitive stimulations. The data were obtained from P9-11. Fibers were stimulated at 10, 20, or 50 Hz (from top to bottom).
The extracellular solution contained D-AP5 (25 or 50 µM) and picrotoxin (50-100 µM), in addition to strychnine (2 µM) in some recordings.
(B) The same as A, but the data are obtained from P15-18 rats.
38
Figure 13. Summary of short-term plasticity of the AMPA excitatory postsynaptic currents (EPSCs).
(A) Summary of short-term plasticity of the LL- (open circles) and CoIC- (filled triangles) AMPA EPSCs at P9–11 rats. Average and individual data are shown as black and grey symbols, respectively. Stimulation frequency was 10 (left; LL, n = 8; CoIC, n = 7), 20 (middle; LL, n = 9; CoIC, n = 7) or 50 Hz (right; LL, n = 9; CoIC, n = 6). (B) Summary of normalized amplitude data from the LL‐ (open circles) and the CoIC‐ (filled triangles) evoked AMPA‐EPSCs (10–50 Hz; LL, n = 10; CoIC, n = 7) at P15–18 rats.
3.6. Developmental changes in short-term synaptic plasticity of LL- and CoIC-evoked NMDA- EPSCs.
The NMDA receptor-mediated EPSCs were obtained by applying an AMPA receptor antagonist, NBQX (10 µM). Figure 14A shows example traces of LL-evoked NMDA-EPSCs (left traces) and