神戸市外国語大学 学術情報リポジトリ
Sunk costs of capital and predominance of investor‑owned firms in market economies
著者 Minami Kazuhiko, Tanaka Satoru journal or
publication title
Kobe city university of foreign studies working paper series
number 17
page range 1‑25
year 2004‑12
URL http://id.nii.ac.jp/1085/00001091/
Kobe City University of Foreign Studies (
017Working Paper Series
SUNK COSTS OF CAPlTALAND
PREDOMINANCE OF INVESTOR-OWNED FIRlVIS IN MARKET ECONO:MIES
1,2Kazuhiko MINAMI3 Satoru TANAKA4 December 2004
Institute for Foreign Studies
Kobe City University of Foreign Studies
SUNK COSTS OF CAPITALAND
PREDOMINANCE OF lNVESTOR-OWNED F1RMS IN MARKET ECONOMIES1,2
Kazuhiko MINAMI3 Satoru TANAKA4 December 2004
017
lThe authors would like to thank Shiro Hagihara, Toru Kikuchi, Tetsuya Kishimoto, Mutsumi Matsumoto, Eiichi Miyagawa, Ryo-ichi Nagahisa, Noritsugu Nakanishi, Makato Okamura, Takao Okawa, and the seminar participants at Kobe University and the University of Hyogo.
2Correspondence to: Kazuhiko MlKAMI, Department of Applied Economics, University of Hyogo, 8-2-1 Gakuen Nishi, Nishi Ward, Kobe, Hyogo 651-2197, Japan.
Phone: +81-78-794-7052, Fax: +81-78-794-6166, E-mail:
3Department of Applied Economics, University ofHyogo;
4Kobe City University of Foreign Studies;
Abstract
This paper examines why investor-owned firms are predominant in market economies. It is assumed that firm owners and outside traders are asymmet- rically informed of venture risks, and that there are sunk costs associated with investment in physical and human capital. Then, we undertake an effi- ciency comparison between investor-owned and worker-owned firms. We find that it is efficient when the input supplier (the investor or worker) who incurs large sunk costs owns the firm. This is because such an input supplier can credibly signal to the other input supplier that he in fact has a safe project.
An empirical study based on the Japanese manufacturing industry seems to support the theoretical result.
JEL classification numbers: P12, P13, L22, L23
Key words: sunk costs of capital, asymmetric information, business risk, investor-owned firm, worker-owned firm
1 Introduction
The irrelevance proposition of Modigliani and Miller showed that in a well- functioning market, capital structure does not affect the value of a firm, so that debt finance is as good as equity finance for firms. This implies that intrinsically investor-owned firms, which can rely on equity finance, have no financial advantages over such firms as worker-owned firms or consumer cooperatives, which rely mainly on debt finance. In reality, however, non- investor-owned firms tend to become investor-owned as capital requirement expands. For example, many workers' cooperatives in the nineteenth century transformed themselves into investor-owned firms to cope with a growing capital requirement. Today, mutual life insurance companies, and stock ex- changes as societies of securities companies, are turning into investor-owned firms in an attempt to facilitate fund raising. Such phenomena seem to show that firms have some financial advantages by being owned by investors rather than by other classes of individuals. In the light of the irrelevance proposi- tion, and institutional reasons such as taxes being set aside, any difference between debt and equity finance must come from some failure in the market.
This paper considers the adverse-selection type of asymmetric information as the cause of market failure. 1 We first assume that the type of project, which may be safe or risky, is known to the firm owners but not to the outside traders. 2 It is also assumed that part of the resources once invested ISince financial markets are now more or less competitive, market power does not seem a principal reason for market failure. Neither do externalities, which seem uncommon in financial markets.
Another possibility of asymmetric information is moral hazard, in which non-investors can misuse capital [Hansmann [1996, chapter 4, pp.54-55]; Tirole [2001]]. Although this is surely an important aspect, it is not very clear whether such effects of moral hazard are crucial for the prevalence of investor-owned firms: as non-investors (i.e., workers, suppliers or consumers) can misuse capital in a non-capitalistic firm, investors may also be motivated to misuse labor or raw materials in a capitalistic firm. They may even produce hazardous products on purpose at a low production cost and sell them to the consumers.
2There are several occasions in which this assumption seems plausible. First, in small and mid-sized firms where the entrepreneur manages the firm, or in large firms with un- listed stocks, owners are likely to have private information. Second, in large firms with
in physical and human capital may not be recoverable in the market. We then examine comparative efficiency between investor ownership and worker ownership of the firm.
The theoretical result obtained in this study is as follows: It is efficient that the input suppliers who incur large sunk costs own the firm. That is, investor ownership is efficient when the sunk cost of physical capital is dominant, whereas worker ownership is efficient when the sunk cost of human capital is dominant. To obtain an intuitive interpretation for this result, suppose that physical capital is highly specific to the firm but human capital is quite general. In this case, because of a big difference in investors' payoffs between having safe and risky projects, investors with a safe project can credibly signal to the workers that their project is in fact safe. The firm type is thus revealed under investor ownership. On the other hand, since there is little difference in workers' payoffs between having the two types of projects, workers with a safe project cannot effectively signal their true type to the investors. The firm type is thus pooled under worker ownership. For this reason, in the present case, projects are better selected under investor ownership than under worker ownership. When physical capital is general and human capital is firm-specific, a reverse argument holds.
In the remainder of this section, we briefly present two examples in reality that may be relevant to our theoretical result.
The first example is workers' cooperatives in an early stage of the mar- ket economy. In the nineteenth century, many workers' cooperatives were established by craftsmen such as carpenters and shoe makers. The major in- centive for these cooperatives was to cope with the labor monopsony power
listed stocks, important corporate information is often disclosed to the firm owners, par- ticularly to large stockholders [Manning [1989]; Ben-Ner and Jun [1996]; Mikami [2004]].
Third, with ultimate control over management through measures such as setting perfor- mance pay for executives and deciding their dismissal, owners are more or less in a position to screen the profitability of the firm under the incumbent management team [Milgrom and Roberts, 1992, chapter 5].
exercised by large manufacturers [Mikami, 2003, section 4]. As the Indus- trial Revolution developed and production scale expanded, many of these workers' cooperatives terminated their businesses, and those that survived transformed themselves into investor-owned firms. A typical example is the cotton factory established by the Rochdale Pioneers in 1854. Initially, the factory was a worker-owned firm, where the shareholders mostly consisted of the factory workers. After a while, new shareholders were invited to the factory to finance a new project. By 1860, the factory had changed into a capitalistic firm, in which only 200 out of 1,400 shareholders were the factory workers. As for the reason for the transformation, Oakeshott [1978] explains;
'The implication is clear. The founder members could not raise that kind of money from their own resources and were not in a position to borrow it from a bank.' [Oakeshott, 1978, p.57, 1.5-7.]
This phenomenon may be well understood in our analytical framework:
when the size of the firm was moderate and production technology was labor intensive, workers' ownership was efficient. This was because capital require- ments were relatively small (so that the sunk costs of physical capital were small) and labor was important for production (so that the sunk costs of human capital were large). As production scale expanded, capital require- ments became large, and so did sunk costs of physical capital. However, potential venture risks prevented the worker-owned firms from borrowing funds from external sources. That is, financial capital was not provided to the firm through the market for fear of project failure. This difficulty may be alleviated if capital owners acquire some information by owning the firm themselves, and then make investment decisions. Transformation of the en- terprise form may thus have been an effective solution for the cooperatives to overcome the financial restrictions.
The second example is about the proportion of investor-owned firms in
manufacturing and service industries. Our theoretical result suggests that firms tend to become investor-owned when they need a large amount of spe- cific capital. Generally speaking, manufacturing firms use more physical capital than service firms do. 3 Our theory thus predicts that investor own- ership is more common in manufacturing industries than in service industries.
Indeed, in Japan, the share of investor-owned firms is 92% in manufacturing industries, whereas it is only 44% in service industries. 4
The remainder of the paper is constructed as follows. The next section presents a model of the firm with sunk costs of physical and human capi- tal. Section 3 compares the equilibrium of the firm under investor ownership and worker ownership. Section 4 empirically examines the validity of the theoretical hypothesis obtained in section 3 in the light of the Japanese man- ufacturing industry. Section 5 concludes the paper.
3Physical capital in economics roughly corresponds to tangible assets in accounting.
Tangible assets in the balance sheet consist mainly of land, buildings, and machines and equipment. Generally speaking, machines and equipment seem most specific among the three categories, though obviously there may be exceptions.
The average value of machines and equipment is in fact greater for manufacturing firms than for service firms. For very large companies with a capital value of 1 billion yen or more, the average value of machines and equipment is 17.4 billion yen for manufacturing firms, while it is 3.1 billion yen for service firms. [Ministry of International 'Dade and In- dustry, 1998 management analysis of Japanese firms. Tokyo: Ministry of Finance Printing Bureau, 2000.] For mid-sized and large companies with a capital value of 30 million yen or more, as well as 50 employees or more, the average value of machines and equipment is 1,802 million yen for manufacturing firms, while it is 436 million yen for service firms.
[Ministry of Economy, 'Dade and Industry, Results of the basic survey of Japanese business structure and activities. Tokyo: Statistics Association of Economy and Industry, 2002.]
For small and mid-sized companies, the average value of machines and equipment is 28,262 thousand yen for manufacturing firms, while it is 19,240 thousand yen for service firms.
[National Life Finance Corporation, Change in financial structure of small and midsize companies. Tokyo: National Life Finance Corporation, 2001.]
4The percentage is in the number of employees based on 2001 establishment and en- terprise census of Japan by the Ministry of Public Management, Home Affairs, Posts and Telecommunications, 2003.
2 The model
There are two input providers for the firm: an investor (labeled 1) and a worker (labeled 2). There is also a consumer (labeled 3) for the firm. They all have a risk neutral expected utility function. 5 Let Ml be l's financial capital ready for investment in firm-specific physical capital, and M2 be 2's (money-metric) value of his time (or effort) ready for investment in firm- specific human capital. Ml and M2 constitute 1 and 2's reservation payoffs, respecti vely.
If 1 invests Ml in physical capital, its resale value, denoted as
ML
may be smaller than M1 , depending on the specificity of the physical capital.Let ml := Ml - M~, which is the sunk cost associated with investment in physical capital. 2 can invest his time in the development of human capital.
If 2 spends M2 in acquiring human capital, its market value, denoted as M~,
may be smaller than M2 , depending on the specificity of the human capital.
Let m2 := M2 - M~, which is the sunk cost associated with investment in human capital.
Potentially there are two types of projects: H (for high probability of success) and L (for low probability of success). The prior probability that the project is type H is q, where 0 :::; q :::; 1. (So the probability that the project is type L is 1 -
q.)
Projects Hand L will succeed with probability tH and tL, respectively, with 0<
t L<
t H :::; 1. Let t P := qtH+
(1 - q)tL . Thetwo kinds of projects are different only in the probability of success. They require the same kind and amount of physical and human capital as input.
If a project succeeds, it yields one unit of output, which is valued at v by the consumer. If it fails, no output is produced. In the latter case, the rental fee (as the reward to the physical capital) and wage (as the reward to the
5By this assumption, the problem of risk sharing can be put out of consideration, and the efficiency of enterprise forms is determined solely by the effects of asymmetric information.
human capital) are assumed not paid. 6 We assume that the type of project is known only to the owner of the firm.
We now assume that
(1)
and
(2)
These assumptions are interpreted as follows. When a project is undertaken, the sum of payoffs to 1, 2 and 3 is v
+
M{+
M~ if a project succeeds, and M{+
M~ if it fails. Then, given risk neutrality, the expected sum of payoffs is given by tv+
M{+
M~, where t is the probability of success.On the other hand, the sum of reservation payoffs to 1, 2 and 3 is Ml
+
M2 . Therefore, a project is socially worth undertaking if tv
+
M{+
M~>
Ml
+
M2, or equivalently if v - mIlt - m2/t>
O. Assumption (1) thus implies that project H is socially worth undertaking, whereas assumption (2) implies that project L is not socially worth undertaking. Figure 1 illustrates assumptions (1) and (2). Line AB corresponds to assumption (1), inside which the inequality is satisfied. Line CD corresponds to assumption (2), outside which the inequality is satisfied. Hence, trapezoid ABDC is the area in which both assumptions are satisfied.By assumptions (1) and (2), we can define the efficiency of enterprise forms as follows.
Efficiency of an enterprise form:
An enterprise form is efficient if the firm under that enterprise form un- dertakes project H and dismisses project L in equilibrium.
6This assumption is used to keep symmetry with the price for the product, which will not be paid when the project fails. Whether the rewards to the input and the prices for the output are paid or not is inessential, however. This only matters to the redistribution of payoffs among individuals. In fact, the efficiency results will not change if the prices are assumed to be paid in case of project failure.
3 The efficient form of enterprise
Based on the model of the firm constructed in the previous section, this section compares the efficiency of the firm under investor ownership and worker ownership.
Investor-owned firm
Under investor ownership of the firm, the investor is privately informed of the project type. He invests in physical capital for the firm, hires labor at w, and sells the product to the consumer at p.
If a project is undertaken and succeeds, the payoffs to the individuals are Ul
=
P - w+ ML
U2=
w+
M~, and U3=
v - p, respectively. If it is undertaken and fails, the payoffs are, respectively, Ul =ML
U2 = M~, andU3
=
O. The expected payoffs to I and 2 when project i=
H, L is undertaken are then given by(3)
and
(4)
respectively, where t2 stands for 2's subjective probability of success. In contrast, if a project is not undertaken, the reservation payoffs to I and 2 are
(5)
and
(6)
respectively. Then, from (3) and (5), Ii (investor with project i=H,L) un- dertakes the project if and only if
p - w > -ml ..
tt
Similarly, from (4) and (6), 2 accepts w if and only if w > - . m2
- t2
(7)
(8)
Lastly, 3 buys the product if and only if
p ~ v.
(9)
Therefore, a project is undertaken if and only if there exist
(p,
w) that satisfy all (7), (8) and (9). (For analytical convenience, we assume that in a bound- ary situation Ii does not undertake the project, and 2 and 3 accept the price offers. )There exist
(p,
w) that satisfy both (8) and (9) if and only ifm2
P - w < v - - .
- t2
(10)7 Then, there exist
(p,
w) that satisfy both (7) and (10) (or equivalently all (7), (8) and (9)) if and only ifml/t
i< v - m2/t2,
or equivalently(11)
8 Hence, a project is undertaken if and only if (11) holds. The efficiency of investor ownership thus requires that
'l/Jl
(ti=
tH, t 2)>
0 and 'l/Jl (ti=
tL, t 2) ~o.
This requirement is always satisfied in a separating equilibrium by as- sumptions (1) and (2), as the proof ofthe next proposition shows. A pooling equilibrium may be inefficient in either sense that project L can be under- taken, or that project H can be dismissed. The first inequality of condition (12) in Proposition 1 prevents the former event, while the second inequality prevents the latter.
Proposition 1:
7If (8) and (9) hold, by subtracting (8) from (9) by both sides, we obtain (10). Con- versely, suppose that (10) holds. Let p = v. Then, it holds that w ~ m2/t2' Therefore, both (8) and (9) hold.
81£ (7) and (10) hold, by connecting inequalities (7) and (10), we obtain mt/ti < v - m2/t2, which yields (11). Conversely, suppose that (11), or equivalently mt/ti < V-m2/t2, holds. Let p - w = v - m2/tz. Then it holds that mt/ti < p - w. Therefore, both (7) and (10) hold.
Investor ownership is efficient if and only if
(12)
Proof:
Consider a separating equilibrium, in which the type of project is revealed.
9 If i
=
H,
since ti=
t H and t2=
t H,
we havei H H ml m2
'l/Jl
(t=
t , t2=
t )=
v - -tH - -tH(13)
which is positive by Assumption (1), so that the project is undertaken. If i
=
L, since ti=
t L and t2=
tL, we have(14)
9Separating equilibrium exists as the following example shows. Consider the case of v - m2/tP ::; mdtL. If 2 has a belief f..L2 such that f..L2 (H
I
p - w) = 0 for p - w :::; mdtH, f..L2(HI
p - w) = 1 for mdtH < p - w :::; ml/tL, and f..L2(HI
p - w) = q for p - w >mt/tL, then (wH,pH) with pH - w H = min{mdtL,v - m2/tH} constitute a separating equilibrium.
Suppose first that ml/tL < v - m2/tH. Then, since pH - wH = mdtL, f..L2(H
I
pH _ w H ) = 1. Since pH - w H = mI/tL > mI/tH , (7) is satisfied for 1H. Let w H be such that m2/tH :::; w H ::; v - ml/tL. Then, since w H 2: m2/tH, (8) is satisfied. Also, since pH = w H
+
ml/tL :::; (v - ml/tL)+
ml/tL=
v, (9) is satisfied. The transaction is thus concluded. If 1H sets a (w,p) so that p - w > ml/tL, it holds that f..L2(HI
p - w) = q.Then, in order for (8) and (9) to be satisfied, it must hold that p - w :::; v - m2/tP. This is impossible, however, since it is assumed that v - m2/tP :::; ml/tL in the present case.
The transaction thus cannot be concluded. By an obvious reason, 1H has no incentive to set (w, p) so that p - w < mdtL. Hence, (w H , pH) is the best option for 1H. On the other hand, 1L has no incentive to set (w,p) such that p - w ::; ml/tL. Also, 1L cannot conclude the transaction with (w,p) such that p - w > ml/tL by the same reason as in the case for 1H. 1L therefore withdraws from the market.
Suppose next that v - m2/tH :::; ml/tL. Then, since pH - w H = v - m2/tH, f..L2(H
I
pH _ w H ) = 1. Since pH - w H = v - m2/tH > mdtH by assumption (1), (7) is satisfied for 1H. Let w H = mz/tH and pH
=
v. Then, trivially (8) and (9) are satisfied, and the transaction is concluded. If 1H sets (w,p) with p - w > v - m2/tH, either (8) or (9) is necessarily violated, and the transaction is not concluded. Obviously, 1H has no incentive to set a (w,p) with p - w < v - m2/tH. Thus, (wH,pH) is the best option for 1H. 1L can by no means earn a positive profit by the same reason as in the previous case, and withdraws from the market.which is non-positive (in fact negative) by assumption (2), so that the project is not undertaken. Hence, investor ownership is always efficient in a separat- ing equilibrium.
Consider next a pooling equilibrium. Since the type of project is not revealed, the worker can only utilize the prior probability for the estimate of the safety level. 10 If i
= H,
since t i=
t H and t2=
t P , we have( i H P m1 m2
'ifJ1 t
=
t,
t2=
t )=
v - -t
H - -t
P(15)
which is positive by the second inequality of (12), so that the project is undertaken. If i
=
L,
since t i=
t L and t2=
t P,
we have(16)
which is non-positive by the first inequality of (12), so that the project is not undertaken. Hence, if condition (12) is satisfied, investor ownership cannot be inefficient in a pooling equilibrium.
Conversely, if an inequality of (12) IS not satisfied, then In a pooling equilibrium it holds that 'ifJ1 (ti = tH, t2 = t P)
:s
0 so that project H is10 A pooling equilibrium is inefficient in the sense that (a) project L can be undertaken, or that (b) project H can be dismissed. Such an equilibrium exists as shown in the following examples.
( a) Consider the case of v - m2/tP > ml/tL. Let (w, p) be such that ml/t L < p - w ::;
v - m2/tP. Then, (w,p) constitutes a pooling equilibrium with f1.2(H
I
p - w) = 0 for p - w ::; mI/tH, f1.2(HI
p - w) = 1 for ml/tH < p - w ::; mdtL, f1.2(HI
p - w) = q for mdtL < p - w ::; p -w,
and f1.2(HI
p - w) = 0 for p - w > p -w.
Sincep -
w
> mdtL > mdtH, (7) is satisfied for both lH and lL. Letw
= mdtp. Then, sincew
2: m2/tP, (8) is satisfied. Also, since it is assumed that p -w ::;
v - mdtP , it holds thatp::; W+(V-m2/tP) = m2/tP +(V-m2/tP) = v, and then (9) is satisfied. Thetransaction is thus concluded. Next, for a (w,p) with p - w >
P -
W, f1.2(HI
p - w) = o. Then, in order for (8) and (9) to be satisfied, it must hold that p - w ::; v - m2/tL. But this is impossible in the present case, since v - m2/tL < mdtL < p -w
(refer to assumption (2) for the first inequality). The transaction thus cannot be concluded. Obviously, lH and lL have no incentive to set a (w,p) with p - w <P -
W. Hence, (w,p) is the best option for lH and lL.(b) Consider the case of v - m2/tP ::; mdtH. Suppose that f1.2(H
I
p - w) = q for all p - w. Then, (8) and (9) are satisfied simultaneously only if p - w ::; v - m2/tP. But then, since v - m2/tP ::; mdtH < mdtL, (7) cannot be satisfied for lH and lL. Hence, both lH and lL withdraw from the market. (If the criterion of domination is applied, this equilibrium can be eliminated.)dismissed, or that 'l/JI(ti
=
tL, t2=
t P)>
0 so that project L is undertaken.An investor-owned firm is thus not efficient.
Hence, investor ownership is efficient if and only if (12) is satisfied.
II
The first inequality of (12) is concerned with the case when the type of project is L. The investor knows for sure that the type is L, so that he uses the probability of success tL to discount his sunk cost mI. On the other hand, since the worker does not know the true type of project in a pooling equilibrium, he uses tP to discount his sunk cost m2. If the left-hand side of the inequality is positive, there exist (p, w) with which project L is undertaken. Conversely, the second inequality of (12) is concerned with the case when the type of project is H. The investor knows for sure that the type is
H,
so that he uses tH to discount mI. On the other hand, since the worker does not know the true type of project, he uses tP to discount m2. If the right-hand side of the inequality is negative or equal to zero, there does not exist(p,
w) with which project H is undertaken.Figure 2 illustrates these circumstances. Line ED corresponds to the first inequality of (12). When (mI, m2) is below the line so that it is in triangle EDC, project L is undertaken by an investor-owned firm under a pooling equilibrium. Line EB corresponds to the second inequality of (12). When (mI, m2) is above the line so that it is in triangle EBA, project H is dismissed by the firm under a pooling equilibrium. When (mI, m2) is in Triangle EDB, (12) is satisfied and investor ownership is efficient.
Worker-owned firm
The pattern of transactions between the two input suppliers is symmet- rically reverse to each other under investor-owned and worker-owned firms.
Under worker ownership of the firm, the worker is privately informed of the project type. He invests in human capital for the firm, has the investor invest in physical capital and rent it to the firm at r, and sells the product to the
consumer at p.
If a project is undertaken and succeeds, the payoffs to the individuals are
UI = r+M{, U2 = p-r+M~, and U3 = v-p, respectively. Hit is undertaken and fails, the payoffs are, respectively, UI = M{, U2 = M~, and U3 =
o.
1 and 2's expected payoffs when project i = H, L is undertaken are then given by(17)
and
(18)
respectively, where tl stands for 1 's subjective probability of success. H a project is not undertaken,
1
and 2 retain their reservation payoffs,(5)
and(6)
respectively. From
(18)
and(6),
2i (worker with project i=H,L) undertakes the project if and only ifffi2
p-r
> - ..
tt
From
(17)
and(5), 1
accepts r if and only if3
buys the product if and only if(9)
holds.(19)
(20)
Similarly to the case in the previous subsection for an investor-owned firm, there exist
(p, r)
that satisfy all(19),
(20) and(9)
if and only if'lfJ2(t
i , tl) := v - ffi2 _ ffil> o.
tt
tl (21)The efficiency of worker ownership requires that
'lfJ2(t
i =tH,
t1 )>
0 and thatProposition 2: Worker ownership is efficient if and only if
(22)
Proof: The proof is symmetrical to that of Proposition 1, and is omitted.
II
Figure 3 illustrates Proposition 2, which is naturally symmetric to Figure 2. Line FC corresponds to the first inequality of condition (22). When
(mI,
m2) is in triangle FCD, project L is undertaken by a worker-owned firm under a pooling equilibrium. Line FA corresponds to the second inequality of (22). When(ml,
m2) is in triangle FAB, project H is dismissed by the firm under a pooling equilibri urn. When(mI'
m2) is in Triangle FCA, (22) is satisfied and worker ownership is efficient.Comparison
In this subsection, we compare the efficiency of the firm under the two enterprise forms.
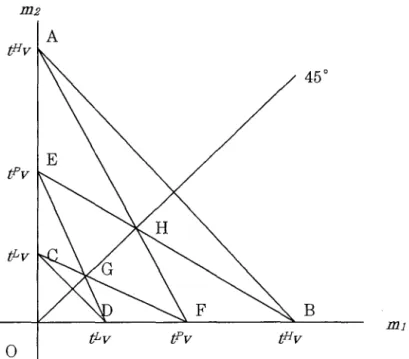
Figure 4 combines Figures 2 and 3. In triangles DGF and FHB, investor ownership is efficient, but worker ownership may be inefficient, in which case project L can be undertaken (in triangle DGF) or project H can be dismissed (in triangle FHB). Conversely, in triangles CGE and EHA, worker ownership is efficient, but investor ownership may be inefficient, in which case project L can be undertaken (in triangle CGE) or project H can be dismissed (in triangle EHA). 11 The figure shows that investor ownership has an efficiency advantage over worker ownership only when mi
>
m2, and vice versa.The next proposition deals with an extreme case where either mi or m2 is negligible.
Proposition 3:
When mi
>
0 and m2 = 0, investor ownership is always efficient, but worker ownership is not efficient under a pooling equilibrium. Conversely, when m2>
0 and mi = 0, worker ownership is always efficient, but investor ownership is not efficient in a pooling equilibrium.llIn rhomb EGFR, both investor ownership and worker ownership are efficient. In triangles CGD and ARB, both investor ownership and worker ownership may be inefficient.
Proof: Suppose that ml
>
0 and m2=
O. Then, (12) is always satisfied by assumptions (1) and (2). With m2 = 0, (22) is reduced tov - mI/t
P:s
0<
v-mIlt
P, which is necessarily violated. Similarly, when m2>
0 and ml=
0, (22) is always satisfied by assumptions (1) and (2), but (12) is necessarily violated.II
To interpret Proposition 3, suppose that ml is large but m2 is negligible.
In this case, the mechanism of signaling does not work well in the rental market for physical capital. This is because, with small m2, a profitable worker-owned firm cannot reveal its true type to the investor. Physical cap- ital is therefore not provided to the worker-owned firm through the rental market. In contrast, signaling works effectively in the labor market in this case. This is because a large ml enables a profitable investor-owned firm to reveal its true type to the worker through a high wage and a low prod- uct price. Human capital is therefore provided to the investor-owned firm through the labor market. As Mikami [2003,2004] showed, an enterprise form is comparatively efficient when the firm in that form uses well-functioning markets and dispenses with a mal-functioning market. Since the rental mar- ket does not work well whereas the labor market works well in the present case, investor ownership (which dispenses with the rental market and uses the labor market) is the efficient form of enterprise. The case when m2 is large and ml is negligible can be explained in a similar manner.
Suppose again that ml is large and m2 is negligible, and that the firm is initially owned by the worker. Apparently, (22) is violated in this case. If tP is close to tH (potentially there are many safe and a few risky projects), the first inequality is violated (apply m2 = 0 and tP = tH to the first inequality of (22), and compare it with (1)), so that a risky project can be undertaken.
Conversely, if tP is close to tL (potentially there are a few safe and many risky projects), the second inequality is violated (apply m2 = 0 and tP = tL to the second inequality of (22), and compare it with (2)), so that a safe project can
be dismissed. The latter case may explain why early workers' cooperatives had difficulty raising funds from external sources, as described in section l.
That is, fearing that the project could be unprofitable, investors hesitated about investing in the worker-owned firms that were in fact profitable.
4 An empirical examination
In this section, we empirically examine the implication of our theoretical result in the light of the Japanese manufacturing industry.
Obviously, there are several restrictions of data in conducting the study.
First, since there is no legal status for worker-owned firms in Japanese cor- porate laws, it is actually impossible to obtain systematic industry data on worker-owned manufacturers. Second, proxies for the sunk cost of human capital are largely absent in existing statistics. Third, data on the corporate form of an individual manufacturer and its tangible assets are obtainable only for large investor-owned firms with listed stocks, and not for other types of firms. Given those limitations, we will use cross-section industry data of the Census of Manufacturers [Ministry of Economy, Trade and Industry, 2001 census of manufacturers. Tokyo: National Printing Bureau, 2003], which is the most comprehensive and detailed source of statistics for manufacturers in Japan. We then attempt to measure the effects of sunk cost of physical capital on the likelihood of investor ownership of firms.
The census lists the number of employees in (a) companies (stock com- panies, limited companies and partnerships), (b) individual proprietorships, and (c) cooperatives and other corporations, by detailed (four-digit) indus- try groups. Taking account of the fact that the share of partnerships is negligible, the category of companies in the statistics seems to well match investor-owned firms in our theory. We then calculate the ratio of the number of employees in companies to the total number of employees in the indus- try, which is denoted as RAT JOi , and use it for the likelihood of investor
ownership in that industry. 12
Tangible assets are mainly made up of land, buildings, and machines and equipment. Generally speaking, land seems most general, machines and equipment most specific to the firm, and buildings somewhere between the two. The census separately lists the value of land, and the value of tangible assets except land. There are no separate data for buildings, and machines and equipment. We then calculate the proportion of the value of tangible assets except land to the total value of tangible assets (including land), which is denoted as SUN Ki . 13 Conceptually, SUN Ki shows how much money out of one yen of investment is sunk once the purchase of the tangible assets takes place in industry i. Our theory thus predicts that SUNK has a positive impact on RATIO. It should be noted that SUNKi is a proportion, and is intrinsically irrelevant to firm size.
There is an understanding that larger firms are more likely to be investor- owned. In order to control such an effect of firm size, we include in the list of explanatory variables the average number of employees of the industry, which is denoted as SIZEi . Also, it is commonly perceived that investor- owned firms are less prevalent in light industries than in heavy industries. In order to take into account such effects of industry type, we added a dummy variable called LIGHTi , which takes on 1 if the detailed industry belongs to a medium industry group of light industries, and 0 otherwise. 14
l2The data are for all establishments with four employees or more.
l3The data are for all establishments with 30 employees or more.
l4The medium industry groups of light industries include food (code 12), beverages, tobacco and feed (code 13), textile mill products (code 14), apparel and other finished products made from fabrics and similar materials (code 15), lumber and wood products (code 16), furniture and fixtures (code 17), leather tanning, leather products and fur skins (code 24), and miscellaneous manufacturing industries (34). The other industry groups can roughly be classified as heavy industries, which include pulp, paper and paper products (code 18), publishing, printing and allied industries (code 19), chemical and allied products (code 20), petroleum and coal products (code 21), plastic products (code 22), rubber products (23), ceramic, stone and clay products (code 25), iron and steel (code 26), non-ferrous metals and products (code 27), fabricated metal products (code 28), general machinery (code 29), electrical machinery, equipment and supplies (code 30), transportation equipment (code 31), precision instruments and machinery (code 32) and
The regression equation is thus given by
where the error term Ei is assumed normally and independently distributed with mean 0 and variance (J2.
There are 413 detailed industries in the census in which all RATIOi , SUNKi and SIZEi are available. We excluded one industry from these 413 samples, and created a data set with 412 detailed industries for regression analysis, which we call Data A. 15 Descriptive statistics for Data A are given in Table 1(A).
Estimated Equation A in Table 2(A) summarizes the results of OLS es- timation based on Data A. The estimated value of
/31
shows that the effect of SUNK on RATIO is positive, which is statistically significant at the 1%level. This suggests that, as the sunk portion of an investment increases by 10 percent, the share of investor-owned firms rises by about 1.34 percent.
This result is consistent with our theory that a greater sunk cost of physical capital leads to a stronger incentive for investor ownership. The effect of LIGHT on RATIO, which is given by
/33,
is negative and also statistically significant at the 1% level. This shows that the likelihood of investor owner- ship is lower in light industries than in heavy industries. The coefficient for SIZE is statistically insignificant, implying that firm size itself may not be a major factor that promotes investor ownership of the firm.Among industries in Data A, there are 43 detailed industries in which all establishments are companies so that RATIOi = 1. Since this might cause a problem in estimation, we created another data set, called Data B, by excluding these 43 industries from Data A. Descriptive statistics for Data B are summarized in Table 1(b). The results of regression based on Data ordnance and accessories (code 33).
15We excluded biological preparations (code 2063) from the data set. The category consists of the production of vaccines, blood serums, toxin, antitoxin and blood products, which are mostly under direct control of the government.
B are shown in Estimated Equation B of Table 2(B). The general tendency remains the same as in the previous results: SUNK has a positive impact on RATIO, LIGHT has a negative impact on RATIO, and the impact of SIZE is statistically insignificant.
We may thus conclude that these statistical findings support our theo- retical hypothesis that the sunk cost of physical capital has an important influence on a manufacturer's decision to become investor-owned.
5 Conclusion
In this paper, we studied comparative efficiency between investor-owned and worker-owned firms under uncertain business environments. Our theoretical results show that the relative efficiency between the two enterprise forms is determined by the amount of sunk costs of physical and human capital. In particular, when the sunk cost of physical capital is large while that of human capital is negligible, investor ownership is efficient but worker ownership may be inefficient, and vice versa. We then empirically examined the theoretical implications by referring to the Japanese manufacturing industry. In the regression analysis, we obtained a robust tendency that the sunk cost of physical capital significantly raises the likelihood of investor ownership of firms. This statistical finding seems to be consistent with our theoretical results.
Lastly, our model and analysis may be used to study firms that are owned by suppliers or consumers. For example, we commonly observe that food processing farmers' cooperatives transform themselves into capitalistic firms as their businesses grow [Mikami and Tanaka, 2000]. Such a phenomenon seems to be well explained with the analytical framework demonstrated in this paper.
References
[1] Ben-Ner, Avner, and Jun, Byoung, "Employee buyout in a bargaining game with asymmetric information." American Economic Review 86-3:
502-523, 1996.
[2] Hansmann, Henry, The ownership of enterprise. Cambridge, MA: Har- vard University Press, 1996.
[3] Manning, Alan, "An asymmetric information approach to the compar- ative analysis of participatory and capitalist firms." Oxford Economic Papers 41-2: 312-326, 1989.
[4] Mikami, Kazuhiko, "Market power and the form of enterprise: Capital- ist firms, worker-owned firms and consumer cooperatives." Journal of Economic Behavior and Organization 52-4: 533-552, 2003.
[5] Mikami, Kazuhiko, "Asymmetric information and the form of enterprise:
Capitalist firms and consumer cooperatives." Journal of Institutional and Theoretical Economics, forthcoming, 2004.
[6] Mikami, Kazuhiko, and Tanaka, Satoru, "Japanese agriculture coopera- tives in food manufacturing industries." Kobe City University of Foreign Studies Working Paper Series ~10, August 2000.
[7] Milgrom, Paul, and Roberts, John, Economics, organization and man- agement. Englewood Cliffs, New Jersey: Prentice-Hall Inc., 1992.
[8] Oakeshott, Robert, The case for workers' co-ops. London: Routledge and Kegan Paul Ltd, 1978.
[9] Tirole, Jean, "Corporate governance." Econometrica 69-1: 1-35, 2001.
Table 1
Descriptive Statistics for the Data
(A) Data A (All 412 industries)
Variable Mean Standard Minimum Maximum Correlation
deviation value value RATIO SUNK SIZE
RATIO 0.936 0.074 0.590 1.000 1.00
SUNK 0.688 0.122 0.327 0.964 0.33 1.00
SIZE 106.22 206.13 6.56 2719.20 0.08 0.07 1.00
(B) Data B (369 industries with RATIOi* 1)
Variable Mean Standard Minimum Maximum Correlation
deviation value value RATIO SUNK SIZE
RATIO 0.929 0.075 0.590 0.999 1.00
SUNK 0.681 0.118 0.327 0.937 0.32 1.00
SIZE 85.01 83.90 6.56 495.33 -0.03 0.05 1.00
Table 2
Results of Estimation
(A) Estimated Equation A (based on Data A)
Estimates t-value Intercept 0.871* 47.87
SUNK 0.134* 5.31
SIZE 0.000 0.75
LIGHT -0.075* -11.72
Adj R2=0.33
Sample size N = 412
(B) Estimated Equation B (based on Data B)
Estimates t-value Intercept 0.871* 43.01
SUNK 0.134* 4.78
SIZE -0.000 -1.07
LIGHT -0.074* -10.99
Adj R2=0.32
Sample size N
=
369Note: Suffix
*
shows that the estimates are statistically significant at the 1% level.Figure 1
Area of (ml,m2) that satisfies Assumptions (1) and (2)
Assumption (1) is satisfied when (ml,m2) is inside line AB, and Assumption (2) is satisfied when (ml,m~ is outside line CD.
A
C
D B
o
tLvFigure 2
Efficiency of an Investor"owned Firm
Project L can be undertaken in triangle EDC, while project H can be dismissed in triangle EBA. An investor-owned firm is efficient in triangle EDB.
A tfiv
E
B
/;Lv tfiv
o
Figure 3
Efficiency of a Worker-owned Firm
Project L can be undertaken in FeD, while project H can be dismissed in FAB. A worker-owned firm is efficient in triangle FCA.
tftv A
[;Lv
B
[;Lv ifv tftv
o
Figure 4
A Comparison
In triangles DGF and FHB, an investor-owned firm is efficient but a worker-owned firm may be inefficient. In triangles CGE and ERA, a worker-owned firm is efficient but an investor-owned firm may be inefficient. In rhomb EGFH, both investor-owned and worker-owned firms are efficient. In triangles CGD and ABB, both investor-owned and worker-owned firms may be inefficient.
A