INVITED PAPER
Special Section on Network Resource Control and Management Technologies for Sustainable Social Information InfrastructureModeling Upper Layer Reaction to QoS Degradation as a Congestion Avoidance Mechanism
Shigeaki HARADA†a),Member, Keisuke ISHIBASHI††,Senior Member,andRyoichi KAWAHARA†††,Member
SUMMARY On the Internet, end hosts and network nodes interdepen- dently work to smoothly transfer traffic. Observed traffic dynamics are the result of those interactions among those entities. To manage Internet traffic to provide satisfactory quality services, such dynamics need to be well understood to predict traffic patterns. In particular, some nodes have a function that sends back-pressure signals to backward nodes to reduce their sending rate and mitigate congestion. Transmission Control Proto- col (TCP) congestion control in end-hosts also mitigates traffic deviation to eliminate temporary congestion by reducing the TCP sending rate. How these congestion controls mitigate congestion has been extensively inves- tigated. However, these controls only throttle their sending rate but do not reduce traffic volume. Such congestion control fails if congestion is per- sistent, e.g., for hours, because unsent traffic demand will infinitely accu- mulate. However, on the actual Internet, even with persistent congestion, such accumulation does not seem to occur. During congestion, users and/or applications tend to reduce their traffic demand in reaction to quality of service (QoS) degradation to avoid negative service experience. We previ- ously estimated that 2% packet loss results in 23% traffic reduction because of this upper-layer reaction[1]. We view this reduction as an upper-layer congestion-avoidance mechanism and construct a closed-loop model of this mechanism, which we call the Upper-Layer Closed-Loop (ULCL) model.
We also show that by using ULCL, we can predict the degree of QoS degra- dation and traffic reduction as an equilibrium of the feedback loop. We ap- plied our model to traffic and packet-loss ratio time series data gathered in an actual network and demonstrate that it effectively estimates actual traffic and packet-loss ratio.
key words: closed loop, congestion avoidance, latent traffic demand
1. Introduction
The volume and variation in Internet traffic have been in- creasing[2],[3]. Such traffic is generated by many hetero- geneous players, such as content providers and social net- work services (SNS) providers, and received by end-users, whose usage patterns are dynamically changing. Between these players, network providers store and forward the traf- fic with various traffic-control mechanisms. Therefore, traf- fic patterns actualized in a network are determined through interaction mechanisms among many players.
Because of the increase in traffic volume, networks sometime become congested[4]–[7]. Congestion is defined
Manuscript received May 21, 2019.
Manuscript revised August 8, 2019.
Manuscript publicized November 14, 2019.
†The author is with NTT Network Technology Laboratories, NTT Corporation, Musashino-shi, 180-8585 Japan.
††The author is with Division of Arts and Sciences, College of Liberal Arts, International Christian University, Mitaka-shi, 181- 8585 Japan.
†††The author is with Faculty of Information Networking for In- novation and Design, Toyo University, Tokyo, 115-0053 Japan.
a) E-mail: [email protected] DOI: 10.1587/transcom.2019NRI0001
as “a state or condition that occurs when network resources are overloaded, resulting in impairments for network users as objectively measured by the probability of loss and/or de- lay”[8]. Senders, receivers, and transmitters try to mitigate this state by using congestion avoidance mechanisms [9].
For example, network nodes store temporary traffic over- loads in their buffers. When the buffers are full, the nodes simply drop incoming packets or some nodes have a back- pressure mechanism that informs backward nodes to pause to send packets[10]. When congestion lasts longer and can- not be absorbed by node buffers, Transmission Control Pro- tocol (TCP) congestion control equipped in end-hosts can mitigate the congestion by reducing the TCP sending rate.
To provide a satisfactory Internet service, network op- erators need to understand those interaction mechanisms and predict traffic patterns. There is a large amount of litera- ture on analyzing congestion controls and modeling their be- havior to clarify the equilibrium that the control achieves in various environments and with TCP parameters[11]–[13].
There have also been analyses in which TCP connection stochastically occurs to bring a certain amount of data. In these analyses, the normalized average load is assumed to be smaller than one (traffic load is smaller than the link ca- pacity). If the load is larger than one, unsent traffic will infinitely accumulate and transfer time may significantly in- crease (this phenomenon is called ‘congestion collapse’).
In an actual Internet service, however, even in a persistent overload state, this phenomenon does not seem to occur[7].
Therefore, there are assumed to be other mechanisms to re- duce traffic during persistent congestion.
Along with such transport or under layer mechanisms, the dynamics of user-communication behaviors, such as abandoning watching video streaming in reaction to qual- ity of service (QoS) degradation, have recently been inves- tigated as user engagement with Internet services. Various application-level controls dynamically also change content size (video streaming bit-rate) depending on the degree of QoS degradation. Though these reactions are not intended to reduce network traffic load, they reduce it as a result and mitigate congestion. We previously introduced the possibil- ity that with these upper-layer reactions, traffic demand may be latent when congestion occurs and QoS is degraded[1].
We also proposed a method of inferring the latent traffic de- mand by developing a model for the degree of traffic re- duction as a function of QoS degradation, which is called the Common Trend and Regression with Independent Loss (CTRIL) model.
Copyright c2020 The Institute of Electronics, Information and Communication Engineers
For this paper, we view the upper-layer reaction to QoS degradation as a congestion-avoidance mechanism. With this idea, we can understand why, even in a persistent con- gested network, the above phenomenon (i.e., congestion collapse) has been avoided. Then, if this upper-layer reac- tion avoids congestion collapse, a question naturally arises:
in what situation does this upper-layer reaction work and how? To answer this question, borrowing the idea of Low et al.[11], we constructed a closed-loop model, named Upper- Layer Closed-Loop (ULCL), that describes this mechanism.
The ULCL model provides the degree of QoS degradation and actualized traffic as an equilibrium state with given la- tent traffic demand and link capacity. To the best of our knowledge, this paper is the first attempt to view this upper- layer reaction as a congestion-avoidance mechanism and model this mechanism.
The main objective of the study is to understand and model the upper-layer reaction to QoS degradation as a closed-loop congestion-avoidance mechanism. In addition, we also discuss some applications and implications of the model. For example, network designers can estimate the impact of congestion due to a possible network failure by predicting the degree of QoS degradation with given latent traffic demand and capacity of rerouted links. Network re- searchers can also asses the requirement of additional con- gestion controls when user/application reaction changes by changing the sensitivity parameters of the ULCL model that express how upper layers reduce their traffic volumes in re- action to QoS degradation. We discuss these applications in Sect. 6.
The rest of the paper is organized as follows. In Sect. 2, we briefly survey current congestion-avoidance mechanisms and their modeling. Then in Sect. 3, we discuss the possi- bility of traffic reduction as an upper-layer reaction to QoS degradation and a method of inferring latent traffic demand, which was shown in our previous paper[1]. In Sect. 4, we introduce an idea that the above reaction can be consid- ered as a congestion-avoidance mechanism and a construct a ULCL model to infer the equilibrium state of the mech- anism. We also discuss an experimental analysis of this model in Sect. 5 and applications and implications of this model in Sect. 6. We finally summarize our results and im- plications in Sect. 7.
2. Congestion-Avoidance Mechanisms
In this section, we first briefly review the transport- and lower-layer congestion-avoidance mechanisms and their modeling. Then, we discuss the possibility of traffic-volume reduction by users and/or applications as a reaction to QoS degradation (Fig. 1).
2.1 Transport- and Lower-Layer Congestion Controls Congestion avoidance mechanisms or controls prevent or mitigate congestion[9]. They are categorized 1) node-based control that corresponds to link-layer or network-layer con-
Fig. 1 Congestion-avoidance mechanisms implemented in various lay- ers. Link- and transport-layer mechanisms, 1’) and 2’), respectively, as lower-layer controls. We argue the possibility of upper-layer mechanism 3’).
trol and 2) host-based control that corresponds to transport- layer control. We briefly review these two types of conges- tion controls and their modeling below.
A node stores temporal overloaded traffic in its buffer.
If the node has a back-pressure-type congestion control, it detects the congestion state by the increase in its queue length in the buffer. It then notifies the nodes located be- tween the sender-host and the congested nodes and requests them to reduce their sending rates [10]. This type of con- trol is implemented in link-layer technology. For exam- ple, IEEE802.3 has a “pause” control to indicate connected nodes to suppress sending packets[14]. In addition, Frame- Relay has functions called backward explicit congestion no- tification (BECN) and forward explicit congestion notifica- tion (FECN) that indicate the sender-side digital service unit (DSU) to reduce the data-transfer rate. Back-pressure-type congestion control is modeled and analyzed in which the control is stabilized (i.e., converges to an equilibrium state) in terms of the arrival rate, control delay, and control param- eters (gain)[10],[15]–[17].
In addition, there have also been proposals to com- bine back-pressure-type control with network-layer control, such as traffic engineering (routing), as back-pressure rout- ing[18],[19].
However, these node-based controls absorb overloaded traffic at the buffers of those nodes; thus, they can only absorb congestion whose duration is the buffer time scale (buffer size (bits) divided by link speed (bps)), which is at most sub seconds for most network nodes.
A transport-layer function, such as Transmission Con- trol Protocol (TCP), adjusts its sending rate as host-basis congestion control. It can absorb congestion longer than the node buffer time scale because unsent traffic can be stored inside sending hosts. In this congestion control, the con- gestion state is notified to the sender implicitly or explic- itly. In the implicit control, the sender recognizes the con- gestion state from packet loss or delay increase. There are many variants of TCP to achieve heterogeneity, scalability, and fairness[8]. A TCP variant was recently developed that uses the estimated available bandwidth to adjust its sending rate [20], and this control is adopted not only to TCP but also to User Datagram Protocol (UDP)[21].
The explicit control detects congestion through mes- sages sent by intermediate nodes marked in forward or back- ward packets (explicit congestion notification) [22]. The random early detection (RED) can also be considered as in this line[23]. A method has recently been proposed that reports not only the existence of congestion but also an in- crease in queuing delay for data-center networks[24].
There is a large amount of literature on analyzing such congestion control as a closed loop to seek the condition un- der which the control is stable, or equilibrium state achieved by TCP in various environments and TCP parameters[11]–
[13]. Low et al. modeled the behaviors of various TCP ver- sions as an optimization problem[11]. Specifically, by con- sidering the degree of congestion as a price, a congestion control system is modeled for finding the optimum send- ing rate to maximize the utility of sending traffic minus cost determined by the price. Because the price (degree of con- gestion) will increase as the traffic rate increases, there are equilibrium points. They also proposed a TCP-control algo- rithm based on a control-theoretic framework. Takagaki et al. also took the control theoretic approach to investigate the stability and equilibrium on a TCP closed control loop[13].
These studies focused on network links that are shared by TCP connections that always have data to send.
There have also been studies that focused on which TCP connections statistically arrive at a network with a fi- nite size of data to send[25]–[27]. In these studies, connec- tions were assumed to share link capacities fairly and the processor-sharing model was applied to evaluate the per- formance of TCP connections. These studies focused on elastic traffic, which does not require a specific sending rate but dynamically adapts to the available bandwidth by TCP control. Berger and Kogen[28]proposed a method of pro- visioning link bandwidth in existing TCP control loops for elastic data traffic. Kawahara et al. also proposed a method of bandwidth dimensioning using TCP flow statistics[29].
These methods can infer required bandwidth for a specified performance objective for a given traffic load.
Although these studies focused on temporal overload, they assumed that traffic load, which is arrival rate multi- plied by the average size of each connection, is smaller than capacity in terms of the long-run average value. Thus, these models cannot be applied to persistent congestion, e.g., longer than that of most connections (sub-hours). This is be- cause current congestion-avoidance mechanisms, whether link/network layer or transport layer, only control the send- ing rate not traffic volume. On the sender side and above the transport layer, however, applications or users that gen- erate traffic to be sent might respond to congestion and de- crease traffic volume. Fredj et al.[25]proposed a model on traffic reduction in an overload case due to user impatience.
That is, users terminate flows when flow duration exceeds a threshold depending on flow size. The model was simulated but not verified by using actual data.
2.2 Upper-Layer QoS Degradation Reaction
User behaviors as reactions to QoS degradation have been investigated as user engagement with Internet services. The objective is to optimize user retention of or engagement with services under various QoS and quality of experience (QoE) circumstances[30],[31]. For example, Krishnan and Sitaraman showed that video-starting delay of more than 2 s results in a 5.8% increase in abandonment rate [30].
Dobrian et al. evaluated the relationship between user en- gagement with a video streaming service (video play time) and application-level performance such as stalling length of video replay[31]. Along the same lines, Koto et al. investi- gated the relationship between web-browsing behavior and network performance (download throughput)[32].
In addition to such user reactions, application-level control that dynamically adjusts contents size (video bitrate) in accordance with the available network QoS has recently been proposed and implemented[33]. This control aims to maintain moderate QoE even with degraded QoS by avoid- ing streaming stalling with low-grade video. With this con- trol, traffic demand will decrease when QoS is degraded.
Optimizing video bitrate in accordance with QoE with pre- dicted QoS (available bandwidth) has recently gained much attention[34]–[38].
From the viewpoint of network operators, such user/application-level reactions can be considered as feed- back control that mitigates congestion in the network. To the best of our knowledge, there have been no studies on the above relationship, which we modeled and verified in this study.
3. Estimating Latent Traffic Demand
We now briefly summarize our previously proposed model (the CTRIL model), which enables the inference of latent traffic demand. In the next section, we introduce a negative feedback model by using the CTRIL model. We summarize the notations introduced in Sects. 3, 4 in Table 1.
To infer the volume of latent traffic, which is not ac- tualized and cannot be measured, we assume that diurnal patterns of link-traffic time series are almost the same when the links are used for the same service and homogeneous users[39]. We then prepare traffic time series of an uncon- gested link, whose traffic might not be changed from latent traffic demand, and that of a congested link, whose traffic volume might decrease due to QoS degradation. Based on the assumption that latent traffic of both links shares a di- urnal pattern, the difference in actualized traffic patterns be- tween both links is caused by QoS degradation.
We adopted a state space model to represent the above assumption[1]. Figure 2 shows the overall structure of the model, which is described hereafter. We use packet-loss ra- tio as the degree of QoS degradation. To model this struc- ture, we begin with two actualized traffic-demand time se- ries measured at congested and uncongested links and de-
Table 1 Notations. The subscript of link typelis omitted in Sect. 4.
N Number of time slots
∆ Duration of time slot [s]
Tl={Tl,t}tN=1 Actualized traffic time series of link typel (l=uindicates uncongested link andl=c denotes congested link)
Ll={Ll,t}N
t=1 Packet-loss ratio time series of link typel {Yt}Nt=1 Latent traffic demand pattern time series
αl Scale parameter of link typel γ QoS degradation effect parameter
Dc,t:=αcYt Latent traffic demand time series at con- gested link
v(t) White noise of observation w(t) White noise of latent state renewal
T Random variable representing actualized traffic deviation at congested link in time slot, the average of which isTc,t
P(T) Probability density function ofT
δ Parameter that determines the variance ofT asδTt
C Capacity of congested link
Fig. 2 Common Trend and Regression with Independent Loss (CTRIL) model. Time series variables are grouped in rectangles. Blue circles are observed variables, and grey circles are unobserved variables and to be estimated.
noted as Tc = (Tc,1, . . . ,Tc,N) and Tu = (Tu,1, . . . ,Tu,N), respectively (N is the number of measurement periods).
Specifically, bothTu,tandTc,tare traffic rates averaged dur- ing a measurement time bin∆[s]. Thus, the total measure- ment duration isN∆[s]. In the same manner, we denote the packet-loss-ratio time series on both congested and uncon- gested links as Lc,t andLu,t, respectively. We use Lc,t and Lu,t as exogenous time series in this section. As described above, the latent traffic demand for bothTc,tandTu,tshare a common diurnal pattern. LetYtbe the time series that repre- sents the common diurnal pattern. We also introduce scale parametersαcandαuto express the difference between the diurnal pattern and actual traffic volumes for the congested and uncongested links, respectively. The scale parameters correspond to the number of users for the respective links.
We then assume that the packet-loss ratio exponentially de- creases actualized traffic from the latent traffic as follows:
Tc,t = αcYtexp(−γLc,t)+v(t) (1) Tu,t = αuYtexp(−γLu,t)+v(t), (2)
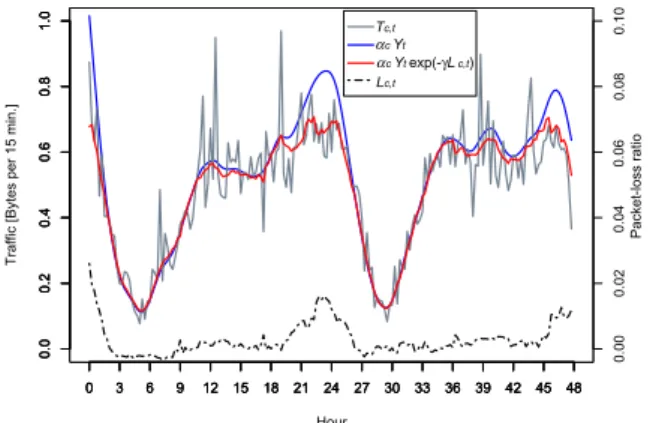
Fig. 3 Modeling with CTRIL for overloaded and underloaded link traf- fic.
wherev(t) is white noise the average of which is zero, and γis a regression parameter and called the “QoS degradation effect parameter.” This meansγdescribes how much users or applications reduce actualized demand from latent traffic demand with a given degree of QoS degradation (Lt).
We defineDc,t:=αcYtas the latent traffic demand for a congested link, which coincides with the averageTc,tifLc,t
equals zero. To obtain the diurnal pattern, we adopt a local trend model forYtthat can be represented as follows[40]:
Yt−Yt−1 =Yt−1−Yt−2+w(t), (3) where w(t) is another type of white noise the average of which is zero. Then, by adopting a Bayesian inference method, such as the Markov chain Monte Carlo (MCMC) method, we can inferYtas well as other parameters such as γ,αc,t,αu,t, and the variances ofv(t) andw(t).
We now discuss our previous experimental results[1].
We used 48-hour-long data measured from August 2nd to 3rd, 2013 at congested and uncongested links. A link was defined as congested if its actualized traffic reached its ca- pacity and showed a plateau during at least one hour. On the other hand, a link was defined as uncongested if its ac- tualized traffic averaged in each time bin (15 minutes) did not reach its capacity. We selected such links and moni- tored their traffic. One time bin lasted 15 min; thus, the time series had 192 time bins. The physical bandwidths of the links were both 1 Gbps. Both links were aggregation links of Internet access in the same area. Their traffic was domi- nated by HTTP traffic, which consisted of 60 ∼70% of the total traffic depending on the time periods. A packet loss was detected as a re-order event of a TCP sequence number.
Thus, we measured packet losses that occurred not only at the monitored links but at some points in the end-end path.
To focus on packet losses occurring at the monitored link, we subtracted the mean value of packet losses at the uncon- gested link. We also extracted apparent outliers in the time series that did not seem to occur at the monitored links.
Figure 3 shows the results for the CTRIL model. The maximum likelihood estimate (MLE) of the regression coef- ficient (γin Eq. (2)) was 13.2. Thus, when packet-loss ratio is 1%, the CTRIL model predicted that traffic demand would
decrease by 12.3% (=1−exp(−0.01×13.2)×100).
4. Modeling Upper-Layer Congestion-Avoidance Mech- anisms
In the previous section, we discussed the possibility that ac- tualized traffic decreases due to QoS degradation and con- structed the CTRIL model, which quantitatively relates QoS degradation and actualized traffic decrease. On the other hand, QoS degradation is mainly caused by actualized traffic increase. If we combine the two relationships, we can obtain a closed loop where actualized traffic increase causes QoS degradation, which in turn decreases actualized traffic. This closed loop can be considered as a congestion-avoidance mechanism that maintains QoS degradation to some extent, even though latent traffic increases. In this section, we first discuss the construction of a model for QoS degradation due to traffic increase and then its combination with the CTRIL model to construct a closed-loop model named ULCL, bor- rowing the idea of Low et al.[11], which involves modeling a TCP closed-loop control. We also show that we can pre- dict the degree of QoS degradation and actualized traffic as an equilibrium given latent traffic demand.
Note that, because the CTRIL model infers latent traffic demand with observed actualized traffic volume and the de- gree of QoS degradation, by inversely adopting the CTRIL model, we can also infer the degree of QoS degradation with given latent traffic demand and actualized volume. In con- trast, the ULCL model infers the degree of QoS degradation with given latent traffic demand andlink capacity, not the actualized traffic volume, which is obtained as the equilib- rium of the close-loop mechanism.
4.1 QoS-Degradation Model
There are many models for QoS degradation as a function of link load. These models have been studied in queuing theory. Specifically, the packet-loss ratio and delay are ex- pressed by stochastically modeling the traffic-arrival pro- cess. However, these models mainly cover an average link load of under 100% and are difficult to apply to a congested link where the average link load is over 100%. We adopted the simple zero buffer approximation (ZBA) [41], which does not require an arrival process of actualized traffic and simply estimates the packet-loss ratio even with a congested link.
Hereafter, we use the packet-loss ratio and traffic of only the congested link and omit subscriptcfrom the vari- ables. As described in Sect. 3,Tt is the average traffic rate during∆[s], and traffic rateT deviates aroundTt. LetP(T) be the probability distribution function ofT, which deviates around Tt. ZBA approximates Lt, the average packet-loss ratio during∆, as the probability thatTexceeds the link ca- pacityC[bps] as follows:
Lt = Z max
T−C T ,0
P(T)dT
=Z ∞
C
1−C
T
P(T)dT. (4)
Because ZBA ignores the buffering effect, it overesti- mates packet-loss probability even if P(T) is correct. On the other hand, if P(T) underestimates the tail probability, it results in underestimation of the packet-loss probability.
Because of the above two effects, the packet-loss ratio is not accurately estimated, as discussed in the next section. Con- structing a more complex time-series model for the arrival process of traffic and finite buffer effect is for future work.
Because the marginal distribution of backbone traffic tends to obey a Gaussian distribution[42], which is param- eterized with mean and variance, we adopted the Gaussian distributionP(T). However, other probabilistic distributions can also be applied.
The average ofP(T) is provided asTtobtained through the CTRIL model. However, the variance is not provided with the CTRIL model and should be separately estimated.
If the traffic-generation processes of flows comprising link traffic are independent, then the variation in link traffic is proportional to the average link traffic[43]and we can ap- proximate the variation asσ2 =δTtand adopt this approxi- mation equation†.
4.2 Derivation of Packet-Loss Ratio and Actualized Traf- fic as Equilibrium
Summarizing the previous subsection, we can approximate packet-loss ratio Lt with ZBA and Gaussian distribution, whose mean and variance are denoted as Tt and δTt. At the same time, the CTRIL model provides theTtof Eq. (6).
Thus, we have the following simultaneous equations on Lt
andTt:
Lt(Tt)= Z ∞
C
1−C
T 1
√2πδTt
exp(−(T −Tt)2 2δTt
)dT (5)
Tt(Dt,Lt)=Dtexp(−γLt) (6) whereDt:=αYtis the latent traffic demand at timet. Here, the Eq. (6) explicitly expressesTtas the function ofDtand Ltcompared with Eq. (2).
We now discuss the existence and uniqueness of the solution for the above equations. First, if we setLtto two extremes, i.e., Lt =0 andLt = 1, in Eq. (6), then we have Tt(Dt,0)=DtandTt(Dt,1)=Dtexp(−γ), respectively. On the other hand, for arbitraryTtincludingDtandDtexp(−γ), 0 ≤ Lt(Tt) ≤ 1 in Eq. (5) becauseLt(Tt) is the probabil- ity calculated as an integral of the normal distribution den- sity function. Thus, from the intermediate value theorem, at least one solution exists for the equations for Tt in the
†In fact, the traffic-generation process of flows might not be independent due to TCP congestion control, as noted in Sect. 2, TCP congestion control smooths actualized traffic, and variation would decrease compared with the average link traffic. Including the TCP congestion control effect on the variation of link traffic, such as[44], is for future work.
Fig. 4 Negative feedback between actualized traffic and QoS given latent traffic demand. Actualized traffic increase causes QoS degradation, and QoS degradation reduces actualized traffic from latent traffic demand.
Fig. 5 Conceptual diagram of equilibrium of packet-loss ratio and actu- alized traffic given latent traffic demand.
range [Dexp(−γ),D] and forLtin the range [0,1]. Because Tt(Dt,Lt) is a non-increasing function onLtandLt(Dt) is a non-decreasing function onDt, the solution is unique.
By solving Eqs. (5) and (6), we can obtain the solution ofLtand actualized trafficTtgivenDt. This solution is actu- alized as an equilibrium of the closed-loop of traffic increase
→QoS degradation→traffic reduction. Whereas the effect of traffic increase→QoS degradation is actualized with the buffering time scale (buffer size divided byC), the effect of QoS degradation→ traffic reduction is actualized with the time scale of user/application behavior. If we observe the loop with a larger time scale of both effects, then we can observe the equilibrium state ofLtandTt(Fig. 4). Figure 5 shows the idea of the equilibrium of the negative feedback loop givenDt. The equilibrium varies over the curveLt(Tt) with varyingDt.
5. Experimental Analysis
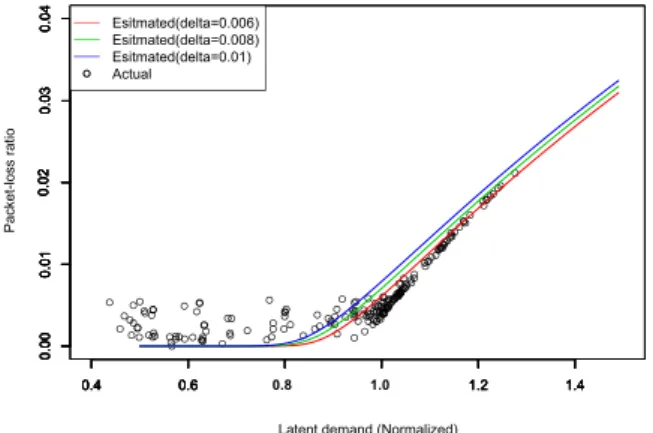
We calculated the equilibrium of the ULCL model by using the data in Sect. 4. Because the variance in actualized traffic deviated 0.006 ∼ 0.01 times the average actualized traffic rate, we approximated the variance withδ=0.006∼0.01.
First, we evaluated the packet-loss-ratio estimation with ZBA. Figure 6 compares the actual packet-loss ratio of the congested link and estimated packet-loss ratio obtained from Eq. (5). Although we observed some discrepancies
Fig. 6 Estimation of packet-loss ratio with zero buffer approximation.
Fig. 7 Packet-loss-ratio estimation as equilibrium of packet-loss ratio.
between the actual and estimated packet-loss ratios during slots 100 to 180, in other time slots, both packet-loss ratios agreed. Thus, we used Eq. (5) for estimating the packet-loss ratio.
Next we calculated the equilibrium-loss ratio by vary- ing Dt. The γ was set to 13.2, which was estimated in Sect. 3. Because Eqs. (5) and (6) of the ULCL model cannot be analytically solved, we solved them numerically with the semi-Newton method. As a comparison, we also plotted the actual packet-loss ratio with the estimated Dt. The Dtwas normalized withC. Figure 7 shows the results. We can see that when the normalizedDtwas under 1.0, there was a dis- crepancy, but when it is over 1.0, the actual and estimated packet-loss ratios agreed. This indicates that the observed packet-loss ratio can be obtained through the converged sta- tus of the closed-loop.
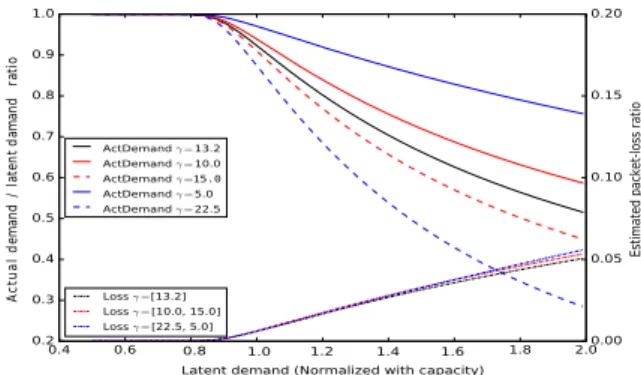
5.1 Equilibrium for Various QoS Degradation Effect Pa- rameter Values
We analyzed simultaneous Eqs. (5) and (6) to derive the equilibrium-loss ratio and actualized traffic by varying γ as well as when different γ values are mixed. We used δ=0.006 to calculate actualized traffic variance†.
†In this evaluation, we determinedδby using actual packet- loss data. Determining the parameter without such data remains as
Fig. 8 Actualized traffic and packet-loss ratio by varying QoS degrada- tion effect parameterγ.
Figure 8 shows the estimated packet-loss ratio when changingγto 10.0 and 5.0; other than 13.2. Latent traffic was changed from 0.4 to 2.0 timesC. We also calculated the ratio of actualized traffic toDt. WhenDtincreased to twice ofC, actualized traffic halves fromDtas the packet-loss ra- tio increased to 0.05 ∼ 0.11 with various γvalues. This is the closed-loop mechanism that reduces actualized traf- fic with the QoS degradation. Asγdecreases, which means that the QoS effect decreases, a higher packet-loss ratio is needed to decrease actualized traffic toC.
Theγ was estimated as 13.2 in Sect. 3, where domi- nant traffic is expected as video streaming, the application of which has various upper-layer closed-loop such as video bitrate control by server-side applications or user abandon- ment of video watching. However, if the dominant applica- tion is different and generates its traffic independently to the degree of QoS degradation,γbecomes small and the actu- alized packet-loss ratio might increase, as shown in Fig. 8.
We call such traffic QoS insensitive traffic. For example, machine generated traffic such as software updates or trans- ferring sensing data is an example of QoS insensitive traffic, because even though the application-level QoS degrades de- pending on the (network-level) QoS degradation, the traffic generation patterns are relatively independent of QoS degra- dation. We analyze the effect of such traffic in the next sub- section.
5.2 Equilibrium for Heterogeneous Traffic
Thus far, we have assumed that link traffic is homogeneous andγis the same for all traffic in the link traffic. However, users/applications in link traffic are heterogeneous, and pa- rameterγmight differ. We now derive the closed-loop and equilibrium for heterogeneous traffic. Assume that there are n types of traffic, whose QoS degradation effect parame- ters areγi,(i =1. . .n), and their latent traffic demands are Di,t,(i = 1. . .n). Packet-loss ratio can be assumed to be the same for all traffic types (e.g.,Li,t = Ltfor alli) if two conditions are met: 1) The congested link does not adopt a future work, but as shown in Fig. 7, the equilibrium state is rather insensitive toδand we might use a larger values ofδfor safe-side evaluation.
Fig. 9 Equilibrium for heterogeneous QoS degradation effect.
queuing control that differently processes packets depend- ing on their traffic type (e.g., the queue is a simple FIFO), and 2) there is no dominant traffic type whose connections generate their traffic in a synchronized manner and cause congestion at the same time (traffic time series and packet loss time series are independent)[46]. Those assumptions are expected to be met at a backbone link that handles a rel- atively large number of connections. In that case, actualized traffic for traffic typeican be expressed as follows:
Ti,t(Lt,Di,t) = Di,t(1−exp(−γLt)). (7) Thus, the probability distribution of the traffic sum can be identified as the distribution whose mean and vari- ance of Eq. (5) are replaced with Pn
i=1Ti,t(Lt,Di) and δPn
i=1Ti,t(Lt,Di), respectively. Thus, the equilibrium can also be calculated.
We now discuss the results of the numerical evaluation for the heterogeneous-traffic case. Let there be two types of traffic whose mix ratios are 50%. We considered three cases:
those in which the QoS degradation effects are (13.2,13.2), (10.0,15.0), and (5.0,22.5). We calculated the equilibrium packet-loss ratio and actualized traffic ratioTi,t/Dt, where Dtvaried from 0.4 to 2.0. The results are shown in Fig. 9.
Whereas the equilibrium packet-loss ratios were almost the same for all cases, the actualized traffic ratios significantly differed. That is, when the difference betweenγs was large, then actualized traffic ratios was also large.
Therefore, as previously described, if machine- generated traffic increases, then QoS-sensitive traffic ratio severely decreases due to QoS degradation. For congestion avoidance mechanisms, fairness among traffic types is a key index to be achieved[8]. In terms of the congestion avoid- ance mechanism modeled in this paper, which reduces traf- fic volume during congestion, one possible definition of fair- ness is the difference among the ratios of actualized traffic to latent traffic (i.e., if all traffic types reduce their traffic with the same ratio, then the mechanism is fair). With simulta- neous Eqs. (5) and (6) mentioned in Sect. 4.2, we can quan- titatively calculate the above ratios for all traffic types and calculate the difference among the traffic types. By using the calculated fairness index, we can evaluate the necessity of a congestion-control mechanism other than the end-end user/application-level feedback mechanism.
6. Applications and Implications
For network operators, the ULCL model can predict the de- gree of QoS degradation and the actualized traffic with the given volume of latent traffic demand and link capacity even if the volume is persistently larger than the capacity. Al- though it should be avoided, traffic is occasionally routed to a link whose capacity is below the volume of the traffic. Our ULCL model can be used to predict the users’ or applica- tions’ impact on the basis of the degree of QoS degradation and traffic reduction from the latent traffic.
Our model can be used by network researchers to as- sess the necessity of transport or lower-layer congestion control. Specifically, current congestion controls are evalu- ated in terms of their stability, efficiency, and fairness. How- ever, our model derives a new aspect of fairness: not only ac- tualized flow rate (throughput) but also how much the flow decreases the volume of traffic from the latent demand. Our model has a sensitivity parameter to determine how the up- per layer reduces traffic volume in reaction to QoS degra- dation. If users or applications have different sensitivity pa- rameters, then we might have to evaluate the fairness among flows during congestion with the given parameters as pre- sented in Sect. 5.2.
In addition, the above fairness should be predicted in advance for the case when the application mix changes, e.g., machine generated traffic such as IoT traffic will increase.
Although there are debates on which state is fair[47], to as- sess fairness, this upper-layer mechanism should be taken into account because even when fairness at the transport layer is achieved and the state is achieved by sacrificing some users/applications to reduce traffic as a reaction to QoS degradation, it cannot be considered as fair from the user/application point of view.
7. Conclusion
We discussed the possibility of viewing upper-layer reac- tion to quality of service (QoS) degradation as a congestion- avoidance mechanism and constructed a closed-loop model, named Upper-Layer Closed-Loop (ULCL), that links traffic volume to the degree of QoS degradation and vice versa. By using our model, we can predict the packet-loss ratio and ac- tualized traffic given latent traffic demand by considering the actualized traffic ratio as service impact due to QoS degra- dation of user/application.
This paper is just a preliminary study, and just one se- ries of data was evaluated. Thus, the universality and appli- cability of our model and its parameters should be evaluated with various types of data. Specifically, though γis esti- mated as 13.2 with the measured data, the value depends on the data. To apply our ULCL model to other data whose application mix is different, we need to haveγs for every ap- plication and take their weighted sum. To do this, we need do have traffic data that can be separated for each application such as Deep Packet Inspection (DPI) data. In addition, an
effort should be made to estimateγfrom user engagement models that describe how much user communication behav- ior will change depending on the degree of QoS[30]–[32].
Our model also has much room for improvement, as in estimating the degree QoS degradation as a function of input traffic. A more sophisticated time series model should be applied to ULCL.
In modeling the upper-layer reaction, we assume that the time scale differs from those of other congestion- avoidance mechanisms. However, in reality, there should be overlapping among time scales and behaviors should be interdependent; thus, those mechanism should be in- tegrated [45]. We believe that by combining upper-layer congestion-avoidance mechanisms with current congestion control such as the Transmission Control Protocol (TCP), we will provide a comprehensive view of Internet traffic congestion-avoidance mechanisms that explains why con- gestion collapse is avoided even in persistent congestion links.
References
[1] K. Ishibashi, S. Harada, and R. Kawahara, “Inferring latent traf- fic demand offered to an overloaded link with modeling QoS- degradation effect,” IEICE Trans. Commun., vol.E102-B, no.4, pp.790–798, April 2019.
[2] Cisco, “Cisco visual networking index: Forecast and methodology, 2016–2021,” https://www.cisco.com/c/en/us/solutions/collateral/ser vice-provider/visual-networking-index-vni/complete-white-paper-c1 1-481360.pdf June 2017.
[3] Ministry of Internal Affairs and Communications, “Aggregation and provisional calculation of Internet traffic in Japan,” http://
www.soumu.go.jp/main sosiki/joho tsusin/eng/Releases/Telecommu nications170207 1.html, Feb. 2017.
[4] M. Fukushima and S. Goto, “Analysis of TCP flags in congested network,” IEICE Trans. Inf. & Syst., vol.E83-D, no.5, pp.996–1002, May 2000.
[5] C. Lee, D.K. Lee, Y. Yi, and S. Moon, “Operating a network link at 100%,” Proc. International Conference on Passive and Active Mea- surement (PAM2011), 2011.
[6] N. Feamster, “Revealing utilization at Internet interconnection points,” Proc. 44th Research Conference on Communication, Infor- mation and Internet Policy 2016, Sept. 2016.
[7] A. Dhamdhere, D.D. Clark, A. Gamero-Garrido, M. Luckie, R.K.P.
Mok, G. Akiwate, K. Gogia, V. Bajpai, A.C. Snoeren, and K.C.
Claffy, “Inferring persistent interdomain congestion,” Proc. ACM SIGCOMM 2018, Budapest Hungary, Aug. 2018.
[8] D. Papadimitriou, M. Scharf, and B. Briscoe, “Open research is- sues in internet congestion control,” Internet engineering task force, RFC6077, Feb. 2011.
[9] R. Jain and K.K. Ramakrishnan, “Congestion avoidance in computer networks with a connectionless network layer: Concepts, goals and methodology,” Proc. Computer Networking Symposium, pp.134–
143, Washington DC, USA, 1998.
[10] Y. Lu, R. Pan, B. Prabhakar, D. Bergamasco, V. Alaria, and A. Bal- dini, “Congestion control in networks with no congestion drops,”
Proc. 44th Annual Allerton Conference on Communication, Con- trol, and Computing, Monticello, IL, Sept. 2006.
[11] S.H. Low, F. Paganini, and J.C. Doyle, “Internet congestion control,”
IEEE Control Syst. Mag., vol.22, no.1, pp.28–43, Feb. 2002.
[12] R. Pletka, A. Kind, M. Waldvogel, and S. Mannal, “Closed-loop congestion control for mixed responsive and non-responsive traffic,”
Proc. IEEE Globecom 2003.
[13] K. Takagaki H. Ohsaki, and M. Murata, “Analysis of a window- based flow control mechanism based on TCP Vegas in heteroge- neous network environment,” IEICE Trans. Commun., vol.E85-B, no.1, pp.89–97, Jan. 2002.
[14] O. Feuser, “On the effects the IEEE 802.3x flow control in full- duplex ethernet LANs,” Proc. 24th Conference on Local Computer Networks (LCN’99), 1999.
[15] J. Jiang and R. Jain, “Analysis of backward congestion notification (BCN) for Ethernet in datacenter applications,” Proc. IEEE INFO- COM, May 2007.
[16] J. Jiang, R. Jain, and C. So-In, “An explicit rate control framework for lossless Ethernet operation,” Proc. IEEE ICC 2008.
[17] W. Jiang, F. Ren, C. Lin, and I. Stojmenovic, “Analysis of backward congestion notification with delay for enhanced Ethernet networks,”
IEEE Trans. Comput., vol.63, no.11, pp.2674–2684, Nov. 2014.
[18] L. Tassiulas and A. Ephremides, “Stability properties of constrained queuing systems and scheduling policies for maximum throughput in multihop radio networks,” IEEE Trans. Autom. Control, vol.37, no.12, pp.1936–1948, Dec. 1992.
[19] J. Liu, N.B. Shroff, C.H. Xia, and H.D. Sherali, “Joint congestion control and routing optimization: An efficient second-order dis- tributed approach,” IEEE/ACM Trans. Netw., vol.24, no.3, pp.1404–
1420, June 2016.
[20] N. Cardwell, Y. Cheng, C.S. Gunn, S.H. Yeganeh, and V. Jacobson,
“BBR: Congestion-based congestion control measuring bottleneck bandwidth and round-trip propagation time,” ACM Queue, vol.14, no.5, Dec. 2016.
[21] A. Langley, A. Riddoch, A. Wilk, A. Vicente, C. Krasic, D. Zhang, F. Yang, F. Kouranov, I. Swett, J. Iyengar, J. Bailey, J. Dorfman, J.
Roskind, J. Kulik, P. Westin, R. Tenneti, R. Shade, R. Hamilton, V.
Vasiliev, W. Chang, and Z. Shi, “The QUIC transport protocol: De- sign and Internet-scale deployment,” Proc. ACM SIGCOMM2017, 2017.
[22] S. Floyd, “The addition of explicit congestion notification (ECN) to IP,” RFC3168, 2001.
[23] S. Floyd and V. Jacobson, “Random early detection (RED) gateways for congestion avoidance,” IEEE/ACM Trans. Netw., vol.1, no.4, pp.397–413, 1993.
[24] S. Bensley, D. Thaler, P. Balasubramanian, L. Eggert, and G. Judd,
“Data center TCP (DCTCP): TCP congestion control for data cen- ters,” RFC8257, Oct. 2017.
[25] S.B. Fredj, T. Bonald, A. Proutiere, G. Regnie, and J.W. Roberts,
“Statistical bandwidth sharing: A study of congestion at flow level,”
ACM SIGCOMM Comput. Commun. Rev., vol.31, no.4, pp.111–
122, 2001.
[26] T. Bonald and J. Roberts, “Internet and erlang formula,” ACM SIG- COMM Comput. Commun. Rev., vol.42, no.1, Jan. 2012.
[27] T. Bonald, P. Olivier, and J. Roberts, “Dimensioning high speed IP access networks,” Proc. ITC, 2003, Berlin, Germany, Aug. 2003.
[28] A.W. Berger and Y. Kogan, “Dimensioning bandwidth for elastic traffic in high-speed data,” IEEE/ACM Trans. Netw., vol.8, no.5, pp.643–654, Oct. 2000.
[29] R. Kawahara, K. Ishibashi, T. Asaka, S. Sumita, and T. Abe, “A method of bandwidth dimensioning and management using flow statistics,” IEICE Trans. Commun., vol.E88-B, no.2, pp.643–653, Feb. 2005.
[30] S.S. Krishnan and R.K. Sitaraman, “Video stream quality impacts viewer behavior: Inferring causality using quasi-experimental de- signs,” ACM IMC2012, Boston, MA, USA, Nov. 2012.
[31] F. Dobrian, A. Awan, D. Joseph, A. Ganjam, J. Zhan, V. Sekar, I.
Stoica, and H. Zhang, “Understanding the impact of video quality on user engagement,” ACM SIGCOMM2011 Toronto, Canada, Aug.
2011.
[32] H. Koto, N. Fukumoto, S. Niida, H. Yokota, S. Arakawa, and M.
Murata, “Users’ reaction to network quality during web browsing on smartphones,” Proc. 26th International Teletraffic Congress (ITC), Sept. 2014.
[33] ISO/IEC DIS 23009-1.2, Dynamic adaptive streaming over HTTP (DASH), 2012.
[34] X. Yin, A. Jindal, V. Sekar, and B. Sinopoli, “A control-theoretic approach for dynamic adaptive video streaming over HTTP,” Proc.
ACM SIGCOMM, pp.325–338, Aug. 2015.
[35] K. Spiteri, R. Urgaonkar, and R.K. Sitaraman, “BOLA: Near- optimal bitrate adaptation for online videos,” IEEE INFOCOM, pp.1–9, 2016.
[36] H. Mao, R. Netravali, and M. Alizadeh, “Neural adaptive video streaming with Pensieve,” ACM SIGCOMM, pp.197–210, Aug.
2017.
[37] T. Kimura, M. Yokota, A. Matsumoto, K. Takeshita, T. Kawano, K.
Sato, H. Yamamoto, T. Hayashi, and K. Shiomoto, “QUVE: QoE maximizing framework for video-streaming,” IEEE J. Sel. Topics Signal Process., vol.11, no.1, pp.138–153, Feb. 2017.
[38] Y. Sani, A. Mauthe, and C. Edwards, “Adaptive bitrate selection: A survey,” IEEE Surveys Tuts., vol.19, no.4, pp.2985–3014, 4th quar- ter 2017.
[39] A. Lakhina, M. Crovella, and C. Diot, “Diagnosing network- wide traffic anomalies,” ACM SIGCOMM Comput. Commun. Rev., vol.34, no.4, 2004.
[40] J. Durbin and S.J. Koopman, Time Series Analysis by State Space methods, Oxford University Press, 2012.
[41] M. Zukerman, “Introduction to queueing theory and stochastic tele- traffic models,” https://arxiv.org/abs/1307.2968
[42] K. Ishibashi, R, Kawahara, T. Mori, T. Kondoh, and S. Asano, “Ef- fects of sampling and spatio/temporal granularity in traffic monitor- ing on anomaly detectability,” IEICE Trans. Commun., vol.E95-B, no.2, pp.466–476, Feb. 2012.
[43] R. Morris and D. Lin, “Variance of aggregated Web traffic,” Proc.
IEEE INFOCOM2000, 2000.
[44] K. Ishibashi, R. Kawahara, T. Asaka, M. Aida, S. Ono, and S. Asano,
“Detection of TCP performance degradation using link utilization statistics,” IEICE Trans. Commun., vol.E89-B, no.1, pp.47–56, Jan.
2006.
[45] M. Chiang, S.H. Low, A.R. Calderbank, and J.C. Doyle, “Layering as optimization decomposition: A mathematical theory of network architectures,” Proc. IEEE, vol.95, no.1, pp.255–312, Jan. 2007.
[46] K. Ishibashi, M. Aida, and S. Kuribayashi, “Proposal and evaluation of method to estimate packet loss-rate using correlation of packet de- lay and loss,” IEICE Trans. Inf. & Syst., vol.E86-D no.11, pp.2371–
2379, Nov. 2003.
[47] B. Briscoe, “Flow rate fairness: Dismantling a religion,” ACM SIG- COMM Comput. Commun. Rev., vol.37, no.2, April 2007.
Shigeaki Harada received his B.S., M.S., and Ph.D. in information science from Tohoku University in 2001, 2003, and 2006. Since joining NTT Network Technology Laboratories (formerly NTT Service Integration Laborato- ries) in 2006, he has been engaged in research on traffic analysis and traffic control in IP net- works. He is a member of IEICE.
Keisuke Ishibashi received his B.S. and M.S. in mathematics from Tohoku University in 1993 and 1995 and his Ph.D. in information sci- ence and technology from the University of To- kyo in 2005. From 1995 to 2018, he worked at NTT Laboratories, where he was involved in research on the measurement and analysis of In- ternet traffic and performance. He is currently an associate professor of information science at the International Christian University. He is a member of IEICE, IEEE, and the Japan Society for Software Science and Technology. He received Best Paper Awards from IEICE in 2019.
Ryoichi Kawahara received his M.E. in automatic control and his Ph.D. in telecommuni- cation engineering from Waseda University, To- kyo, Japan, in 1992 and 2001. He joined NTT Laboratories in 1992, and was engaged in re- search on traffic control for telecommunication networks, traffic measurement and analysis for IP networks, and network management, for 26 years. He is currently a professor at the Depart- ment of Information Networking for Innovation and Design, Faculty of Information Networking for Innovation and Design, Toyo University. He is a member of IEICE, IEEE, and ORSJ. He received Telecom System Technology Award from The Telecommunications Advancement Foundation in 2010 and Best Pa- per Awards from IEICE in 2003 and 2009.