Two‑polar growth strategy in Myanmar : seeking
"high" and "balanced" development
著者 Kudo Toshihiro, Kumagai Satoru
権利 Copyrights 日本貿易振興機構(ジェトロ)アジア
経済研究所 / Institute of Developing
Economies, Japan External Trade Organization (IDE‑JETRO) http://www.ide.go.jp
journal or
publication title
IDE Discussion Paper
volume 371
year 2012‑11‑01
URL http://hdl.handle.net/2344/1255
INSTITUTE OF DEVELOPING ECONOMIES
IDE Discussion Papers are preliminary materials circulated to stimulate discussions and critical comments
Keywords: Myanmar (Burma), Yangon, Mandalay, economic geography, agglomeration, regional inequality, border development, population, poverty alleviation, connectivity
JEL classification:F23, L67
* Senior Research Fellow, Research Planning Department, Institute of Developing Economies, JETRO ([email protected]).
** Director, Economic Integration Studies Group, Inter-disciplinary Studies Centre, Institute of Developing Economies, JETRO ([email protected]).
*** The authors are grateful to comments on the first manuscript of this paper from the Foreign
IDE DISCUSSION PAPER No. 371
Two-Polar Growth Strategy in Myanmar: Seeking “High” and
“Balanced” Development
Toshihiro KUDO* and Satoru KUMAGAI**
November 2012
Abstract
The Thein Sein government of Myanmar seeks higher and balanced economic growth. This is a challenge for the government since some economic literature identifies a trade-off between higher economic growth and better regional equality, especially for countries in the early stages of development. In this paper, we propose a two-polar growth strategy as one that includes both
“high” and “balanced” growth. The first growth pole is Yangon, and the second is Mandalay.
Nay Pyi Taw, the national capital, will develop as an administrative centre, not as an economic or commercial one. We also propose border development with enhanced connectivity with richer neighboring countries as a complementary strategy to the two growth poles. Effects of the two-polar growth strategy with border development are tested using a Geographical Simulation Model (GSM). ***
The Institute of Developing Economies (IDE) is a semigovernmental, nonpartisan, nonprofit research institute, founded in 1958. The Institute merged with the Japan External Trade Organization (JETRO) on July 1, 1998.
The Institute conducts basic and comprehensive studies on economic and related affairs in all developing countries and regions, including Asia, the Middle East, Africa, Latin America, Oceania, and Eastern Europe.
The views expressed in this publication are those of the author(s). Publication does not imply endorsement by the Institute of Developing Economies of any of the views expressed within.
INSTITUTE OF DEVELOPING ECONOMIES (IDE), JETRO 3-2-2, WAKABA,MIHAMA-KU,CHIBA-SHI
CHIBA 261-8545, JAPAN
©2012 by Institute of Developing Economies, JETRO
Introduction
Since President U Thein Sein assumed power in March 2011, the Myanmar government has inaugurated wide-ranging reforms in both economic and political areas. The government has improved monetary and fiscal management, facilitated trade and foreign direct investment (FDI), and has started to build physical, legal, and institutional infrastructures (ADB 2012:1).
On 19 June, 2012, President U Thein Sein declared that the government had entered into the second phase of its reform strategy focusing on economic development (NLM dated 20 June, 2012). The government has already drawn a five-year short-term National Plan (FY2011-FY2015) and submitted it to Parliament.
The Myanmar government targets a 1.7 rise in per capita GDP through this National Plan. However, the President has also said that the government’s goal is to triple per capita GDP in the same period. The government is thus seeking very high economic growth. At the same time, President U Thein Sein has also announced four economic policies: (1) sustaining agriculture development towards industrialization and all-round development; (2) balanced and proportionate development among states and regions with equal share of budget and taxation, foreign aid and foreign and local investment; (3) inclusive growth for entire population, and (4) compilation of quality and accurate statistics.
Given its rich endowment of resources including a diligent and literate population of six-million and rich investment opportunities in a range of sectors, the prospects for Myanmar's high growth is bright.1 It is understandable that the government prioritizes agriculture as a source of broad-based development and poverty reduction.
Agriculture accounts for 36% of GDP, employs a majority of the workforce, and generates 25% to 30% of export earnings. Inclusive growth for entire population is a new word for Myanmar, but no one disagrees with the concept. Myanmar's official statistics provide data that is obsolete and narrowly covers the country's economic and industrial situation. It is critically important for policy makers to have timely and accurate statistics. Thus, three out of four policies are good and reasonable.
The second economic policy, balanced economic growth with an equal share of budget and investment, seems inconsistent with high economic growth. We argue later that the cost of policies that inhibit an economic agglomeration can be harmful to economic growth, particularly for those economies in their early stages of development (Brülhart and Sbergami, 2009). Nevertheless, it is necessary for the Myanmar government to reduce the income gap among regions and states and between urban and rural areas. It is also necessary for the government to reduce the incidence of incidence of poverty that varies substantially by regions and state.
How to achieve “high” and “balanced” growth is a challenge when we try to see
1 However, it is unrealistic for the Myanmar economy to achieve a 1.7- increase in per capita GDP with the five-year National Plan, much less a triple increase.
long-term development in Myanmar. This paper addresses this issue by proposing a two-polar growth strategy with border development, an idea that solves two issues with one approach. The first section provides a theoretical framework with review literature on economic growth, regional equality, and ASEAN experiences. The second section includes review of economic geography in Myanmar. We propose a two-polar growth strategy in the third section as an idea that includes both “high”
and “balanced” growth. Nevertheless, this strategy alone may not address the development of remote and mountainous areas in Myanmar. Section four examines border development that includes enhanced connectivity with neighboring countries as a strategy that is complementary to two-polar growth. Finally, we provide a summary discussion and conclusion.
1. Theoretical Framework
1.1 Literature on economic growth and regional income inequality
“Balanced regional economic growth” is an attractive policy slogan at present in a world where many countries suffer and fail to manage regional income inequality.
But there is a question as to whether or not equality with higher economic growth is feasible in the first place.
There are a number of studies that examine the relationship between economic growth and regional income inequality. Williamson (1965) examined 24 countries in both cross-section and time-series and found that regional income inequality increases in the early stage of development but starts to decrease as the economy matures (the so-called Williamson Hypothesis). He expressed concern for widening regional inequality in developing countries by citing Kuznetz’ speach’2: ”Can… the underdeveloped societies withstand the strain which further widening of income inequality is likely to generate?” This concern is still valid in the 21st century.
Regional income inequality is not just an adverse effect of economic growth.
Theoretical studies in spatial economics generally agree that these two phenomena have circular causation. Not only does economic growth enhance economic agglomeration, but economic agglomeration enhances economic growth. The rationale is as follows: Inevitably, economic growth is geographically uneven because some regions have more advantage in doing business than other regions. Workers and firms tend to agglomerate in developed regions where they seek higher wages and larger markets. Thus, economic growth enhances economic agglomeration. At the same time, economic agglomeration is a source of positive externalities such as labour pooling and knowledge spillover. It makes it possible to provide physical and institutional infrastructures efficiently with limited resources. Therefore, economic agglomeration enhances economic growth.
2 The speech is delivered at the American Economic Association in 1954
Statistically, Henderson (2003) examines growth enhancing effects of urban concentration for some 70-80 countries for the period 1960-1990 in 5-year intervals.
He insists that: (1) economic concentration in the country’s primary city has pro-growth effects at the beginning, but this effect peaks out once the degree of concentration reaches an “optimal” level, (2) the “optimal” level of economic concentration declines as output per worker increases, and the country becomes richer. Brulhart and Sbergami (2009) have confirmed that the agglomeration of economic activity boosts economic growth until the per capital income of the country reaches about 10,000 US dollars (2006 prices).
These studies imply that there is a trade-off between higher economic growth and lower regional inequality, at least for countries below some income level. Thus, it is important to avoid putting too much emphasis on regional equality, especially in the very early stages of economic development. Otherwise, uniform distribution of limited development resources is likely to result in “equally poor.” Basically, economic agglomeration is good for everyone. As Fujita and Thisse (2002) indicate,
“even those who stay put in the periphery are better off than under dispersion provided that the growth effect triggered by the agglomeration is strong enough”
(p.391). This means that the economic growth of the economic centre is fast enough when boosted by agglomeration effects. Even the income of people living in the economic periphery increases because of spillover effects from the richer economic centre.
The World Bank (2009) conducted an across-the-board study on spatial aspects of economic development, and the main message of the study was that “Economic growth will be unbalanced, but development still can be inclusive. … The way to get both the immediate benefits of the concentration of production and the long-term benefits of a convergence in living standards is economic integration.” (p.1). We return to these points of economic integration, economic growth, and regional inequality later.
1.2 Experiences of ASEAN countries
Most ASEAN countries have recorded fairly high economic growth rates for the last several decades. It is important to learn how the geographical concentration of economic activity in these countries has changed during this rapid economic growth period. What can be learned from the experiences of these ASEAN countries for Myanmar? The benchmarks for Myanmar seem to be Thailand and Vietnam, both of which have similar land areas and population sizes relative to Myanmar.
Thailand and Vietnam have a contrasting spatial structure of economic activities with each other. Thailand is a typical “one-polar” country while Vietnam is clearly a
“two-polar” country. Figure 1 shows the GDP density (GDP per km2) of Thailand, Myanmar and Vietnam. For Thailand, it is obvious that country’s economic activity is concentrated around Bangkok. This shows that Thailand is a mono-centric country.
For Vietnam, there are two agglomerations of economic activities around Hanoi in
the north and Ho Chi Minh City in the south, showing that Vietnam has two poles of economic activity, distantly located relative to each other.
Considering the spatial development strategy of Myanmar, it is important to choose whether it is to be one-polar or two-polar. We investigate this in the next section.
Figure 1. GDP density of Thailand, Myanmar and Vietnam
(Source) Authors based on IDE-GSM dataset
2. Economic Geography in Myanmar
The territory of Myanmar is 1.8 times larger than Japan, and the country has geographical and climatic diversity with levels of population and industrial concentration that vary from district to district. To form a long-term development vision for Myanmar, it is necessary to investigate its current economic geography.
2.1 Population and population densities by State/Region (and District)
Myanmar’s official statistics provide considerably data that is outdated and narrowly covers its economic and industrial situation. Data on geographical economic activities are particularly lacking. Even statistics of population by region, one of the most important geo-economic statistics, is not reliable. A population census of Myanmar has not been conducted since 1983, and most population data published later depends on estimations based on the outdated 1983 census.
Here, various available sources are combined to compile population data at the district level in 2009. Specifically, population by district in a state/division is estimated based on the share of eligible voters in the general elections held in November 2010, and the population share of state/division is based on the population estimation of 2008.
At the national level, Myanmar’s population density is about 70-90 people per square kilometer. It is lower than Vietnam (260 people per square kilometer) and Thailand (130 people per square kilometer). But Myanmar’s population densities by district significantly differ from each other, and the national average does not have much meaning.
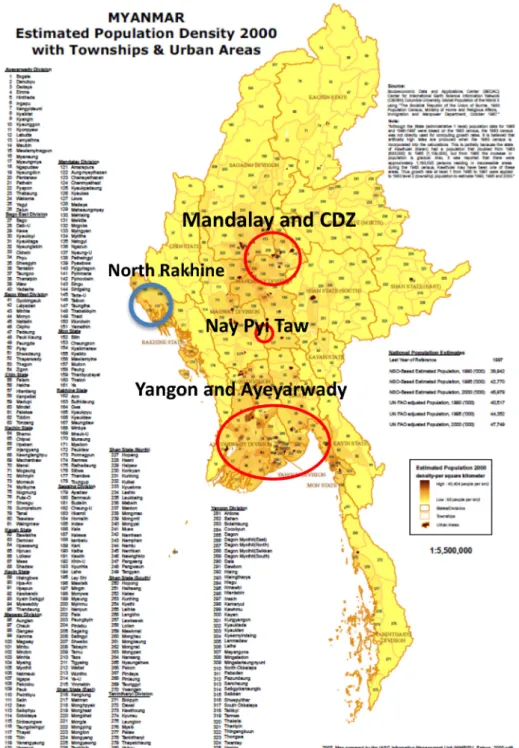
Figure 2 shows population densities by township. The population density of regions along the Ayeyarwady River is generally high. Specifically, Mandalay is highest (1440 people per square kilometer), and Yangon (589 people per square kilometer) follows. These two areas are the center of population agglomeration. On the other hand, the population of mountainous districts is very low. There are some areas where the population density is less than 10 people per square kilometer, such as Puta-O, Bawlake, Hkamti, Monghast and Langkho.
Figure 2. Estimated population densities by township (2000)
(Source) Based on Myanmar Information Management Unit (MIMU) 2.2 Estimation of GDP by district
Official data of GDP by region is difficult to obtain in Myanmar. An alternative way to estimate economic activities in developing economies is to use the strength and distribution of nighttime lights. It is now widely known that the strength of nighttime lights and economic activity are firmly correlated. Normally, the relationship between these two phenomena is determined by coefficients derived
from regression analyses using “actual” data and nighttime light satellite imagery (Ghosh et al 2010). Here, we use nighttime lights to estimate the distribution of GDP at a district level, taking the national GDP as given.
Here, GDP by district is estimated assuming that non-agricultural economic activities are distributed with the same share of nighttime lights while agricultural production is distributed with the same share as the share of agricultural land of each district as it appeared in the agriculture census of 2003.
As Figure 1 shows, there are three regions that have high GDP density: Yangon, Nay Pyi Taw, and Mandalay.3 It is certain that Yangon and Mandalay are centers of economic activity. In the case of Nay Pyi Taw, newly established as the capital city in 2005, the GDP estimation based on light emission is likely to be an over-estimation because the supply of electricity in Nay Pyi Taw is exceptionally good compared with other cities, and this certainly affects the relationship between economic activity and nighttime light emission.
2.3 Industrial distribution
Figure 3 shows the number of plants of major business categories in the five major areas of industrial concentration as of April 1997.4 About 70% of privately owned plants registered at the Directorate of Industrial Supervision and Inspection (DISI) were concentrated in these five major areas (Yangon, Mandalay, Bago, Ayeyarwady, and Sagaing). The five business categories (Food products, Textiles, Wood, wood products, Metal products, Motor vehicles and trailers) accounted for 88% of the total private registered industries in Myanmar. We can see some of these features in the industrial distribution of Myanmar:
First, the food processing industry constitutes the largest share for all regions and states. The food processing industry accounts for 63% of all industries in Myanmar in terms of number of enterprises (about 75% in areas other than Yangon and Mandalay). The five business categories of Figure 3 account for 88% of the total number of enterprises. This indicates that manufacturing in Myanmar has been centered on simple processing of agricultural products, weaving textiles, timber cutting, and blacksmith activities,5 with business categories being non-diversified, and processing technologies remaining at low levels.
Second, textile, wood processing, metal processing, and machine manufacturing
3 See also Kumagai et al (2012).
4 The data source for this figure is the Directorate of Industrial Supervision and Inspection (DISI) of Ministry of Industry (1), now the Ministry of Industry. The data is outdated, but the industrial structure has changed little in the last decade, and the picture presented here is relevant to the present.
5 “Textiles” mainly includes weaving textiles. “Wood, wood products” mainly includes timber sawing mills. “Metal products” mainly includes blacksmith activities. “Motor vehicles and trailers” mainly includes vehicle repair workshops.
industries constitute a large percentage of industries in Yangon and Mandalay. This suggests some level of diversification. The food processing industry accounts for 46%
and 40% of all industries in these two regions, respectively.
Third, the concentration of textile, metal, automobile, and trailer manufacturing industries (centering on automobile parts, metal and machine processing, and repair workshops) in Mandalay is noteworthy. More than 60% of textile manufacturers in the country are located in Mandalay, and when those in the adjacent Magway are included, nearly 80% of the nation's textile manufacturers appear to be concentrated in the central part of Myanmar. Most of these establishments appear to be those making "longyi" (sarongs) and cotton blankets, as well as other textiles.
Industries that repair automobiles and manufacture automobile spare parts and machine parts, are concentrated in the Mandalay industrial zone, where about 150 small automobile repair workshops are located. Nearly 70% of the medium- and large-size trucks and buses that connect Yangon and Mandalay are reported to be serviced and repaired in this industrial zone. Automobiles in Myanmar are mostly secondhand models that were made more than ten years ago. These generate great demand for spare parts and repair services. As a result of skills in imitating the technologies of others and the many shops which repair antiquated vehicles, Mandalay has been the largest base for automobile-related businesses. In addition to automobile-related workshops, there are a number of plants where electric appliances, agricultural machines and equipment, and other types of machinery are actively being manufactured, making this area the country's largest in machine manufacturing.
Fourth, in Yangon there were a considerable number of plants other than those related to the five major business categories. About 40% of those classified as
"others" in Figure 3 were concentrated in this area. These included business categories such as rubber and plastic products, base metal products, publishing and printing, chemical products, and paper manufacturing. In this sense, it can be said that industrial concentration in Yangon is the most diversified in the country.
In Myanmar, a “large-scale plant” is defined as one that satisfies at least one of the following conditions: (1) an amount of investment in excess of 5 million Kyat (about 6,250 US dollars), (2) yearly production output of over 10 million Kyat (about 12,500 US dollars), (3) power equipment of 50HP or higher, or (4) more than 100 employees.
This indicates an inclusion of plant sizes equivalent to those of medium- and small-scale enterprises in other countries such as Japan.
Regarding the number of private industries in Myanmar, small-scale plants were dominant, accounting for 80% of the total number of plants in 2000, while large-scale plants accounted for only 5%. However, in terms of production output and amount of investment, large-scale plants accounted for 37% and 40%, respectively. Given the corresponding figures for small-scale plants, 36% and 37%, respectively, large-scale plants had slightly larger shares compared to small-scale plants. Despite large-scale plants having fewer employees (24% of the total, which was less than half that of small-scale plants 57%), the fact that they play a vital role in relatively capital-intensive business categories cannot be overlooked (Kudo, 2012).
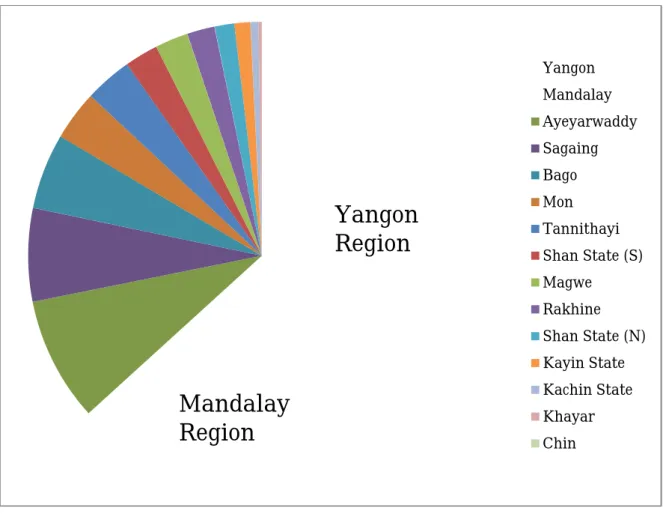
Figure 4 shows that 43% of private large-scale plants were located in Yangon in 2009, followed by Mandalay (21%), Ayeyarwady (9%), Sagaing (6%) and Bago (5%). In other areas, there were virtually no large-scale plants.6
6 With regard to medium-scale plants, Mandalay had 28%, followed by Yangon (24%), Sagaing (11%), Ayeyarwady and Bago with 9% each.
A majority of the large-scale plants were located in Yangon and Mandalay. Moreover, factories in Yangon accounted for 26% of the total number of employees of the whole country in 2000, 30% of production output, and 37% of total investment. Yangon was ahead of
0 1000 2000 3000 4000 5000 6000 7000 8000
(Source) DISI, Ministry of Industry (1).
Figure 3. Number of private industries in major regions by business categories, as of April 1997
Food products Textiles
Wood, wood products Metal products
Motor vehicles and trailers Others
Mandalay. Therefore, Yangon can be regarded as the largest centre of private industry in the country. In Yangon, more than half of all workers were employed at large-scale plants in 2000. This is in sharp contrast to the situation in other regions and states where most of workers were employed in small- and medium-scale plants.
Figure 4. Distribution of large-sized private industries in 2009
(Source) DISI, Ministry of Industry (1).
3. Two-Polar Growth Strategy
3.1 The question: one-polar or two-polar
From the population and GDP density by district, and industrial distribution, we found that Yangon is eligible to be the first pole of economic growth because both economic activities and population are already agglomerated in the Yangon region.
We also found that the second pole of economic growth would be Mandalay if we take a two-polar development strategy. This is because Mandalay and its surrounding area already have a certain level of economic activity and population, although the agglomeration is smaller than that of Yangon.
Yangon Mandalay Ayeyarwaddy Sagaing Bago Mon Tannithayi Shan State (S) Magwe Rakhine Shan State (N) Kayin State Kachin State Khayar Chin
Yangon Region
Mandalay
Region
Tables 1 and 2 compare the population and GDP of the secondary city7
against the primary city for Thailand, Myanmar and Vietnam. The population ratios of the secondary cities against the primary cities for Myanmar and Thailand are very similar, approximately 1:4. On the other hand, the GDP ratios of secondary cities against the primary cities for Myanmar and Vietnam are very similar, about 1:3.5.
From the viewpoint of population at present, Yangon is already considerably larger than the second city in terms of population while not that large from the viewpoint of GDP.
Table 1. Population of secondary city compared with primary city (2005)
(Source) Authors based on IDE-GSM dataset
Table 2. GDP of secondary city compared with primary city (2005)
(Source) Authors based on IDE-GSM dataset
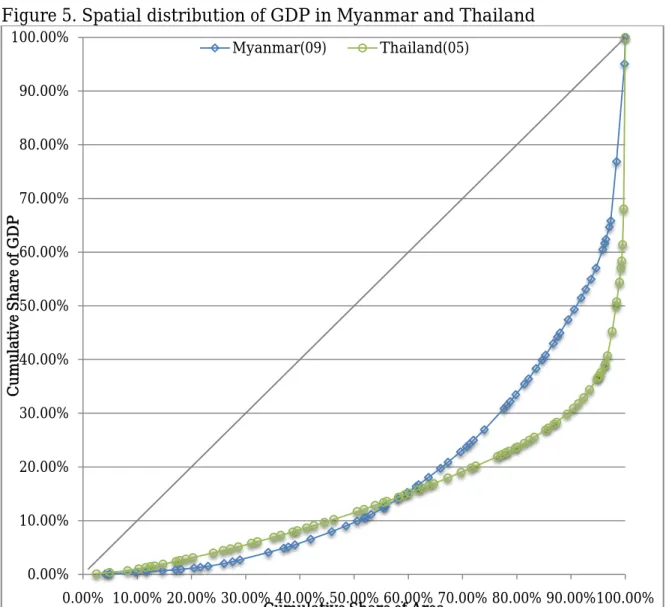
A similar tendency is also observed at the national level. Figure 5 compares the spatial distribution of estimated GDP in Myanmar for year 2009 and that of Thailand for the year 2005. This figure is the so-called “Lorenz curve.” The horizontal axis is the cumulative share of area, and the vertical axis is the cumulative share of GDP. If economic activities are distributed with perfect equality, points line up on a 45-degree angle. The more the distribution of economic activities becomes uneven, the more the curve becomes convex.
Figure 5 shows that economic activities in Myanmar are less concentrated than those in Thailand. In Thailand, more than 60% of the national GDP is concentrated in less than 5% of land area. In Myanmar, the same 60% of national GDP is concentrated in about 15% of land area. There is a tendency for economic development in developing countries to accelerate concentration of economic activities. Thus, economic activities in Myanmar are also likely to be more concentrated in the future.
7 Secondary cities are selected from a comprehensive viewpoint. Cities with the second largest population or GDP in each country are different from the secondary cities selected here.
Figure 5. Spatial distribution of GDP in Myanmar and Thailand
(Source) Authors based on IDE-GSM dataset
Figure 6 compares the spatial distribution of population in Myanmar for the year 2009 and that of Thailand for the year 2005. Spatially, the population in Myanmar is already more concentrated than that in Thailand. This is partly because Myanmar contains mountainous areas where the population density is very low.
Figure 6. Spatial distribution of population in Myanmar and Thailand
0.00%
10.00%
20.00%
30.00%
40.00%
50.00%
60.00%
70.00%
80.00%
90.00%
100.00%
0.00% 10.00% 20.00% 30.00% 40.00% 50.00% 60.00% 70.00% 80.00% 90.00%100.00%
Cumulative Share of GDP
Cumulative Share of Area Myanmar(09) Thailand(05)
(Source) Authors based on IDE-GSM dataset
This uneven distribution of population with the consequent expected concentration of economic activities in the economic center leads to a concern about excessive agglomeration of income and population in the future. Henderson (ibid) warns that an over or under concentration8 of economic activities in a primary city reduces the annual growth rate 0.6%. In the case of Myanmar, it seems necessary to be concerned about over-concentration, rather than under-concentration, of population and economic activities in Yangon.9
3.2 A Simulation Analysis
The analysis of economic geography in Myanmar led us to choose a two-polar rather than a one-polar strategy. Here, we discuss the validity of two-polar strategy with
8 Henderson (ibid) calculated the effects of over or under concentration by a 0.10 point deviation from optimal share of economic activities in the primary city.
9 Industrial policies forcing “balanced-growth” may cause under-concentration, and they can be harmful to economic growth.
0.00%
10.00%
20.00%
30.00%
40.00%
50.00%
60.00%
70.00%
80.00%
90.00%
100.00%
0.00% 10.00% 20.00% 30.00% 40.00% 50.00% 60.00% 70.00% 80.00% 90.00%100.00%
Cumulative Share of Population
Cumulative Share of Area Myanmar(09) Thailand(05)
simulation analysis using an IDE Geographical Simulation Model (IDE-GSM). We analyzed the relationship between the number of development poles, the national GDP of Myanmar, and Yangon and Mandalay’s GDP share in national GDP. For details of the simulation model, see Kumagai et al (2012).
First, we viewed the economic impact of a one-polar strategy. In the one-polar strategy, we assume that the productivity parameter of Yangon would be doubled in 2013 by public investment. Compared with the baseline case with “no public investment,” in the year 2030, the national GDP would increase 1.49 (GDP under no public investment = 1.0), and Yangon’s GDP share would increase to 55.1% of national GDP from 26.3%. On the other hand, Mandalay’s GDP share would decrease to 6.0% from 10.8%. The simulation results show that the one-polar strategy is likely to cause an over-concentration of economic activities in Yangon.
Next, we investigated the effects of increasing the number of development poles with two different assumptions. The first assumption is that the number of development poles can be arbitrarily increased with no cost. It is an extreme assumption but the
“proper exchange rate policy” might be such a public investment. Under this assumption, the one-polar strategy can be compared with the two-polar strategy (the second pole being Mandalay) and a many-polar strategy (additional poles being the 13 regions with industrial zones10). The productivity parameter of each region would be doubled in 2013.
Under this assumption, the more the number of growth poles, the higher the level of national GDP and the lower Yangon’s GDP share. There is no trade-off between higher economic development and lower inequality (Figure 7).
10 Thirteen regions include Taunggyi in Shan State, Kalay in Chin State, Monywa in the Sagaing Region, Pakokku and Ye Nan Chaung in the Magway Region, Meiktila and Myin Chan in the Mandalay Region, Pyay in the Bago Region, Mawlamyine in Mon State, Myaung Mya, Hinthada and Pathein in the Ayeyarwady Region, and Myeik in the Taninthayi Region.
Figure 7. The number of growth poles, national GDP, and GDP share of Yangon and Mandalay (2030: Assumption 1)
(Source) Authors based on IDE-GSM simulation results
An increase in the productivity of an arbitrary number of regions with no additional costs is unrealistic. The second assumption is more realistic. We assume that the costs of increasing the productivity parameter in a region are proportional to its population. The costs of doubling the productivity of a city with a population of five million are assumed to be five times larger than that of a city with a population of one million. We also assume that available public development expenditure is fixed and that if the number of development poles in increased, the expenditure would be shared by all growth pole regions proportional to their population. In addition, the increase in productivity of each region is assumed to be proportional to the development expenditure per capita. For example, suppose there is a budget to double the productivity of the first polar region with a population of five million. If
0.0%
10.0%
20.0%
30.0%
40.0%
50.0%
60.0%
0.00 0.20 0.40 0.60 0.80 1.00 1.20 1.40 1.60 1.80 2.00
GDP Share of Yangon and Mandalay
National GDP(No Public Investment =1.0)
National GDP GDP Share of YGN GDP Share of MDY
this budget is shared with the second polar region that has a population of one million, then the per capita development expenditure in both regions becomes 500 million/600 million = 0.8 compared with that under the one-polar strategy, and the increase in productivity of both regions would be 80%.
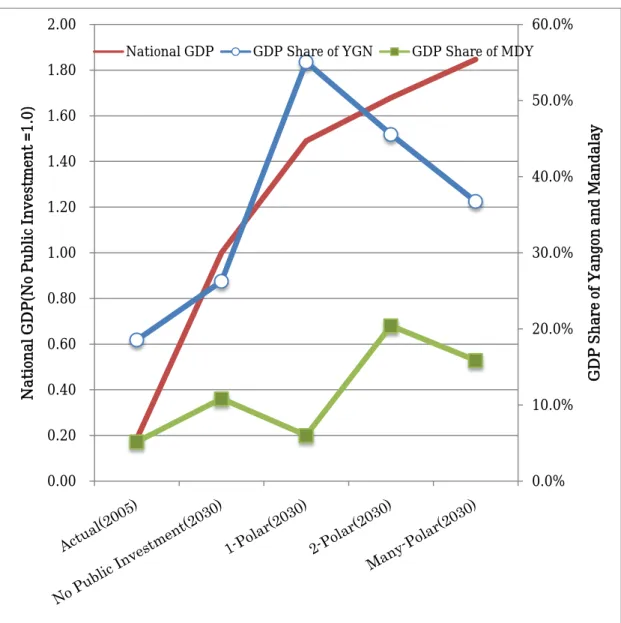
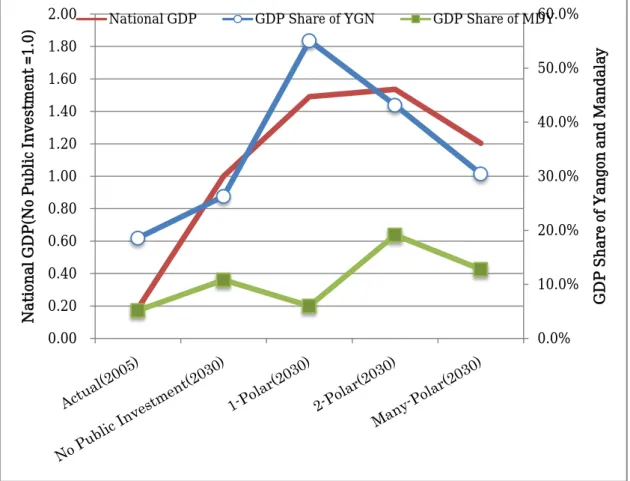
Under this second assumption, the two-polar strategy would decrease Yangon’s GDP share to 43.1% from 55.1%, while the national GDP would slightly increase to 1.54 from 1.49, compared with the one-polar strategy. Mandalay’s GDP share would increase to 19.1% from 10.8%. There seems to be no trade off between higher growth and lower inequality for the two-polar strategy. However, if development resources are spread to 15 regions, the national GDP decreases to 1.20, while the share of Yangon’s GDP decreases to 30.4% (Figure 8).
Figure 8. The number of growth poles, national GDP and GDP share of Yangon and Mandalay (2030: Assumption 2)
(Source) Authors based on IDE-GSM simulation results
Simulation results suggest a development policy of Myanmar. First, the share of Yangon’s GDP under the one-polar strategy seems to be too high, and increasing the number of development poles reduces the share of Yangon’s GDP. Second, assuming development costs with limited budget, spreading the resources to too many growth poles appears to reduce the national GDP significantly compared with the one-polar
0.0%
10.0%
20.0%
30.0%
40.0%
50.0%
60.0%
0.00 0.20 0.40 0.60 0.80 1.00 1.20 1.40 1.60 1.80 2.00
GDP Share of Yangon and Mandalay
National GDP(No Public Investment =1.0) National GDP GDP Share of YGN GDP Share of MDY
strategy. There is a trade-off between higher growth and lower inequality.
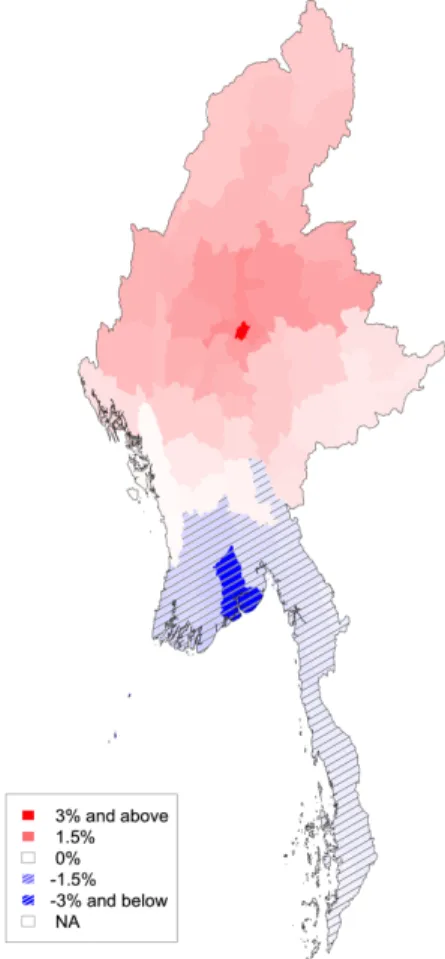
Considering these results, the two-polar strategy seems to be “balanced” between higher growth and lower inequality. Figure 9 compares the GDP per capita of each region with the two-polar strategy and that with the one-polar strategy in 2030 under assumption 2. The two-polar strategy shifts some economic activities from Yangon and other southern regions to Mandalay and northern regions. It depends on many assumptions and it is not certain that the two-polar strategy actually increases the national GDP as in Figure 9. However, it seems to be a reasonable strategy to put aside a part of development expenditure for Yangon and use it for the development of Mandalay, if the picture seen in Figure 9 is desirable.
Figure 9. Differences in GDP per capita (2030: Assumption 2) between the two-polar and one-polar Strategies
(Source) Authors based on IDE-GSM simulation results 3.3 Two-polar growth and poverty reduction
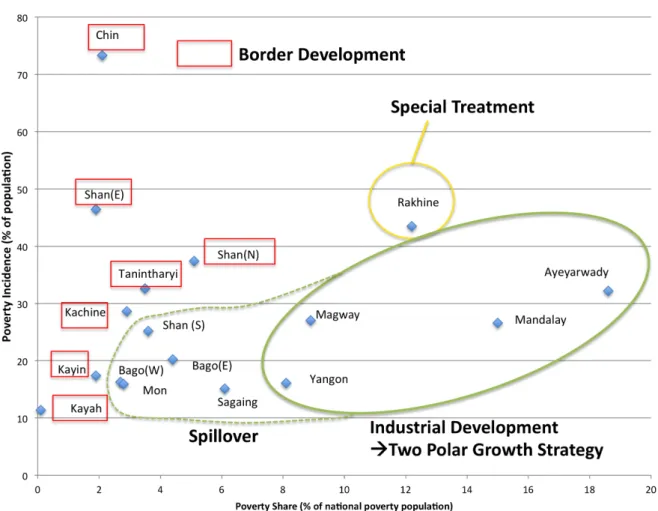
Here, we consider in detail the two-polar strategy with a complementary development policy from the viewpoint of poverty eradication. Figure 10 shows the poverty situation by State/Division. The horizontal axis shows the district share of
poverty in the national population and represents the size of poor people. The vertical axis shows the share of poverty in the total population of each district, thus representing how common poverty is.
The state/division with highest share of poverty is Ayeyarwady (18.6%) followed by Mandalay (15.0%) and Rakhine (12.2%). The state/division with highest incidence of poverty rate is Chin (73.3%) followed by Shan East (46.4%) and Rakhine (43.5%).
Different strategies of poverty eradication must be set for states/divisions where the poverty incidence is not too high but the poverty share is high (locates lower-right), and for the states/divisions the poverty incidence is high while the poverty share is low (locates upper-left). The former case includes Ayeyarwady, Mandalay and Magway, and the latter includes Chin and Shan East. For the former case, industrial development in and around these states to absorb surplus labor force is a possible strategy. For the latter case, re-distribution of income may be a better solution because it is difficult to develop industries in the place where the population is very small or the population density is very low. A specific policy is needed for Rakhine, the state with both high poverty share and high poverty incidence.
Figure 10. Poverty situation and development strategy by district (2010)
(Source) Authors based on UNDP (2011)
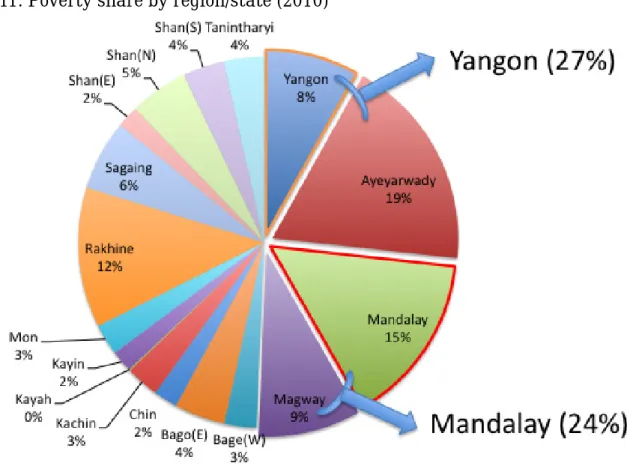
As depicted in Figure 11, Yangon, the economic centre of Myanmar, has a poverty share of 8.1%. Combined with neighboring Ayeyarwady, the poverty share becomes 26.7%. If Yangon takes care of the poverty population in Mandalay and Magway, part of populated and poor Central Dry Zone (CDZ), the share reaches 50.6%, just above half of the national poverty population. This is clearly too much, and a poverty eradication strategy depending on mono-centric economic agglomeration in Yangon has some risk. Considering that Mandalay already has relatively high economic agglomeration, it is more reasonable for Mandalay to take care of its own poverty population as well as the poverty population of neighboring Magway (and Sagaing).
For Myanmar, it seems to be desirable to have a two-polar economic structure like Vietnam.
Figure 11. Poverty share by region/state (2010)
(Source) Authors based on UNDP (2011)
4. Border Development with Enhancement of Connectivity 4.1 Regional inequality
As noted in Section 1, some degree of concentration of economic activity is inevitable and even desirable for developing countries, especially for least developed countries.
However, care should be taken relative to regions that are on the economic periphery.
In the case of Myanmar, mountainous border regions need due attention. It is
difficult to invite or develop certain kinds of industry to less developed regions with small populations.
In the earlier stages of economic development in Myanmar, limited development resources should be concentrated first in Yangon and in some extent in Mandalay.
Even though the two-polar strategy is more “balanced” than the one-polar strategy, and more “efficient” than the many-polar strategy, it unfortunately does not dissolve the gap between economic centers and peripheries. Table 3 shows the spatial gini coefficients for each country by development strategy. The spatial gini coefficient takes a value of 1 if all the activities are concentrated in one region and 0 if n regions have an equal share of economic activities.11 For Myanmar, the spatial gini coefficient increases even under the “no public investment” scenario but increases dramatically under the one-polar strategy. The coefficient under the two-polar strategy shows that the “unevenness” of economic activities is actually somewhat worse when compared with that of the one-polar strategy. This may be interpreted to indicate that the gap between two economic centers such as Yangon and Mandalay as well as the remaining regions widen in the two-polar strategy.
Table 3. Spatial gini coefficients for each country by development strategy
Actual (2005) Simulated (2030)
No public investment 1-Polar 2-Polar many-polar
Myanmar 0.280 0.286 0.303 0.321 0.295
Thailand 0.471 0.491 0.491 0.491 0.491
Vietnam 0.402 0.386 0.386 0.386 0.386
Cambodia 0.399 0.391 0.391 0.391 0.391
Laos 0.266 0.254 0.254 0.254 0.254
Malaysia 0.249 0.237 0.237 0.237 0.237
Indonesia 0.507 0.460 0.460 0.460 0.460
Philippines 0.592 0.606 0.606 0.606 0.606
China 0.412 0.414 0.414 0.414 0.414
Japan 0.095 0.097 0.097 0.097 0.097
Korea 0.068 0.070 0.070 0.070 0.070
Taiwan 0.416 0.408 0.408 0.408 0.408
India 0.349 0.355 0.355 0.355 0.355
Bangladesh 0.150 0.164 0.164 0.164 0.164
East Asia 0.711 0.619 0.619 0.619 0.619
(Source) Authors based on IDE-GSM simulation results
11 Note that it is not proper to compare the spatial gini coefficients for different countries because it is affected by the definition of region. However, in the simulation by IDE-GSM, one tendency is that coefficients increase for all the countries in 2030 compared with 2005, while the coefficient for East Asia as a region decreases during the same period. This means that economic activities are expected to agglomerate intra-nationally but disperse inter-nationally.
Table 4 compares the gap of GDP and GDP per capita between the seven regions and seven states in Myanmar by development strategy. Generally, the inequality between the seven regions and seven states widens even under the “no public investment” scenario and worsens under the one-polar development strategy.
Although the two-polar strategy slightly increases GDP per capita for both seven regions and seven states when compared with that under the one-polar strategy, the inequality of GDP and GDP capita between the seven regions and seven states also worsens slightly.
Table 4. Inequality between seven regions and seven states in Myanmar by development strategy
Seven Regions (vs Seven States=1.0)
GDP per capita (national avg.(2005)=1.0)
GDP GDP per
capita
Seven Regions
Seven
States National
Actual(2005) 3.01 1.12 1.03 0.92 1.00
No Public Investment(2030) 3.42 1.15 3.63 3.15 3.51
1-Polar(2030) 5.73 1.74 5.47 3.14 4.93
2-Polar(2030) 5.92 1.79 5.64 3.15 5.06
Many-Polar(2030) 4.02 1.30 4.35 3.33 4.10
(Source) Authors based on IDE-GSM simulation results
Simulations using IDE-GSM and related numerical analyses revealed that the two-polar strategy is reasonable to avoid the overconcentration of economic activities in Yangon without giving up higher economic growth. At the same time, it alone does not resolve the gap between economic centers and peripheries.
It is important to consider the complementary strategy to develop the economic periphery in Myanmar. However, the strategy to develop the economic periphery should not draw too many development resources from the development of economic centers in order to avoid an “equally poor: situation.
Fortunately, Myanmar is surrounded by more developed economies with high economic growth such as China, Thailand, India, Bangladesh, and Lao PDR (Figure12). Figure 12 shows that some of the eastern border cities of Myanmar have higher levels of income, and this is probably due to closer links with its emerging neighbors like China and Thailand. Conversely, western border cities have thus far failed to develop through links with their neighbors India and Bangladesh. Given experiences of border cities with China and Thailand, there are ways for western border cities to develop via enhanced connectivity with India and Bangladesh.
Border development that connects the neighboring countries can be a complementary strategy to mitigate the widening regional gap by two-polar growth
strategy. How border development can enhance economic growth in the border areas is discussed in the next section.
Figure 12. GDP per capita for Myanmar and its neighbors (2005)
(Source) Authors based on IDE-GSM dataset 4.2 Open-door policy12
Myanmar shares long borders with five neighboring countries including China (a
12 This section draws mainly from Kudo [2009].
border of 1357 miles), Thailand (1314 miles), India (857 miles), Bangladesh (152 miles) and Laos (128 miles). It also shares coastal waters with Malaysia and Singapore. There are differences in natural resource endowments and industrial development stages among them. It should be natural for Myanmar to have stronger economic ties with its neighbors.
In reality, Myanmar’s national borders were closed, for all practical purposes, throughout its socialist period (1962-1988). Myanmar pursued a strict non-aligned foreign policy and operated on an economic strategy of self-reliance and self-sufficiency. However, the military government (SLORC/SPDC) that came into power in 1988 drastically changed policy by introducing open-door actions such as the liberalization of external trade, legalization of cross-border trade with neighboring countries, and acceptance of foreign investment through enactment of the Foreign Investment Law (FIL).
The open-door policy adopted by Myanmar’s military government was welcomed by neighboring countries, China and Thailand in particular. Following the end of the Cold War, China ceased its dual-track foreign policy toward Myanmar in which it endorsed party-to-party relations between the China Communist Party (CCP) and Burma Communist Party (BCP) in addition to state-to-state relations (Tin Maung Maung Than, 2003:194). Thailand abandoned its secret strategy of using the Karen and other ethnic insurgents deployed alongside the border areas as a buffer against the Myanmar army and the BCP. Chatichai Choonhavan, the Thai Prime Minister from 1988 to 1991, coined the famous phrase: “Change Indochina from a battlefield to a commercial field.” The military government in Myanmar then initiated a ceasefire policy with ethnic insurgents, most of whom occupied the border areas, in 1989. Thus, peace was realized in these areas for the first time.
Myanmar joined the Greater Mekong Sub-region (GMS) of economic cooperation in 1992. This was a significant departure from its traditional neutralist foreign policy.
Following this, Myanmar joined the Association of Southeast Asian Nations (ASEAN) and the Bay of Bengal Initiative for Multi-Sectoral Technical and Economic Cooperation (BIMSTEC) in 1997. It joined the Mekong-Ganga Cooperation in 2000 and the Ayeyawady-Chao Phraya-Mekong Economic Cooperation Strategy (ACMECS) in 2003. Myanmar’s open-door policy was well received by East Asian regionalism throughout the 1990s and the first decade of the 21st century. Thus, the opening of the Myanmar border to neighbors has made border trade and border industry possible by enhanced connectivity with its neighbors.
4.3 A simulation analysis of enhancement of connectivity
The first principle of economic development discussed in this paper is that scarce development resources should not be spread to too many regions, especially in the early stages of economic development. When considering the fact that Myanmar is surrounded by richer neighboring nations, enhancing the connectivity with these nations is a key to more balanced development while not diverge much development
resources from economic centers.
Here, economic effects of enhancing connectivity by IDE-GSM are analyzed. In this
“enhanced connectivity” scenario, we combined: (a) the customs facilitation measures at some national borders in 2015 and 2020, (b) upgrading the roads connecting these borders through major cities in Myanmar in 2015 and 2020, and (c) connecting Dawei and Kyaukphyu Ports with India and Europe in 2020.
For (a), we reduce the time and money costs in half at the following national borders:
Tachileik-Mae Sai, Mongla-Daluo, Tamu-Moreh Kanchanaburi-Dawei, Kawthoung-Ranong, Myawaddy-Mae Sot, and Muse-Ruilli.
For (b), we assume the following routes are upgraded: (1) Yangon-Mandalay(2015), (2) Muse-Mandalay-Kyaukphyu (2015, then upgrading the route to Sittwe in 2020), (3) Myawaddy-Paan-Yangon (2015, then upgrading the route to Pathein in 2020), (4) Yangon-Mandalay second link on the western side of Bago Yoma (2020), (5) Mandalay-Monywa-Tamu (2020), (6) Mongla-Kyinetone-Tachileik (2020) and (7) Yangon-Mawlamyine-Dawei-Myeik-Kawthoung. All of these routes can be developed as economic corridors in Myanmar.
For (c), Dawei and Kyaukphyu ports are connected with Kolkata, Chennai, and Rotterdam in 2020, and a “transit trade” through Myanmar is now possible for Thailand and China.
Figure 13 shows the economic effects of enhancing connectivity, given the two-polar strategy is implemented. This figure shows that the enhancement of connectivity considerably increases the GDP in periphery regions without reducing the GDP in economic centers. The inequality measures are all improved when compared with the two-polar strategy without enhancement of connectivity. Table 5 shows the GDP share of Yangon is slightly reduced by enhancement of connectivity, while the national GDP is improved. Table 6 shows that the income gap between seven regions and seven states is narrowed by enhancement of connectivity, while the average incomes of seven regions and seven states improved, compared with the two-polar strategy without enhancing connectivity.
Figure 13. GRDP differences between the two-polar strategy with and without enhancement of connectivity (2030)
(Source) Authors based on IDE-GSM simulation results
Table 5. National GDP and GDP share of Yangon and Mandalay by development strategy (2030: Assumption 2)
GDP Share of YGN GDP Share of
MDY National
GDP
Actual (2005) 0.19 0.05 0.19
No Public Investment
(2030) 0.26 0.11 1.00
1-Polar (2030) 0.55 0.06 1.49
2-Polar (2030) 0.43 0.19 1.54
2-Polar+Connectivity
(2030) 0.42 0.19 1.58
Many-Polar (2030) 0.30 0.13 1.20
(Source) Authors based on IDE-GSM simulation results
Table 6. Inequality between seven regions and seven states in Myanmar by development strategy
Seven Regions (vs Seven States=1.0)
GDP per capita (national avg.(2005)=1.0)
GDP GDP per capita
Seven Regions
Seven
States National
Actual(2005) 3.01 1.12 1.03 0.92 1.00
No Public Investment(2030) 3.42 1.15 3.63 3.15 3.51
1-Polar(2030) 5.73 1.74 5.47 3.14 4.93
2-Polar(2030) 5.92 1.79 5.64 3.15 5.06
2-Polar+connectivity(2030) 5.80 1.76 5.75 3.26 5.17
Many-Polar(2030) 4.02 1.30 4.35 3.33 4.10
(Source) Authors based on IDE-GSM simulation results
Simulation results above show that the enhancement of connectivity complements the two-polar growth strategy nicely and effectively narrows the gap between economic centers and peripheries. Given that financing this strategy does not draw too many development resources from the development of economic centers,
“connectivity” seems to be a key strategy to attain balanced growth for Myanmar.
4.4 Border industry
Another important component of border development is border industry. Border industry here is simply defined as industry located in border areas of two or more countries (Kudo and Kuroiwa, 2009). What factors promote or hinder border industry? There are two factors that influence the competitiveness of border industry: complementary resource endowment and cross-border infrastructure.
The first factor is the existence of complementary resource endowments in border
areas. From an economic point of view, a border is nothing but an impediment to free mobility of productive inputs such as labor, capital, technology, and information. As a result, a border creates differences in factor prices across bordered areas, and complementary inputs become available alongside each other in these areas. Such complementary inputs can be easily transported across the border and combined for production on either side. A border industry can grow by exploiting the differences in the endowment of productive inputs across the bordered areas.
In the Greater Mekong Sub-region (GMS), Thailand and China are relatively advanced economies. Cambodia, Lao PDR and Myanmar (CLM) are still in their rudimentary development stage. On the other hand, Vietnam is apparently entering a more advanced stage of economic development. Border areas between relatively advanced and less developed economies offer their respective complementary location advantages. For example, CLM economies provide a labor force, while Thailand offers major inputs (materials, parts, and components), technology, and capital. In border areas, complementary resources which exist side by side across borders are combined to produce cost-competitive products. Of course, some of these resources must be transported across the border to be utilized for production in border towns. Thus, a certain degree of cross-border mobility of productive inputs is required for the birth and growth of a border industry.
The second factor is cross-border infrastructure. In East Asia, service link costs, costs for connecting remotely located production blocks, have been reduced substantially. This has made it possible for multinational corporations (MNCs) to aggressively exploit wage differences between developed and less developed economies in East Asia and to develop extensive production and distribution networks in the region.
Myanmar has yet to be integrated into such networks in spite of its abundant, reasonably well-educated, and low-waged labor force. Underdeveloped infrastructure, notably in transportation and communication, hinders the country from participating in production and distribution networks. Unless good infrastructure is developed, the savings in labor costs by relocating labor-intensive activities to Myanmar are more than offset by increases in service link costs and other costs (such as fixed costs of setting up new factories, high utility service costs, etc.). Particularly in labor-intensive export sectors, high transport costs could easily wipe out export profitability even if wage levels were to fall substantially. It should be noted that Myanmar’s industrial sector is, and will be for a foreseeable future, highly dependent on labor-intensive industries.
Here, a border industry could offer a solution for overcoming such problems.
Myanmar can participate in the production networks via border areas. The required infrastructure investment to connect its border areas with the existing infrastructure in neighboring countries may be far smaller than that for developing a nationwide infrastructure system. For example, firms in Myanmar-Thai border areas can gain access to the the well-developed Laemg Chabang Port via
well-connected road networks in Thailand.
In border areas, firms would also have better access to utility services such as electricity, water, and telecommunications that are provided by more advanced neighboring countries. Thus, firms located in border areas can enjoy all the benefits of lower service link costs (lower transport and communication costs) and more reliable and cheaper utility services (especially electricity) as well as lower labor costs.
In this way, border industry can grow and complement the two-polar growth strategy.
Border areas in Myanmar are no longer regions that depend on assistance from the center. On the contrary, they are frontiers and conduits that absorb the economic energy of emerging countries such as Thailand and China at present and India and Bangladesh in future, into centers of the Myanmar economy by enhancement of connectivity and growth of border industry.
Concluding remarks
A two-polar growth strategy and border development with enhancement of connectivity prevents over- or under-concentration and makes “high” and “balanced”
growth possible. To make the strategy feasible, spatially targeted investment, including physical and institutional infrastructure, in Yangon, Mandalay and some border areas is required.
Making Yangon and Mandalay growth poles where they can contribute to alleviation of poverty is a challenge. For that, the establishment of special economic zones (SEZs) can be an effective policy tool to promote industrial clusters in targeted areas.
SEZs that include export processing zones (EPZs) and free trade zones (FTZs) have been widely established in East Asia, and export-oriented industries that lead developing economies in the region have been typically located in such zones. SEZs are designed to insulate themselves from the rest of the economy where the business and investment climate is sometimes unfavorable such as in the case of Myanmar.
SEZs are also provided with better infrastructure services such as transportation, telecommunications, and energy.
Another important policy tool is the promotion of FDI. Without substantial inflows of FDI, Myanmar, one of the least developed economies in the region, cannot possibly be integrated into the production and distribution networks in East Asia. Although beyond the scope of this paper, the question of how to invite FDI and how to benefit from it is a major challenge.
References
Asian Development Bank (ADB). [2012] Myanmar in Transition: Opportunities and Challenges, August 2012, available at
(accessed on October 21, 2012).
Brülhart, Marius; and Sbergami, Frederica. [2009] “Agglomeration and Growth:
Cross-country evidence” Journal of Urban Economies, Vol. 65, 48-63.
Fujita,Masahisa; Thiesse, Jacques-Franciois. [2002] Economics of Agglomeration:
Cities, Industrial Location, and Regional Growth, Cambridge University Press.
Ghosh, Tilottama; Powell, Rebecca L.; Elvidge, Christopher D.; Baugh, Kimberly E.;
Sutton, Paul C.; Sharolyn Anderson [2010] “Shedding Light on the Global Distribution of Economic Activity” Open Geography Journal, vol. 3, pp.148-161.
Henderson, Vernon. [2003] “The urbanization process and economic growth: The so-what question” Journal of Economic Growth, Vol. 8 No.1, 47-71.
Kudo, Toshihiro [2012] “Explanatory Note on Data Sources 4: Myanmar,” in Ikuo Kuroiwa, ed., Economic Integration and the Location of Industries: The Case of Less Developed East Asian Countries, UK: Palgrave Macmillan.
Kudo, Toshihiro [2009] “Border Area Development in the GMS: Turning the Periphery into the Centre of Growth,” ERIA Discussion Paper Series, Jakarta.
Kudo, Toshihiro; Kuroiwa, Ikuo. [2009] “Border Industry in Myanmar: Plugging into Production Networks through Border Industry” in Kuroiwa ed., Plugging into Production Networks: Industrialization Strategy in Less Developed Southeast Asian Countries, Singapore: Institute of Southeast Asian Studies.
Kumagai, Satoru; Hayakawa; Kazunobu, Isono, Ikumo; Keola, Souknilanh; Kenmei Tsubota [2012] “Geographical Simulation Analysis for Logistics Enhancement in Asia” IDE Discussion Paper No. 369
Kumagai, Satoru; Souknilanh, Keola; and Kudo, Toshihiro. [2012] “Myanmar Economy Viewed at Night” Policy Review on Myanmar Economy No.4, IDE-JETRO.
New Light of Myanmar (NLM), English newspaper in Myanmar.
Tin Maung Maung Than [2003] “Myanmar and China: A Special Relationship?” in Southeast Asian Affairs 2003, Singapore: Institute of Southeast Asian Studies.
UNDP [2011] Integrated Household Living Conditions Survey in Myanmar (2009-2010): Poverty Profile: Yangon, UNDP.
Williamson, Jeffrey G [1965] “Regional Inequality and the Process of National Development: A Description of the Patterns” Economic Development and
Cultural Change, Vol. 13, No.4, pp. 1-84.
World Bank. [2009] Reshaping Economic Geography, World Development Report:
Washington D.C., World Bank.