AIR POLLUTION AND CHILD HEALTH OUTCOMES IN INDONESIA
2019, September
Made Ayu Hitapretiwi Suryadhi
Graduate School of
Environmental and Life Science (Doctor`s Course)
OKAYAMA UNIVERSITY
CONTENTS
Acknowledgement Summary
List of Figure List of Tables
Chapter 1. Introduction
1.1. General Introduction ……… 1
1.2. Study Objectives ……… 2
1.3. Outline ………. 2
Chapter 2. Acute Respiratory Infection and Nitrogen Dioxide Exposure in Children aged 0 to 3 years in Indonesia 2.1. Introduction ………. 4
2.2. Methods ………. 5
3.2.1 Study Design and Subjects ………. 5
3.2.2 Exposure Indicators ………. 6
3.2.3 Outcomes ……… 7
3.2.4 Statistical Analysis ……… 7
2.3. Results ………. 8
2.4. Discussion ……… 9
2.5. Conclusion ………. 12
Chapter 3. The Combined Effect of Household Air Pollution and Environmental Tobacco Smoke and Child Health Outcomes in Children in Indonesia
3.1. Introduction ……… 13
3.2. Methods ……… 14
3.2.1. Study Population ……… 14
3.2.2. Indoor Air Pollution Exposure ……… 14
3.2.2.1. HAP: Indoor Air Pollution from Solid-fuel Use ………. 14
3.2.2.2. ETS: Indoor Air Pollution from Smoking ………. 15
3.2.3. Health Outcomes ……… 15
3.2.4. Statistical Analysis ……… 15
3.3. Results ……… 17
3.4. Discussion ……… 18
3.5. Conclusion ……… 22
Chapter 4. General Conclusion ……… 23 FIGURE
TABLES REFERENCES
ACKNOWLEDGEMENTS
Om Swastyastu,
Matur Suksma kaatur ring Ida Sang Hyang Widhi Waca,
First and foremost, I would like to express my deepest appreciation and gratitude to my supervisor Professor Takashi Yorifuji for his guidance, patience, academic knowledge, and support throughout my study. I would also like to show my deepest gratitude to my co- supervisors, Professor Toshihide Tsuda and Professor Wataru Sakamoto for the great support.
My heartfelt gratitude to Professor Jun Hamada for his kind help. I would like to thank all for the chance to study in the Department of Human Ecology, Graduate School of Environmental and Life Science.
I am truly grateful to the Indonesia Endowment Fund for Education and the Ministry of Research, Technology and Higher Education for the award of a Scholarship to study in Okayama University. My greatest thanks to Sasai Megumi and Saori Irie for their valuable support. And my special thanks to my fellow colleague Kawuli Abudureyimu for his patience and support throughout my study.
Last but very importantly, I would like to thank my father, Prof. dr. Nyoman T.
Suryadhi, mother, Ni Made Ariani, husband, I Made Winarsa Ruma, sister, Putu Ayu Rhamani Suryadhi along with my entire family for their endless support. My sincere appreciation for my lovely son, Putu Saga Samskara Suryadhi for his patience and uplifting spirit throughout my study.
Om Santih, Santih, Santih Om
SUMMARY
We assessed the association between air pollution exposure and child health outcomes in Indonesia. In our first study, we assessed the association between nitrogen dioxide (NO2) and sulfur dioxide (SO2) exposure and child health outcomes in Indonesia. We included 4931 children in urban areas aged 0 to 3 years from the Indonesia demographic health survey (IDHS) births dataset. We assigned participants provincial levels of NO2 and SO2 and examined associations with low birth weight, infant death, neonatal death, and acute respiratory infection (ARI). We estimated odds ratios (OR) and 95% confidence intervals (CI) using a generalized estimating equations (GEE) logistic regression model. NO2 exposure was associated with an increased risk of ARI. An interquartile range increase in mean NO2
exposure associated with an increased risk of ARI by 18% (OR 1.18, 95% CI: 1.08–1.28), and was supported by quartile exposure category. SO2 was not associated with the examined child health outcomes. NO2 exposure associated with an increased risk of respiratory infections in early childhood in Indonesia. In our second study, we assessed the combined effect of household air pollution (HAP) from solid fuel use and from environmental tobacco smoke (ETS) and child health outcomes in Indonesia. We acquired information from survey subjects reported solid fuel use, frequency of indoor smoking, and health outcomes in children. We then evaluated the effect of a combined exposure using multivariate logistic regression. Children exposed to high levels of pollution from solid fuel use were associated with an increased risk of low birth weight, neonatal death, infant death, and acute lower respiratory infection. Exposure to environmental tobacco smoke was associated with an
increased risk of acute lower respiratory infection. The combined effect of both pollution sources outweighed the independent risk of each exposure alone. Solid fuel use and environmental tobacco smoke independently associated with an increased risk of child health outcomes and the combined exposure showed the additive effect. The findings from our study suggest that exposure to indoor and outdoor air pollution associated with child-health outcomes since early childhood.
LIST OF FIGURES
Figure 1. Selection of study subjects ………. 24
LIST OF TABLES
Table 1. Sociodemographic characteristics of participants residing in urban areas in Indonesia’s 33 provinces (n=4931) ……… 25 Table 2. Nitrogen dioxide and sulfur dioxide concentrations in 2009–2011 in
Indonesia (µg/m3) ……… 26
Table 3. Adjusted odds ratios for nitrogen dioxide and health outcomes in urban
areas in Indonesia ……… 27
Table 4. Adjusted odds ratios for sulfur dioxide and health outcomes in urban
areas in Indonesia ……… 28
Table 5. Demographic characteristics of children included in the study (N=36,842) ……… 31 Table 6. Odds ratios (ORs) of household air pollution from solid-fuel use and
child health outcomes in Indonesia (N = 36,726) ………. 32 Table 7. Odds ratios (ORs) of environmental tobacco smoke exposure and child
health outcomes in Indonesia (N = 36,805) ………. 33 Table 8. Adjusted odds ratios (ORs) for the combined effect of household air
pollution from solid-fuel use (HAP) and environmental tobacco smoke
(ETS) and child health outcomes in Indonesia (N =
36,709) ………. 34
LIST OF SUPPLEMENTARY TABLES
Supplementary Table 1. Adjusted odds ratios for nitrogen dioxide and health
outcomes in urban areas in
Indonesia ……… 29 Supplementary Table 2. Adjusted odds ratios for sulfur dioxide and health
outcomes in urban areas in
Indonesia ……… 30 Supplementary Table 3. Adjusted odds ratios (ORs) for the combined effect of
exposure to household air pollution from solid-fuel use (HAP) and environmental tobacco smoke (ETS) and child health outcomes in Indonesia (N =
36,709) ………. 35
Supplementary Table 4. Adjusted odds ratios (ORs) for the combined effect of exposure to household air pollution from solid-fuel use (HAP) and environmental tobacco smoke (ETS) and child health outcomes in Indonesia (N = 31,885) after restricting the subjects to only those that cooked inside the house ………. 36
1
Chapter 1 Introduction
1.1. General Introduction
Air pollution poses a significant effect on health especially during early life, in people with compromised immune system, and in the elderly. Air pollution, particularly particulate matter (PM2.5) was estimated responsible for about 3.5 million deaths in 1990 and estimated to increase to 4.2 million deaths in 2015 (Landrigan et al., 2017). Whereas, deaths attributable to respiratory infections occurring in children less than 5 years old was estimated to reach around 570,000 deaths (e.g. pneumonia) (WHO, 2017).
Sources of air pollution include natural (e.g. volcano eruption, forest fire, dust storms, etc.) and anthropogenic sources (e.g. industrial sources, open dumps, automobiles, home furnaces, home fire places and stoves, backyard barbeque grills, and open burning of refuse and leaves) (Vallero, 2008). Types of pollutants include particulate matter (PM), black carbon, ground-level ozone, NO2, SO2, and carbon monoxide (CO).
Several possible effects of air pollution in children include mortality outcomes, adverse pregnancy outcomes, increased risk of birth defects, adverse respiratory health outcomes, school absenteeism, altered immunity, increased risk of vitamin D-deficiency rickets ((Buka et al., 2006). Child mortality from the joint effects of household and ambient air pollution occurred mostly in low- and middle-income countries compared to high-income countries (World Health Organization, 2018).
2 1.2. Study Objectives
In general, we aim at assessing associations between exposure to air pollution and health outcomes in children, specifically:
1. To evaluate the association between air pollution (NO2 and SO2) and health outcomes in children aged 0–3 years in Indonesia.
2. To evaluate the effect of combined exposure to HAP from solid fuel use and ETS on birth and child health outcomes in Indonesia.
1.3. Outline
In Chapter 1, we presented the general introduction on air pollution and child health outcomes. In this thesis, the exposure assessed included NO2, SO2, HAP, and ETS. We assessed the association between the exposure and health-related outcomes since early childhood in Indonesia.
In Chapter 2, we presented our findings on the associations between air pollution (NO2
and SO2) and health in children aged 0–3 years in Indonesia. We included 4931 Indonesian children born between 2009 and 2011. We assigned participants provincial levels of NO2 and SO2 and examined associations with low birth weight, infant death, neonatal death, and ARI.
We estimated OR and 95% CI using a GEE logistic regression model. NO2 exposure was associated with an increased risk of ARI. An interquartile range increase in mean NO2 exposure associated with an increase in the risk of ARI by 18% (OR 1.18, 95% CI: 1.08–1.28), and was supported by quartile exposure category. SO2 was not associated with the examined child health
3
outcomes. NO2 exposure associated with an increased risk of respiratory infections in early childhood in Indonesia especially in those living in the urban.
In Chapter 3, we presented our findings on the combined effect of household air pollution from solid-fuel use and from environmental tobacco smoke on child health outcomes in Indonesia. Survey subjects reported solid-fuel use, frequency of indoor smoking, and health outcomes in children. We then evaluated the effect of a combined exposure using multivariate logistic regression. Children exposed to high levels of pollution from solid-fuel use was associated with an increased risk of low birth weight, neonatal death, infant death, and acute lower respiratory infection. Exposure to environmental tobacco smoke associated with an increase in the risk of acute lower respiratory infection. The combined effect of both pollution sources increased the risk of adverse child health outcomes. Solid-fuel use and environmental tobacco smoke independently associated with an increased risk of child health outcomes, but combined exposure outweighed the independent risk of each exposure alone.
Finally, in Chapter 4, we presented the general conclusion of this thesis. The findings from our study showed that exposure to indoor and outdoor air pollution associated with child- health outcomes since early childhood.
4
Chapter 2 Acute Respiratory Infection and Nitrogen Dioxide Exposure in Children aged 0 to 3 years in Indonesia
2.1 Introduction
Air pollution is known to influence health, and can lead to serious ill effects and even death. Organs and systems affected by air pollution include the respiratory, cardiovascular, nervous, urinary, and digestive systems (Kampa and Castanas, 2008). The lungs and respiratory tract of young children are particularly vulnerable to toxicants such as air pollutants, even at levels that are not harmful for adults (WHO, 2005). This places them at increased risk for developing health problems caused by exposure to air pollution, especially because their immune system is still developing. Asthma, reduced lung function, and respiratory infection have been closely associated with air pollution exposure in children (Bowatte et al., 2015, Darrow et al., 2014, Gehring et al., 2013, Nishimura et al., 2013). Exposure to air pollution during pregnancy also affects the developing fetus. Previous studies suggested air pollution exposure during pregnancy may lead to low birth weight (LBW) and premature death;
outcomes that have been linked to particulate matter (PM), nitrogen dioxide (NO2), and sulfur dioxide (SO2) (Dadvand et al., 2013, Lelieveld et al., 2015, Pedersen et al., 2013, Yorifuji et al., 2015).
Indonesia is one of the world’s most populous countries, with the total population in 2015 exceeding 250 million people. The population is projected to reach more than 300 million by 2035 (Badan Pusat Statistik, 2017). Air pollution is a serious problem in Indonesia, particularly as the number of motor vehicles has increased over recent years. However,
5
epidemiological studies examining the health effects of air pollution in children remain limited.
One study (Duki et al., 2003) demonstrated positive associations between NO2 and prevalence of respiratory outcomes among children at 46 Indonesian schools. However, the analytic design was ecological and that study did not consider confounding factors such as socioeconomic conditions or smoking (Duki et al., 2003). Another study (Kashima et al., 2010) used individual-level birth datasets from the 2002–2003 Indonesian Demographic Health Survey (IDHS), and evaluated associations between proximity to major roads and health outcomes by considering indoor air pollution in Indonesia. They found that proximity to major roads increased the prevalence of acute respiratory infection (ARI) among children; however, that study did not use air pollutant concentrations as exposure indicators (Kashima et al., 2010).
2.2 Methods
2.2.1. Study Design and Subjects
The present study aimed to evaluate the association between air pollution (NO2 and SO2) and health outcomes in children aged 0–3 years in Indonesia, using the IDHS individual- level dataset (Badan Pusat Statistik, 2013). The IDHS program is mainly funded by the US Agency for International Development and other donors that established assistance for surveys in over 90 countries to broaden global knowledge on health and population trends in developing countries. The 2012 IDHS provides detailed history of births for all women that were interviewed in the 2012 survey. The survey was conducted from May 7 to July 31, 2012 in all 33 Indonesian provinces. The IDHS birth dataset comprised 83,650 children from 43,852
6
interviewed households. Air pollution data were available for 2009–2011; therefore, we excluded children who were not born during that period, leaving 10,950 children. In addition, as air pollution was mainly measured in capital cities, we focused on the 5008 children (45.7%) living in urban areas. Finally, we only included children with singleton birth, which gave a total of 4931 children for the analysis (Figure 1).
2.2.2. Exposure Indicators
We focused on NO2 and SO2 as the main air pollutants because of data availability. Air pollution data were obtained from the Indonesia Environmental Quality Index (Indeks Kualitas Lingkungan Hidup) Report published by The Ministry of Environment of the Republic of Indonesia for the years 2009, 2010, and 2011. NO2 and SO2 concentrations were measured four times each year by a passive sampler in 243 capital regencies/cities across the 33 provinces described in the 2011 Indonesia Environmental Quality Index report, whereas the 2009 and 2010 reports lacked such detail. The measurements took place in residential, industrial, and heavy traffic areas. The report did not include information on the time and period of measurement in each location but provided minimum and maximum levels of NO2 and SO2 for the four measurements each year. We used the average of the minimum and maximum concentrations as the mean concentrations for each year. After obtaining mean and maximum concentrations, we averaged the concentrations at the province-level and assigned yearly average levels for NO2 and SO2 from 2009–2011 to participants who lived in the corresponding province. We used the 3-year average of mean and maximum NO2 and SO2 as the main exposure indicators in the analysis.
7 2.2.3. Outcomes
The main health outcomes were LBW, neonatal death, infant death, and ARI, identified from the 2012 IDHS questionnaires. LBW was defined as weight at birth below 2500 grams. Age at death was used to define neonatal and infant deaths. We defined children whose age at death was 0–28 days as neonatal deaths and those whose age at death was 0–11 months as infant deaths. ARI was evaluated by asking whether the child had suffered from a cough in the last 2 weeks and whether the child had been ill with a cough in the last 24 hours.
2.2.4. Statistical Analysis
After conducting descriptive analyses, we used logistic regression analysis to assess associations between air pollution exposure (NO2 and SO2) and child health outcomes (LBW, neonatal deaths, infant deaths, and ARI). We used GEE analysis to investigate correlations within mothers. We entered exposure information (i.e., mean and maximum for NO2 and SO2) in two ways in the models (continuous and quartile category). We estimated odds ratios (OR) and 95% confidence intervals (CI) for each interquartile range (IQR) increase in air pollutants for continuous exposure information, and used the lowest category as a reference for quartile exposure category.
We adjusted for several potential confounders, including: mother’s age (continuous), children’s age (continuous), children’s sex (dichotomous), mother’s smoking status (dichotomous: smoking/nonsmoking), mother’s education (categorical), and area-level socioeconomic status (continuous). We followed the original categorization for mother’s education (no education, primary school, secondary school, and higher education). As an area-
8
level socioeconomic status indicator, we used Gross Domestic Regional Bruto (GDRB) per capita (i.e., Gross Domestic Product per capita) in million Rupiahs in each province in 2012.
The data was obtained from Central Bureau of Statistics (BPS) in Indonesia (Badan Pusat Statistik, 2018).
In the sensitivity analysis, instead of adjusting for mother’s education, we adjusted for wealth index to examine potential confounding by another variable related to socioeconomic status. We used the original wealth index categories: poorest, poorer, middle income, richer, and richest. The magnitude of wealth was defined by assessing participants’ household assets as recorded in the IDHS.
We used Stata 13.1 (StataCorp, Texas, USA) for the data analysis. Specific ethical approval was not required for this study as we received anonymized IDHS data, and that survey had received ethical approval from the relevant ethical boards. In addition, informed consent was obtained from participants at the beginning of each survey.
2.3. Results
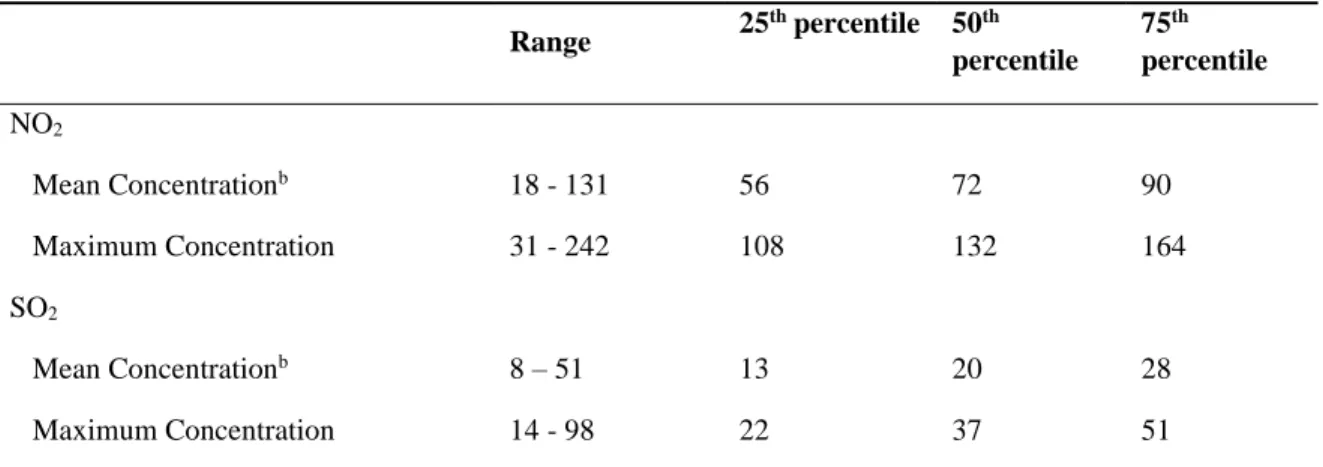
Participants’ demographic characteristics are shown in Table 1. The most common age group for mothers was 25–29 years. Mean of the GDRB per capita among the 33 provinces was 37.46 million Rupiahs. The medians for the exposure indicators were 72 µg/m3 for mean NO2, 132 µg/m3 for maximum NO2, 20 µg/m3 for mean SO2, and 37 µg/m3 for maximum SO2 (Table 2).
9
The results for NO2 exposure from the GEE logistic regression analysis are presented in Table 3. NO2 exposure was associated with an increased risk of ARI. An IQR increase in mean NO2 exposure associated with an increased risk of ARI by 18% (OR 1.18, 95% CI: 1.08–
1.28) (Table 3). The associations for ARI was confirmed by assessing the quartile exposure categories. The ORs in the 3rd and 4th quartile exposure categories were elevated compared with those in the lowest category. In contrast, SO2 was not associated with the risk of any of the studied child health outcomes (Table 4).
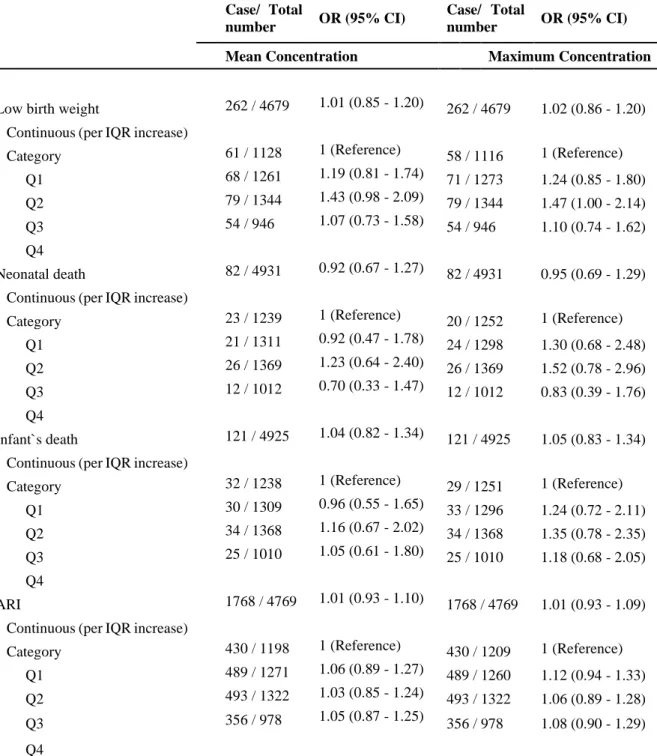
Even after adjusting for wealth index rather than mother’s education, the results for NO2
did not change substantially (Online Table 1). Although some ORs for ARI elevated for SO2
after adjustment, the results were equivocal (Online Table 2).
2.4. Discussion
In the present study, we examined the association between air pollution exposure (NO2 and SO2) and health outcomes in children aged 0–3 years in Indonesia, using the IDHS births dataset. We found that exposure to NO2 was associated with an increased risk of ARI.
This is the first study in Indonesia that incorporated air pollution data from all 33 provinces to evaluate individual-level health-related outcomes. Consistent with previous studies conducted in Indonesia (Duki et al., 2003, Kashima et al., 2010), we found that air pollution exposure increased the risk for negative respiratory outcomes among children. Unlike
10
the two previous studies, we adjusted for important potential confounders such as smoking and area-level socioeconomic indicator and incorporated measured air pollution data.
The findings of the adverse effects of early childhood exposure to NO2 on ARI are consistent with previous international studies (Brauer et al., 2007, Brauer et al., 2002, Clark et al., 2010, Darrow et al., 2014, Gehring et al., 2002, Gehring et al., 2013, Gehring et al., 2010, MacIntyre et al., 2014). For example, a European study assessing the association between traffic-related air pollution and respiratory infections among 16,059 children from 10 birth cohorts suggested that exposure to air pollution in early life was associated with otitis media and pneumonia (MacIntyre et al., 2014). A study that examined the acute effect of exposure to NO2 based on daily emergency department visits among children aged 0–4 years old in the US state of Georgia demonstrated positive associations with upper respiratory infection and pneumonia (Darrow et al., 2014). Although some studies did not find positive associations between NO2 exposure and respiratory infections (Gehring et al., 2002, Morgenstern et al., 2007), different exposure settings or definition of diseases may make comparisons difficult.
Although a major body of evidence suggests that exposure to air pollution during pregnancy is correlated with an increased risk for LBW (Ballester et al., 2010, Bell et al., 2007, Brauer et al., 2008, Pedersen et al., 2013), results from this study suggest otherwise. This may be explained by the limited information on levels of air pollution exposure during pregnancy in our study. For example, exposure measurements in 2008 may be relevant for newborns in 2009, but we were unable to get the 2008 data for air pollutants; therefore, the findings may be influenced by exposure misclassification. Another misclassification would also be caused by
11
limited number of measurements in a year (i.e., four times each year). A more rigorous approach in exposure assessment is needed to address this association in the future.
We did not find positive associations between air pollution exposure and neonatal/infant mortality. This is inconsistent with findings from other studies that reported positive associations between exposure to air pollution and mortality during early childhood (Arceo- Gomez, 2016, Woodruff et al., 2008). Again, more detailed exposure assessment may be needed to better understand the effects of air pollution on early childhood mortality.
Our findings suggest that NO2 plays a major role in the occurrence of respiratory infections in children, whereas SO2 does not. However, findings for SO2 might have been more impacted by exposure misclassification, and this result may be explained by the measurement of air pollution mainly covering densely populated areas with high traffic. Other air pollution exposure indicators (e.g., PM) may be useful for future studies to better understand the role of air pollution exposure on health outcomes in Indonesia.
This study had several limitations. First, exposure information was available only four times per year in each capital regency/city, and we assumed the averages of the minimum and maximum of these four measurements represented mean concentrations. The effect estimates (i.e., ORs) obtained from the analyses using mean concentrations were close to those from maximum concentrations (Tables 3 and 4), indicating the assumption about mean concentrations is acceptable. Our analysis may appear more like an examination of a rank of concentrations of pollutants among provinces rather than an examination of exact concentrations of pollutants. Second, air pollution information was available at the area-level
12
not the individual-level; however, this was measured in cities (urban areas) of every region in each province, meaning that misclassification would be minimized. Furthermore, any misclassification would be nondifferential, which produces an effect that has a tendency to approach the null (Rothman, 2012). Third, because child health outcomes were self-reported, there might be disease misclassification. However, this type of misclassification would also be nondifferential with respect to outcomes (Rothman, 2012) and produce an effect with a tendency to approach the null. Fourth, there is possibility of residual confounding. We had no information on children’s and parental history of problems such as allergies and asthma. Finally, our study can only be generalized to urban populations because of the limited information on air pollution levels in rural areas.
2.5. Conclusion
In conclusion, we demonstrated exposure to NO2 was associated with an increased risk of ARI in early childhood in Indonesia. Because the measured NO2 levels took place in residential, industrial, and heavy traffic areas, the findings could be attributed to traffic- related air pollution. This would support evidence from previous studies suggesting that exposure to traffic-related air pollution has detrimental effects on the respiratory tract in children. Considering the increasing number of motor vehicles in Indonesia, measures should be taken to reduce exposure to traffic-related air pollution, especially among children and those with compromised health (eg, older adults).
13
Chapter 3 The Combined Effect of Household Air Pollution and Environmental Tobacco Smoke and Child Health Outcomes in Children in Indonesia
3.1. Introduction
Indoor air pollution is defined as chemical, biological, and physical contamination of indoor air and generally refers to HAP derived from the use of solid fuels for cooking (Landrigan and Etzel, 2014). The World Health Organization has estimated that HAP contributed to 4.3 million deaths in 2012 (World Health Organization, 2014). Another notable form of indoor air pollution is caused by second-hand smoke, known as passive smoking or ETS. It is estimated that around 0.9 million deaths occurred in 2016 because of ETS, and 56,340 of these casualties were children under the age of 10 years (GBD 2016 Risk Factors, 2017).
Previous studies have shown that exposure to HAP and ETS is independently associated with adverse child health outcomes such as stillbirth, LBW, neonatal and infant death, and acute respiratory infections (Amegah et al., 2014, Dherani et al., 2008, Epstein et al., 2013, Jackson et al., 2013, Leonardi-Bee et al., 2011, Po et al., 2011, Pope et al., 2010, Rinne et al., 2007, Salmasi et al., 2010, Smith et al., 2000, Tielsch et al., 2009, Ward et al., 2007, Zhang and Smith, 2007). Although young children and pregnant women can be exposed to both sources simultaneously, few studies have examined the impact of joint exposure to HAP and ETS (Akinyemi et al., 2016).
14 3.2. Methods
3.2.1. Study Population
We identified study subjects from the birth records of the 2012 IDHS, which includes demographic information, indoor air pollution data, and records of health outcomes. The survey was a cross-sectional study that collected data between May 7 and July 31, 2012 in all 33 provinces in Indonesia. The survey targeted women aged 15–49 years who provided information on all births or stillbirths through 2012 (n = 45,607). In the present study, we focused on singleton births (including stillbirths) between 2002 and 2012 with de-jure residence. We selected 2002 as the lower cut-off to ensure a large sample (36,842 children) for the analyses.
3.2.2. Indoor Air Pollution Exposure
3.2.2.1. HAP: Indoor Air Pollution from Solid-fuel Use
The IDHS queried subjects on HAP with the question “What type of fuel does your household mainly use for cooking?” We then assumed that children were highly exposed when solid fuel (coal, lignite, charcoal, wool, or straw/shrubs/grass) was used for cooking.
Conversely, we assumed that children had low levels of exposure to indoor air pollution when clean fuel (electricity, propane/natural gas, biogas, or kerosene) was used for cooking. We excluded the records of 92 (0.3%) children whose mothers replied “no food cooked in the house”
or “other”, as well as 24 (0.07%) children whose records lacked information on cooking.
15 3.2.2.2. ETS: Indoor Air Pollution from Smoking
The IDHS queried subjects on ETS with the question “How often does anyone smoke inside your house? Would you say daily, weekly, monthly, less than monthly, or never?” We assumed that children were highly exposed to indoor smoking when the smoking frequency inside the house was daily, and that children had low levels of exposure to indoor smoking when the smoking frequency was lower.
3.2.3. Health outcomes
The IDHS also included information on the children’s health outcomes. We identified health outcomes in the present study from questions related to stillbirth, LBW, neonatal death, infant death, acute upper respiratory infection, and acute lower respiratory infection. LBW was defined as weight at birth below 2500 grams. We defined children whose age at death was 0–
28 days as neonatal deaths and those whose age at death was 0–11 months as infant deaths.
AURI was evaluated by asking whether the child had suffered from a cough in the last 2 weeks and whether the cough was accompanied with short, rapid and difficulty breathing for ALRI.
3.2.4. Statistical Analysis
We used logistic regression to evaluate the association between the two types of indoor air pollution and health outcomes and we put both exposures in a separate model. We estimated ORs with 95% CIs using the low-exposure category as a reference. We used GEE analysis to account for correlations between respondents. We first estimated crude ORs and then adjusted
16
for potential confounding factors such as child’s age (continuous), child’s sex (dichotomous), mother’s age (continuous), mother’s education level (categorical), and residential area (urban or rural, dichotomous). This information was derived from the IDHS. Maternal education was categorized as no education, primary education, secondary education, and higher education.
In the subsequent analysis to evaluate the impact of joint exposure to indoor air pollution from solid fuel use and smoking, we combined the exposures into four exposure categories: Low exposure to HAP and ETS; high exposure to HAP and low exposure to ETS;
low exposure to HAP and high exposure to ETS; high exposure to HAP and ETS. We then examined the effect of combined exposure on health outcomes using the same generalized estimating equation approach and adjusting for the same potential confounders.
We then performed two sensitivity analyses. First, we adjusted for the household wealth index instead of maternal education as an indicator of socioeconomic status. The wealth index was available from the 2012 IDHS, and was generated using principal
component analysis based on the household’s assets (e.g., televisions and bicycles), type of housing construction, and access to water and sanitation facilities. Second, we further restricted the subjects to those households that cooked inside the house to reduce exposure misclassification. We used the question “Is the cooking usually done in the house, separate building, or outdoors” from the 2012 Demographic Health Survey questionnaire to select subjects.
17
We used Stata 13.1 (StataCorp LLC, College Station, Texas, USA) for the analysis. The IDHS received ethical approval from the relevant ethics boards. We did not obtain additional ethical approval as we received anonymized IDHS data.
3.3. Results
The mean age of the children was 4.8 years (Table 5). Approximately 40% were exposed to high levels of indoor air pollution from solid-fuel use, and around 70% were exposed to high levels of indoor air pollution from smoking.
HAP from solid-fuel use was associated with an increased risk of several health outcomes even after adjusting for confounders and for ETS (Table 6). Children exposed to high levels of HAP from solid-fuel use had an increased risk of LBW, neonatal death, infant death, and acute lower respiratory infection, compared with children exposed to low levels of HAP from solid-fuel use.
Table 7 lists the results from multivariate analysis for ETS and health outcomes.
Although some effect estimates were elevated, ETS was only associated with increased risk of acute lower respiratory infection.
When we combined both exposures, 20.1% of children were exposed to neither HAP from solid-fuel use nor ETS, 9.8% were exposed to high pollution levels from solid-fuel use, 38.3% were exposed to high pollution levels from ETS, and 31.8% were exposed to pollution from both solid-fuel use and ETS (Table 8). While exposure to HAP from solid-fuel use or to
18
ETS independently increased the risk of several health outcomes, the combined exposure yielded higher ORs in some outcomes. For example, the ORs for acute lower respiratory infection were 1.21 (95% CI: 0.98–1.50) for HAP from solid-fuel use and 1.12 (95% CI: 0.97–
1.29) for exposure to ETS, but 1.36 (95% CI: 1.16–1.61) for exposure to both.
After adjusting for the wealth index instead of maternal education in the sensitivity analysis, the values did not change substantially (Supplementary Table 3). Also, no
significant changes to the values were found after restricting the subjects to those households that cooked inside the house (Supplemental Table 4).
3.4. Discussion
In the present study, we evaluated the effect of combined exposure to indoor air pollution from solid-fuel use and ETS on birth and child health outcomes in Indonesia. We observed an increased risk of LBW, neonatal death, infant death, and acute lower respiratory infection. Moreover, a combined exposure to HAP from solid-fuel use and ETS was more detrimental than exposure to each pollution source alone.
The observed adverse effects of HAP from solid-fuel use on LBW, neonatal mortality, infant mortality, and acute lower respiratory infection are consistent with those of previous studies (Ezeh et al., 2014, Khan et al., 2017). Khan and colleagues showed that HAP significantly increased the risk of LBW and acute respiratory infection in children in Bangladesh (Khan et al., 2017). The association between exposure to solid-fuel pollution and infant mortality is well-established, and Neogi and colleagues found an adverse effect on
19
neonatal mortality in India as well (Ezeh et al., 2014, Kashima et al., 2010, Neogi et al., 2015).
Another study in India reported that exposure to solid-fuel pollution increased the risk of child deaths at 1–4 years; these reports support our findings (Bassani et al., 2010).
We also found that ETS exposure associated with an increased risk of acute lower respiratory infection and several health outcomes, although some of the effect estimates did not reach statistical significance. Our findings on acute lower respiratory infection supports the findings of other studies suggesting an association between ETS and acute lower respiratory infection (Cheraghi and Salvi, 2009, Jones et al., 2011). Compared with the effects of HAP from solid-fuel use, the adverse effect of ETS was not as apparent, which may be explained in part by lower exposure variation owing to the high prevalence of indoor smoking inside in the study population; approximately 70% of the households surveyed had daily smokers.
More than 30% of children were exposed to pollution from both solid-fuel use and ETS, underscoring the vulnerability of children to multiple health risks in developing countries.
Moreover, the combined exposure was more harmful than each exposure alone. Because previous studies controlled for smoking in analyses of the effects of indoor air pollution, we cannot compare our findings with theirs. We found only one study that investigated the association between the combined effects of maternal smoking and solid-fuel use on infant and child mortality; the authors reported findings similar to ours, concluding that a combined exposure to both solid-fuel pollution and cigarette smoke was more harmful than exposure to each pollutant alone (Akinyemi et al., 2016). Our findings concur with those of the Lancet Commission on Pollution and Health, which estimated that the health burden from multiple
20
exposures would be greater than the simple arithmetic sum of estimated deaths from a single exposure. Future studies should assess the combined effects of several sources of pollution, as evaluating exposure to a single source of pollution may underestimate the true effects (Landrigan et al., 2017).
The adverse effects of HAP from solid-fuel use and ETS on child health outcomes are plausible. Small particulates and carbon monoxide are the two main air pollutants attributable to these exposures. Particulate matter with a diameter less than 10 μm exerts significant adverse health effects as it reaches the lower segments of the lungs and even enters the bloodstream (EPA, 2016). Moreover, particulate matter exposure during pregnancy can cause oxidative stress, inflammation, and coagulation and impair endothelial function and hemodynamic responses (Kannan et al., 2006). High concentrations of carbon monoxide dysregulate carboxyhemoglobin binding and can lead to death (EPA, 2017). Women exposed to carbon monoxide during pregnancy can develop increased carboxyhemoglobin binding, disrupting the supply of oxygen to the developing fetus (Di Cera et al., 1989, EPA, 2010). Restriction of oxygen that leads to hypoxia can be critical, especially in the second and third trimesters, when oxygen is required for normal fetal organogenesis and growth (Hutter et al., 2010). Prenatal exposure may also lead to adverse postnatal effects that result in neonatal and infant death.
Levels of particulate matter and carbon monoxide from biomass burning in homes with inefficient ventilation, mostly in developing countries, have been shown to exceed the World Health Organization Air Quality Standards (Bartington et al., 2017). Although we cannot conclude definitively that a combined exposure to HAP from solid-fuel use and ETS is more
21
harmful than the effects of exposure to only one source of pollution, the underlying mechanisms may act in synergy to exert greater adverse effects.
There are several strengths to our study. First, few studies have examined the effects of a combined exposure to multiple sources of indoor air pollution. Second, we used a large sample and included data from all 33 provinces in Indonesia. Third, the response rate to the survey was high (99%). Fourth, the questionnaires used in the survey were validated prior to the study.
There are also some limitations. First, information was self-reported, which may lead to misclassification of the exposure or outcome status, although the misclassification would be nondifferential, moving the effect estimates toward the null (Rothman, 2012). Second, we do not have any information on ventilation from the 2012 IDHS, which would define the level of exposure among the subjects. But, a study in Indonesia demonstrated that concentrations of the pollutants were still high although the houses had ventilation (Huboyo et al., 2014). Moreover, restricting the subjects to those households that cooked inside the house to minimize exposure misclassification resulted in no substantial changes to the main result. Third, because of the design of the survey, the 2012 IDHS did not measure any air quality data derived from HAP and ETS. However, previous epidemiological studies have used the same method of exposure assignment (Akinyemi et al., 2016, Bassani et al., 2010, Ezeh et al., 2014, Kashima et al., 2010, Khan et al., 2017) with ours and some experimental studies demonstrated that HAP and ETS actually increased the concentrations of pollutants such as particulate matter and carbon monoxide indoors (Bartington et al., 2017, Goniewicz et al., 2009, Semple et al., 2015). Indeed,
22
the study from Indonesia mentioned above demonstrated that mean concentrations of small particles (i.e., particulate matter with a diameter less than 2.5 µm) in households with indoor cooking exceeded 700 µg/m3 (22 to 23 hours) and were much higher than the WHO guideline value (i.e. 25 µg/m3 for 24 hours) although these households had ventilation (World Health Organization, 2014). However, to confirm findings of this study, future studies assessing concentrations of air pollutants for HAP from solid-fuel use and ETS are needed. Fourth, residual confounding from household socioeconomic status or parental medical history is possible; however, adjusting for maternal education or familial wealth index did not result in substantial differences. Moreover, we do not have information on other indoor air pollutants such as insecticide spray and household cleaners or bleaches. Because this information was not available in the 2012 IDHS dataset, future studies will benefit from adjusting for these factors.
3.5. Conclusion
HAP from solid-fuel use and ETS independently associated with an increased risk of adverse child health outcomes in Indonesia and a combined exposure outweighed the independent risk of each source of pollution, showing the presence of additive effect. However, future studies evaluating concentrations of pollutants for HAP from solid-fuel use and ETS are required to confirm findings of this study. Because children are vulnerable to multiple risks in developing countries, community education and environmental policies regulating indoor air pollution from sources such as solid-fuel use and ETS are essential for mitigating the associated adverse health effects.
23
Chapter 4 General Conclusion
We assessed the association between exposure to air pollution and the health of children in Indonesia. In the first study, we evaluated associations between air pollution (NO2 and SO2) and health in children aged 0-3 years in Indonesia. We assigned participants provincial levels of NO2 and SO2 and examined associations with LBW, infant death, neonatal death, and acute ARI. An IQR increase in mean NO2 exposure associated with an increased risk of ARI by 18%.
The association for ARI was confirmed by assessing the quartile exposure categories. In contrast, SO2 was not associated with the risk of any of the studies child health outcomes. In the second study, we assessed the combined effect of household air pollution from solid fuel use and from environmental tobacco smoke and child health outcomes in Indonesia. We observed an increased risk of LBW, neonatal death, infant death, and acute lower respiratory infection. Children exposed to high levels of pollution from solid fuel use were associated with an increased risk of low birth weight, neonatal death, infant death, and acute lower respiratory infection. Exposure to environmental tobacco smoke was associated with an increased risk of acute lower respiratory infection. A combined exposure to HAP from solid fuel use and ETS was more detrimental than exposure to each pollution source alone. The findings from our study showed that exposure to indoor and outdoor air pollution associated with child-health outcomes since early childhood.
24 Figure 1. Selection of study subjects
25
Table 1. Sociodemographic characteristics of participants residing in urban areas in Indonesia's 33 provinces (n=4931)
n (%)
Child Characteristics
Age, years
0 920 (19.2)
1 1554 (32.4)
2 1560 (32.5)
3 766 (16)
Sex
Male 2522 (51.2)
Female 2409 (48.9)
Parents Characteristics
Mother's age, years
<24 994 (20.2)
25-29 1488 (30.2)
30-34 1295 (26.3)
35-39 805 (16.3)
>40 349 (7.1)
Smoking mothers 92 (1.9)
Mother's education
No education 43 (0.9)
Did not complete primary school 274 (5.6)
Completed primary school 631 (12.8)
Did not complete secondary high school 1104 (22.4) Completed secondary high school 1855 (37.6)
Higher 1024 (20.8)
Economy Status
Poorest 500 (10.1)
Poorer 818 (16.6)
Middle Income 1084 (22)
Richer 1243 (25.2)
Richest 1286 (26.1)
26
Table 2. Nitrogen dioxide and sulfur dioxide concentrations in 2009–2011 in Indonesia (µg/m3)a
Range 25th percentile 50th
percentile
75th percentile
NO2
Mean Concentrationb 18 - 131 56 72 90
Maximum Concentration 31 - 242 108 132 164
SO2
Mean Concentrationb 8 – 51 13 20 28
Maximum Concentration 14 - 98 22 37 51
a Nitrogen dioxide (NO2) and sulfur dioxide (SO2) concentrations taken from the Indonesia Environmental Quality Index Report from 2009–2011 published by the Ministry of Environment of the Republic of Indonesia
b We assumed the average of minimum and maximum concentrations as mean concentrations
27
Table 3. Adjusted odds ratios for nitrogen dioxide and health outcomes in urban areas in Indonesia
Case/ Total
number OR (95% CI) Case/ Total
number OR (95% CI) Mean Concentration Maximum Concentration Low birth weight
Continuous (per IQR increase) 262 / 4679 0.98 (0.82 - 1.17) 262 / 4679 0.99 (0.84 - 1.15) Category
Q1 72 / 1179 1 (Reference) 72 / 1179 1 (Reference)
Q2 63 / 1094 0.92 (0.64 - 1.32) 59 / 1094 0.86 (0.60 - 1.24)
Q3 65 / 1216 1.09 (0.73 - 1.64) 69 / 1216 1.20 (0.81 - 1.77)
Q4 62 / 1190 0.95 (0.66 - 1.36) 62 / 1190 0.96 (0.67 - 1.38)
Neonatal death
Continuous (per IQR increase) 82 / 4931 1.06 (0.77 - 1.47) 82 / 4931 1.07 (0.81 - 1.41) Category
Q1 24 / 1346 1 (Reference) 24 / 1346 1 (Reference)
Q2 14 / 1133 0.66 (0.33 - 1.31) 12 / 1133 0.57 (0.28 - 1.18)
Q3 20 / 1243 0.80 (0.37 - 1.72) 22 / 1243 0.94 (0.46 - 1.94)
Q4 24 / 1209 1.11 (0.61 - 2.04) 24 / 1209 1.14 (0.63 - 2.08)
Infant death
Continuous (per IQR increase) 121 / 4925 0.99 (0.76 - 1.28) 121 / 4925 1.00 (0.80 - 1.26) Category
Q1 34 / 1343 1 (Reference) 34 / 1343 1 (Reference)
Q2 28 / 1132 0.92 (0.55 - 1.54) 26 / 1132 0.85 (0.50 - 1.44)
Q3 28 / 1241 0.92 (0.50 - 1.69) 30 / 1241 1.03 (0.58 - 1.85)
Q4 31 / 1209 1.06 (0.64 - 1.77) 31 / 1209 1.08 (0.65 - 1.79)
ARI
Continuous (per IQR increase) 1768 / 4769 1.18 (1.08 - 1.28) 1768 / 4769 1.15 (1.07 - 1.24) Category
Q1 437 / 1298 1 (Reference) 437 / 1298 1 (Reference)
Q2 376 / 1092 1.03 (0.86 - 1.22) 368 / 1095 0.99 (0.84 - 1.18)
Q3 499 / 1203 1.41 (1.16 - 1.72) 507 / 1200 1.48 (1.21 - 1.79)
Q4 456 / 1176 1.27 (1.07 - 1.51) 456 / 1176 1.28 (1.08 - 1.51)
ARI acute respiratory infection, CI confidence interval, IQR interquartile range, OR odds ratio.
Adjusted for mother's age, child's age, child's sex, smoking status, mother's education, and gross domestic regional bruto.
Table 4. Adjusted odds ratios for sulfur dioxide and health outcomes in urban areas in Indonesia
28 Case/
Total number
OR (95% CI) Case/ Total
number OR (95% CI) Mean Concentration Maximum Concentration Low birth weight
Continuous (per IQR increase) 262 / 4679 0.98 (0.82 - 1.17) 262 / 4679 0.99 (0.83 - 1.17) Category
Q1 61 / 1128 1 (Reference) 58 / 1116 1 (Reference)
Q2 68 / 1261 1.17 (0.80 - 1.71) 71 / 1273 1.19 (0.82 - 1.73)
Q3 79 / 1344 1.35 (0.93 - 1.96) 79 / 1344 1.36 (0.94 - 1.98)
Q4 54 / 946 1.01 (0.68 - 1.49) 54 / 946 1.02 (0.69 - 1.52)
Neonatal death
Continuous (per IQR increase) 82 / 4931 0.86 (0.62 - 1.21) 82 / 4931 0.89 (0.65 - 1.23) Category
Q1 23 / 1239 1 (Reference) 20 / 1252 1 (Reference)
Q2 21 / 1311 0.88 (0.45 - 1.71) 24 / 1298 1.19 (0.62 - 2.30)
Q3 26 / 1369 1.05 (0.55 - 2.03) 26 / 1369 1.27 (0.65 - 2.45)
Q4 12 / 1012 0.62 (0.29 - 1.32) 12 / 1012 0.72 (0.33 - 1.57)
Infant death
Continuous (per IQR increase) 121 / 4925 0.97 (0.75 - 1.25) 121 / 4925 0.99 (0.78 - 1.26) Category
Q1 32 / 1238 1 (Reference) 29 / 1251 1 (Reference)
Q2 30 / 1309 0.88 (0.51 - 1.53) 33 / 1296 1.12 (0.66 - 1.91)
Q3 34 / 1368 0.99 (0.57 - 1.71) 34 / 1368 1.14 (0.66 - 1.96)
Q4 25 / 1010 0.90 (0.52 - 1.56) 25 / 1010 1.01 (0.58 - 1.77)
ARI
Continuous (per IQR increase) 1768 / 4769 0.98 (0.90 - 1.06) 1768 / 4769 0.98 (0.90 - 1.07) Category
Q1 430 / 1198 1 (Reference) 430 / 1209 1 (Reference)
Q2 489 / 1271 1.01 (0.85 - 1.21) 489 / 1260 1.07 (0.90 - 1.27)
Q3 493 / 1322 0.95 (0.79 - 1.14) 493 / 1322 0.98 (0.82 - 1.18)
Q4 356 / 978 0.99 (0.83 - 1.18) 356 / 978 1.01 (0.85 - 1.21)
ARI acute respiratory infection, CI confidence interval, IQR interquartile range, OR odds ratio
Adjusted for mother's age, child's age, child's sex, smoking status, mother's education, and gross domestic regional bruto.
Supplementary Table 1. Adjusted odds ratios for nitrogen dioxide and health outcomes in urban areas in Indonesia
29 Case/
Total number
OR (95% CI) Case/ Total
number OR (95% CI) Mean Concentration Maximum Concentration
Low birth weight
Continuous (per IQR increase) 262 / 4679 1.01 (0.85 - 1.21) 262 / 4679 1.01 (0.87 - 1.18)
Category
Q1 72 / 1179 1 (Reference) 72 / 1179 1 (Reference)
Q2 63 / 1094 1.05 (0.73 - 1.51) 59 / 1094 0.98 (0.68 - 1.42)
Q3 65 / 1216 1.19 (0.80 - 1.79) 69 / 1216 1.29 (0.87 - 1.91)
Q4 62 / 1190 1.02 (0.70 - 1.47) 62 / 1190 1.02 (0.71 - 1.48)
Neonatal death
Continuous (per IQR increase) 82 / 4931 1.14 (0.83 - 1.56) 82 / 4931 1.12 (0.86 - 1.47)
Category
Q1 24 / 1346 1 (Reference) 24 / 1346 1 (Reference)
Q2 14 / 1133 0.82 (0.41 - 1.65) 12 / 1133 0.73 (0.35 - 1.51)
Q3 20 / 1243 0.95 (0.44 - 2.04) 22 / 1243 1.08 (0.53 - 2.21)
Q4 24 / 1209 1.27 (0.68 - 2.34) 24 / 1209 1.28 (0.70 - 2.37)
Infant`s death
Continuous (per IQR increase) 121 / 4925 1.03 (0.80 - 1.33) 121 / 4925 1.04 (0.83 - 1.29)
Category
Q1 34 / 1343 1 (Reference) 34 / 1343 1 (Reference)
Q2 28 / 1132 1.12 (0.66 - 1.90) 26 / 1132 1.07 (0.62 - 1.83)
Q3 28 / 1241 1.07 (0.58 - 1.97) 30 / 1241 1.15 (0.64 - 2.07)
Q4 31 / 1209 1.16 (0.69 - 1.95) 31 / 1209 1.17 (0.69 - 1.96)
ARI
Continuous (per IQR increase)
1768 /
4769 1.20 (1.10 - 1.31) 1768 / 4769 1.17 (1.09 - 1.26)
Category
Q1 437 / 1298 1 (Reference) 437 / 1298 1 (Reference)
Q2 376 / 1092 1.11 (0.93 - 1.33) 368 / 1095 1.08 (0.91 - 1.29) Q3 499 / 1203 1.50 (1.23 - 1.84) 507 / 1200 1.55 (1.27 - 1.88) Q4 456 / 1176 1.33 (1.11 - 1.58) 456 / 1176 1.33 (1.11 - 1.58) ARI acute respiratory infection, CI confidence interval, IQR interquartile range, and OR odds ratio
Adjusted for mother`s age, baby`s age, baby`s sex, smoking status, gross domestic regional bruto, and wealth index
Supplementary Table 2. Adjusted odds ratios for sulfur dioxide and health outcomes in urban areas in Indonesia
30
Case/ Total
number OR (95% CI) Case/ Total
number OR (95% CI)
Mean Concentration Maximum Concentration
Low birth weight 262 / 4679 1.01 (0.85 - 1.20) 262 / 4679 1.02 (0.86 - 1.20)
Continuous (per IQR increase)
Category 61 / 1128 1 (Reference) 58 / 1116 1 (Reference)
Q1 68 / 1261 1.19 (0.81 - 1.74) 71 / 1273 1.24 (0.85 - 1.80) Q2 79 / 1344 1.43 (0.98 - 2.09) 79 / 1344 1.47 (1.00 - 2.14) Q3 54 / 946 1.07 (0.73 - 1.58) 54 / 946 1.10 (0.74 - 1.62)
Q4
Neonatal death 82 / 4931 0.92 (0.67 - 1.27) 82 / 4931 0.95 (0.69 - 1.29)
Continuous (per IQR increase)
Category 23 / 1239 1 (Reference) 20 / 1252 1 (Reference)
Q1 21 / 1311 0.92 (0.47 - 1.78) 24 / 1298 1.30 (0.68 - 2.48) Q2 26 / 1369 1.23 (0.64 - 2.40) 26 / 1369 1.52 (0.78 - 2.96) Q3 12 / 1012 0.70 (0.33 - 1.47) 12 / 1012 0.83 (0.39 - 1.76)
Q4
Infant`s death 121 / 4925 1.04 (0.82 - 1.34) 121 / 4925 1.05 (0.83 - 1.34)
Continuous (per IQR increase)
Category 32 / 1238 1 (Reference) 29 / 1251 1 (Reference)
Q1 30 / 1309 0.96 (0.55 - 1.65) 33 / 1296 1.24 (0.72 - 2.11) Q2 34 / 1368 1.16 (0.67 - 2.02) 34 / 1368 1.35 (0.78 - 2.35) Q3 25 / 1010 1.05 (0.61 - 1.80) 25 / 1010 1.18 (0.68 - 2.05)
Q4
ARI 1768 / 4769 1.01 (0.93 - 1.10) 1768 / 4769 1.01 (0.93 - 1.09)
Continuous (per IQR increase)
Category 430 / 1198 1 (Reference) 430 / 1209 1 (Reference)
Q1 489 / 1271 1.06 (0.89 - 1.27) 489 / 1260 1.12 (0.94 - 1.33) Q2 493 / 1322 1.03 (0.85 - 1.24) 493 / 1322 1.06 (0.89 - 1.28)
Q3 356 / 978 1.05 (0.87 - 1.25)
356 / 978 1.08 (0.90 - 1.29) Q4
ARI acute respiratory infection, CI confidence interval, IQR interquartile range, and OR odds ratio
Adjusted for mother`s age, baby`s age, baby`s sex, smoking status, gross domestic regional bruto, and wealth index
Table 5. Demographic characteristics of children included in the study (N = 36,842)
Variable Total