§3. Pulse Height Analysis on Spike Signals of the Balance Voltage in the LHD Helical Coils
Yanagi, N., Imagawa, S.
A series of excitation tests have been conducted for the superconducting coil system of the Large Helical Device (LHO) during the third experimental campaign. In these tests, cryogenic stability properties of the helical coils (HC) were intensively investigated. The balance voltage between the corresponding pairs of coil blocks is a valuable diagnostic for He. Figure 1 shows the observed waveform of the balance voltage of the H-I (innermost) blocks during the excitation up to the toroidal field of 2.7 T. As is seen in Fig. 1, the balance voltage contains a number of spike signals especially during the ramp-up phase. The waveform observed in the ramp-down phase looks rather different from that in the ramp-up phase.
It has been confirmed that these spike signals are generated by fast changes of the coil self-inductance due to conductor movement. Pulse height analysis (PHA) was applied to these spike signals with a purpose of extracting useful information regarding the mechanical properties of the helical windings under the application of electromagnetic stress. The obtained results are shown in Fig. 2, where the number of spike counts is plotted as a function of spike voltage. It can be seen that the spike counts obey exponential distribution functions, which are characterized by two components for the ramp-up phase and one component for the ramp-down phase.
>
E
"DC
Jul. 21,1999
[2~O~V~l]i;~I~lj;::~1
6~~~~~~~~~~~~~~
~ ~ 4r····-···f··+···~···,··· ... ;~, ... ~
LL....:.
u
03
~ 0 2 1 ...
0 ...~
... ; ... .c
@g>
~1 1-... , ;,. ... ; ... ; ... + ...
;~...
-j:2
OL.~.J .••••• ~ .••••• ' •••••• J ••••• " •••••• ' ••••• . L ..•.. ' .•.•.• J ••••••• J •••••• J ••.•••• L .... J •••••• " •••.• x.. .... Jo 2000 4000 6000 8000
Time (s)
Fig. I Waveform of the balance voltage of H-I blocks during the first excitation test up to the toroidal field of 2.7 T in the third experimental campaign. Magnetic field measured hy a Hall probe on the coil-can is also shown.
(a) Ramp
·up Phase 10' ·'··'·'··'T'·TT'T,. ... ,.·'T'·'··'·'·~~ 1000 ::>
o
o
100... .
)
......~
...•... .) ... ..j
~ , '~
~ ':,N!iJ,,:LJ
o 10 20 30 40
S pike Voltage (m V)
(b) Ram p· down Phase
1004 -T,"r-"'l-,-',·,..o.r"l"T-,--r-"'-r"'-T"-''?~
~ 1000
::> •
~
100 .\i 101 \ ...
i::i.'·"1
1
"t.,L."~.,.L.,."., .. l., .. ,., .J
10 20 30 40
S pike Voltage (m V)
Fig. 2 Distribution functions of the spike signals obtained by pulse height analysis: (a) ramp-up phase up to 2.7 T and (b) ramp-down phase.
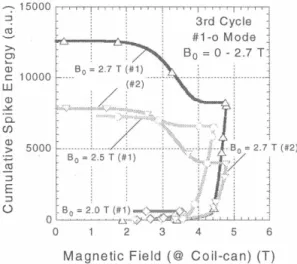
Figure 3 shows the cumulative spike energy (given by the time integration of each spike voltage multiplied by the magnetic field at the spike event) as a function of the magnetic field for the series of excitation tests. As is seen in Fig. 3, the released spike energy is drastically reduced in successive runs up to the already experienced operation points. This observation indicates the so-called Kaiser effect, which has been universally observed with acoustic emission (AE) measurement in many superconducting coils 1). Moreover, these curves look very similar to those given in 1), in which the cumulative AE energy was found to be well fitted by simple equations derived by the force balance in the conductor motion by taking into account frictional force. Analysis using similar models is being performed and the result will be reported elsewhere.
-; 15000 ;
J J t t : t , , I i . i . • • J tI
..I "
"
3rd Cycle ~
#1-0 Mode ~ 8 0 = 0 - 2.7 T1
~
>.
Ol
Q)
.:::s:.
Cl..
en
Q)
>
:;::;
~
~
E
~