Delayed Maturation and Differentiation of Neurons in Focal Cortical Dysplasia With the Transmantle Sign: Analysis of Layer-Specific Marker Expression
Takafumi Sakakibara, MD, Sayuri Sukigara, MD, Takashi Saito, MD, Taisuke Otsuki, MD, Akio Takahashi, MD, Yuu Kaneko, MD, Takanobu Kaido, MD, Yuko Saito, MD, Noriko Sato, MD, Yukio Kimura, MD, Eiji Nakagawa, MD, Kenji Sugai, MD,
Masayuki Sasaki, MD, Yu-ichi Goto, MD, and Masayuki Itoh, MD
From the Epilepsy Center (TS, SS, TS, TO, AT, YK, TK, YS, NS, YK, EN, KS, MS, YG, MI) and Department of Mental Retardation and Birth Defect Research (TS, SS, TS, YG, MI), National Center of Neurology and Psychiatry, Tokyo; Departments of Child Neurology (TS, TS, EN, KS, MS), Neurosurgery (TO, AT, YK, TK), Pathology (YS), and Radiology (NS, YK), Hospital of National Center of Neurology and Psychiatry, Kodaira; Department of Pharmacology (SS), Interdisciplinary Graduate School of Medicine and Engineering, University of Yamanashi, Yamanashi, Japan.
Send correspondence and reprint requests to: Masayuki Itoh, MD, Department of Mental Retardation and Birth Defect Research, National Center of Neurology and
Psychiatry, 4-1-1 Ogawahigashi, Kodaira, Tokyo 187-8502, Japan; E-mail:
Dr Sakakibara is currently with the Department of Pediatrics, Nara Medical University, Nara, Japan.
This work was supported by the Intramural Research Grants (21B5 and 22A3) for Neurological and Psychiatric Disorders of National Center of Neurology and Psychiatry and the Ministry of Health, Labor, and Welfare of Japan (Research on Intractable Disease 21-110 and 22-133).
Supplemental digital content is available for this article. Direct URL citations appear in the printed text and are provided in the HTML and PDF versions of this article on the journal’s Web site (www.jneuropath.com).
Abstract
Transmantle dysplasia is a rare type of focal cortical dysplasia (FCD) characterized by expansion of the cortex from the deep white matter to the surface and in which there is a FCD IIA or IIB pathologic pattern. To characterize possible mechanisms underlying this regional disorder of radial migrating cells, we studied the expression patterns of neocortical layer-specific markers using immunohistochemistry in surgical specimens from 5 FCD IIA and 4 FCD IIB cases in children. All neuronal cells expressed the mature neuron marker MAP2/2B but not the microglia markers Iba-1 and CD68. Some layer-specific markers showed distinct expression patterns. TBR1-positive, SATB2- positive, and FOXP1-positive cells were diffusely distributed in the cortex and/or the white matter. TBR1- positive and FOXP1-positive cells were generally more numerous in FCD IIB than in FCD IIA and were mostly in the cortical molecular and upper layers.
FOXP1-, FOXP2-, and CUTL1-positive cells also expressed the immature neuron marker, Nestin/PROX1, whereas TBR1-, CTIP2-, and SATB2-positive cells only expressed MAP2/2B. These data highlight differences between FCD IIB and FCD IIA with more cells having the immature marker in upper layer markers in the former. By analyzing layer-specific marker expression patterns, we identified apparent neuronal
maturation differences between FCD IIA and FCD IIB in cases of transmantle dysplasia.
KeyWords: Epilepsy, Focal cortical dysplasia, Layer-specific markers, Neural maturation, Transmantle dysplasia, Transmantle sign.
INTRODUCTION
Abnormal maturation and differentiation of neurons result in the formation of cerebral cortical malformations associated with epilepsy. Focal cortical dysplasia (FCD) is a distinctive malformation of cortical development that is a common cause of intractable epilepsy in children who present for surgical treatment (1-4). Recently, the International League Against Epilepsy proposed a new classification of FCD pathologic subtypes based on the identification of isolated dyslamination of the neocortex (FCD I), the presence of characteristic dysmorphic neurons (FCD IIA) or balloon cells (FCD IIB), or a combination of dysplasia associated with tumor, hippocampal sclerosis, vascular malformation, or perinatal injury (FCD III) (5). FCD IIA and FCD IIB also show abnormal neocortical lamination. The pathogenesis of FCD is thought to involve abnormal differentiation of neuron and glial cell in the early embryonic period (6). In the magnetic resonance image, some FCDs exhibit a transmantle sign or are termed transmantle dysplasia (TD), a funnel-shaped lesion from the cortex that passes through the white matter (WM) to the superolateral ventricle (3, 7). It is thought that a genetic abnormality in earlyprogenitor cells forms funnel-shaped lesions of FCD (6). However, TD is a very rare, little-reported entity. A detailed pathologic examination of TD cases would enhance understanding of the pathogenetic mechanisms in FCD.
Laminar formation of the neocortex is known to be highly programmed by genetic control during the embryonic period. Using layer-specific markers, it is possible to identify cell birth timing and cell maturation lineage stage. At first, postmitotic
projection neurons migrate into the cortical plate from the subventricular germinal zone with an inside-out pattern. At the neuronal migration stage, some molecules (e.g., reelin, Lis1, and doublecortin) are required to form the neocortex (2, 8). Finally, mammalian brains show a 6-layer neocortex, each layer with a specific function. Specific genes have important roles at each step; the molecular mechanisms are well known in rodent brains (9) and, to some extent, in the developing human brain (10). Special AT-rich sequence binding protein 2 (Satb2), COUP-TF interacting protein 2 (Ctip2), T-box brain 1 (Tbr1), Cut-like homeobox 1 (Cutl1), and Forkhead box protein P1 and P2 (Foxp1 and Foxp2) are well-known neocortical layer-specific markers. Other layer-specific molecules also play very important roles in forming cortical lamination, and disruption of their genes leads to profound cortical malformation (8, 11). SATB2 generates callosal projections in Layers II to IV and makes subcortical connections (9, 12).
Orthodenticle homeobox 1 (Otx1) is expressed in Layers V and VI (13). Tbr1, a member of the T-box homeobox gene family, is expressed in preplate and Layer VI in fetal brain and makes corticocortical projection neurons (14). Cutl1, Drosophila
homeobox CUT-like 1, is expressed in pyramidal neurons of the upper layer (15).
Foxp1, a transcription factor of the winged-helix/forkhead family, is expressed in neocortical Layers III to V (16).
In a previous study, we reported that the neocortical layer formation of human developing brains is similar to that in mice using the layer-specific markers SATB2, CTIP2, TBR1, CUTL1, and FOXP1 (10). In addition, we found that various
lissencephalies exhibited abnormal layer formation by random migration (10).
However, very little is known about the expression patterns of layer-specific markers in human brain (10, 17), particularly in cortical dysplasia (18). To understand FCD
formation and the origin of the component neurons, we investigated the expression of layer-specific markers from the deep WM to the cortex in FCD with TD.
MATERIALS AND METHODS
Tissue Samples
The use of all tissue samples for this research was approved by the patients’ parents and by ethical committees of the hospital and institute sources. The cases were selected based on the presence of TD, that is, abnormal intensity from the lateral ventricle to the
cortex on the magnetic resonance image (7). Cerebral samples removed from patients with drug-resistant epilepsy and TD during surgery were studied (Table 1 and Fig. 1).
The samples used were obtained from epileptogenic areas, as determined by analysis of seizure semiology, ictal and interictal electroencephalography, magnetic resonance imaging, fluorodeoxyglucose positron emission tomography, and interictal single photon emission computed tomography. For the age-matched control study, we used the same materials as previously described (10, 19). After resection, all samples were fixed in 10% buffered formalin or 4% paraformalded embedded in paraffin. Serial sections, 4 to 6 µm thick, were cut for histologic and immunohistologic examination.
For diagnosis of the resected tissues, the sections were stained with hematoxylin and eosin and Klu¨ver-Barrera stains. The cases were diagnosed as FCD IIA or FCD IIB by 3 neuropathologists based on in the recent classification (5).
Immunohistochemistry
Immunohistochemistry was performed as previously described (10, 20). The primary antibodies were incubated at 4℃ for 24 to 72 hours. To investigate the presence of layerspecific markers in the cortex and WM, we used monoclonal antibodies against SATB2 (dilution of 1:100; Bio Matrix Research, Inc., Chiba, Japan), CUTL1 (1:1000;
Abnova, Taipei, Taiwan), CTIP2 (1:100; Abcam, Cambridge, UK), and polyclonal antibodies against TBR1 (1:100; Abcam), FOXP1 (1:200; Abcam), and FOXP2 (1:1000; Abcam). In addition, we performed double staining to confirm whether layer- specific marker cells were neuron or glial cells. We used antiYmicrotubule-associated protein 2 (MAP2, 1:100; Sigma, St. Louis,MO) or anti–MAP2B (1:100; BD
Biosciences, San Jose, CA) as mature neuron markers. Antibodies to Nestin (1:100;
Chemicon International, Inc., Billerica, MA) or Prospero homeobox protein 1 (PROX1, 1:100; Abcam) were used as immature neuron markers. Anti-glial fibrillary acidic protein (GFAP, 1:100; Cell Signaling Technology, Inc., Beverly, MA) or anti-GFAP (1:1000; Chemicon) were used as astrocyte markers. Antibodies against Iba-1 (1:100;
Biocare Medical, Concord, CA) or CD68 (1:100; DAKO, Glostrup, Denmark) were used as microglia markers. 4’,6’-Dimamidino-2-phenylindole was used as a cell nuclear marker.
Comparison of Immunopositive Cell Counts Between FCD IIA and FCD IIB with TD Variable cell staining was observed in all cases. Because the FCD neocortex showed random layer formation, we divided the cortex evenly into 4 parts: the molecular layer (CxMoL), cortical upper layer (CxUL, upper one-third), cortical middle layer (CxML,
middle one-third), and cortical lower layer (CxLL, other deep cortex). The WM was evenly divided into the subcorticalWM(ScWM; upper third), middleWM(MWM;
middle third), and deep WM (DWM; periventricular region). Cells, excluding
endothelial cells, were counted in each layer in 5 fields at a magnification of _200. The number was corrected per 100 nuclei in each layer for each case as the immunopositive cell density.
For statistical analyses, Student t-test was used for comparison between FCD IIA and FCD IIB in each region. The same test was applied using statistical software (SPSS Inc., Chicago, IL); p G 0.05 was considered significant.
RESULTS
The FCD samples showed abnormal lamination of the cortices and many ectopic neurons in the WM (Figs. 2 and 3). Our FCD series was composed of 5 FCD IIA and 4 FCD IIB, and the immunohistochemistry is summarized in Table 2. In previous studies, TBR1-, CTIP2-, SATB2-, FOXP1-, and CUTL1-containing cells appeared in the fetal period (10, 14, 21). After birth, SATB2-positive and CUTL1-positive cells are present until 3 months of age, although the other markers have already disappeared (10). In
addition, FOXP2 appeared predominantly in Layers IV to V before birth and in Layer IV after birth (Figures: Supplemental Digital Content 1,
http://links.lww.com/NEN/A357; Supplemental Digital Content 2, http://links.lww.com/NEN/A358; Supplemental Digital Content 3, http://links.lww.com/NEN/A359; Supplemental Digital Content 4,
http://links.lww.com/NEN/A360). Distribution and Densities of Cells Expressing
Layer-Specific Markers In FCD IIA and FCD IIB, the layer-specific markerpositive cells were diffusely localized in the cortex; there were few positive cells in
theWM(Figs. 2Y4). In FCD IIA, CUTL1- positive and FOXP2-positive cells were generally more numerous than cells expressing the other markers (Fig. 2). Only TBR1- positive cells were not in the CxMoL. In FCD IIB, all marker cells were also widely distributed, although there were relatively few CTIP2-positive cells (Fig. 3). CUTL1- positive, FOXP1-positive, and FOXP2-positive cells were numerous in both the cortex and the WM. Densities of TBR1-positive and FOXP1-positive cells tended to be higher in FCD IIB than those in FCD IIA (Figs. 4A, D). CTIP2-positive and SATB2-positive cell densities were not different between FCD IIA and FCD IIB (Figs. 4B, C). In the cortex, the densities of FOXP2-positive and CUTL1-positive cells in FCD IIA tended to be higher than those in FCD IIB (Figs. 4E, F); however, in the WM, FOXP2-positive
and CUTL1-positive cell densities in FCD IIB were higher than those in FCD IIA (Figs.
4E, F). White matter densities of FOXP1-positive and FOXP2-positive cells in FCD IIB were greater than those in FCD IIA (Figs. 4D, E).
Phenotypes of Cells Expressing Layer-Specific Markers
To investigate the phenotypes of cells expressing layerspecific markers, we performed double staining with mature neuron, immature or progenitor neuron, glial cell, and microglia markers. In both FCD IIA and FCD IIB, all TBR1- positive, CTIP2-positive, and SATB2-positive cells expressed MAP2 and/or MAP2B (MAP2/2B) but not Nestin, PROX1, or GFAP (Table 2). There were no Iba1- or CD68-positive cells that expressed the layer-specific markers (Figs. 5 and 6 and Table 2).
In FCD IIA, mean MAP2/2B-positive cell concentrations ranged from 20.0% to 30.3%
among the layer-specific marker cells. FOXP1-positive, FOXP2-positive, and CUTL1- positive cells also expressed Nestin or PROX1 (Nestin/PROX1; Figs. 5JYL and Table 2). Mean Nestin/PROX1-positive cell concentrations ranged from 13.3% to 26.2%.
FOXP1-positive and FOXP2-positive cells did not express GFAP, but some CUTL1- positive cells expressed GFAP (18.0% in all CUTL1- positive cells; Fig. 5R).
In FCD IIB, mean MAP2/2BYpositive cell concentrations were 32.2%, 23.5%, and
11.7%, respectively, for FOXP1-positive, FOXP2-positive, and CUTL1-positive cells.
Mean Nestin/PROX1-positive cell concentrations were 46.7%, 36.6%, and 59.1%, respectively (Fig. 6 and Table 2). Thus, there were more Nestin/PROX1-positive cells in FCD IIB than in FCD IIA. A few FOXP1-positive cells in FCD IIB expressed GFAP but more numerous FOXP2-positive and CUTL1-positive cells expressed GFAP (Figs.
6PYR). The mean concentrations of GFAP-expressing cells were 23.2% and 28.3% of cells, respectively.
DISCUSSION
Transmantle dysplasia is a very rare malformation of FCD, but its pathologic features are the same as those of FCD IIA or FCD IIB. Although very little is known about TD, this study may contribute to a new pathophysiologic understanding of FCD
malformations that extend from the ventricular wall to the cortical surface. Our results indicate that cells expressing postnatal layer-specific markers are abnormally present and continuously distributed from deep WM to the cortical surface in TD. As previously described, neurons in these FCD lesions expressed layer-specific markers indicating immaturity (19). Moreover, we identified some specific marker expression patterns that
differed between FCD IIA and FCD IIB pathologies.
TBR1-positive, CTIP2-positive, SATB2-positive, and FOXP1-positive cells, which are originally located in the deep cortex during the fetal period (10), were diffusely
observed in the cortex and/or WM. In particular, TBR1-positive and FOXP1-positive cells in FCD IIB cases were mostly in the CxMoL, CxUL, and DWM, to a greater degree than in FCD IIA cases. This suggests that the malformation and pathologic onset of FCD IIB are more severe and earlier than those in FCD IIA. In mouse brain, Tbr1 is identified from E11.5 and is expressed at a low level in the upper layer and at high levels in the subplate and Layer VI, which extend axons to the thalamus and form callosal projections (14). Satb2 serves to form callosal projections (12). The FCD IIB malformation may be formed in the early fetal period and express immature markers.
SATB2 is also known as a repressor of CTIP2 (12). However, our data show that the CTIP2-positive cell distribution is similar to that of SATB2. In the FCD brain, there may be different molecular mechanisms between SATB2 and CTIP2. On the other hand, the presence of many TBR1-positive and FOXP1- positive cells in DWM of FCD IIB might indicate a neuronal migration arrest in the very early fetal period.
The CUTL1-positive cell distribution pattern was similar to that of FOXP2. In the cortex, concentrations of cells expressing these 2 markers tended to be larger in FCD
IIA than those in FCD IIB, whereas the pattern was reversed in WM. In FCD IIB, the large numbers of CUTL1-positive and FOXP2-positive cells were in the ScWM, MWM and DWM, although there were no significant differences between FCD IIA and IIB, except for CUTL1 in MWM. In mouse brain, Cutl1 is expressed in the upper layer of the cortex from E16 and regulates late neuronal differentiation, such as dendrite development, spine formation, and synaptic function (15, 21). Persistent CUTL1 expression in FCD II suggests delayed synaptic maturation. Recently, FOXP2, a causative gene of developmental verbal dyslexia, was reported to negatively regulate sushi-repeat protein SRPX2 and plasminogen activator (uPAR), whose mutations lead to Rolandic epilepsy or perisylvian polymicrogyria (22). We speculate that FOXP2 overexpression contributes to regional cortical dysplasia via abnormal downregulation of the SRPX2/uPAR complex.
Putative upper layer marker cells, FOXP1, FOXP2, and CUTL1, expressed the immature neuron marker Nestin/PROX1, whereas cells expressing the putative lower layer markers TBR1, CTIP2, and SATB2 only expressed MAP2/2B. This suggests that the cells expressing the putative upper layer markers may maintain their neuronal immaturity. Many CUTL1-positive, FOXP1-positive, and FOXP2-positive cells contained GFAP. Although we do not know the relationship of these markers to glial
cell development, these findings may indicate abnormal neuronal progenitor cell differentiation into both the neuron and glial cells.
In conclusion, we demonstrate that neurons of FCD with TD had delayed maturation and abnormal differentiation. The remaining abnormal expression of various
layerspecific markers in TD is evidence of immature neuronal differentiation in these cortical malformations. The present study may make it possible to clarify differences between FCD IIA and FCD IIB based on their layer-specific marker expression patterns.
ACKNOWLEDGMENTS
The authors thank Dr A. Kakita, Niigata University, for advice on the neuropathologic diagnosis, and Mr N. Kuninaka and S. Kumagai, National Center of Neurology and Psychiatry, for assistance with the immunohistochemistry.
REFERENCES
1. Taylor D, Falconer M, Bruton C, et al. Focal dysplasia of the cerebral cortex in epilepsy. J Neurol Neurosurg Psychiatry 1971;34:369-87
2. Guillemot F, Molnár Z, Tarabykin V, et al. Molecular mechanisms of cortical differentiation. Eur J Neurosci 2006;23:857-68
3. Krsek P, Maton B, Korman B, et al. Different features of histopathological subtypes of pediatric focal cortical dysplasia. Ann Neurol 2008;63:758-69
4. Orlova K, Tsai V, Baybis M, et al. Early progenitor cell marker expression
distinguishes Type II from Type I focal cortical dysplasias. J Neuropathol Exp Neurol 2010;69:850-63
5. Blu¨mcke I, Thom M, Aronica E, et al. The clinicopathologic spectrum of focal cortical dysplasias: A consensus classification proposed by an adhoc Task Force of the ILAE Diagnostic Methods Commission. Epilepsia 2011;52:158-74
6. Englund C, Folkerth R, Born D, et al. Aberrant neuronal-glial differentiation in Taylor-type focal cortical dysplasia (Type IIA/B). Acta Neuropathol 2005;109:519-33 7. Barkovich A, Kuzniecky R, Bollen A, et al. Focal transmantle dysplasia: A specific malformation of cortical development. Neurology 1997;49:1148-52
8. Mochida G, Walsh C. Genetic basis of developmental malformations of the cerebral cortex. Arch Neurol 2004;261:637-40
9. Alcamo EA, Chirivella L, Dautzenberg M, et al. Satb2 regulates callosal projection neuron identity in the developing cerebral cortex. Neuron 2008;57:364-77
10. Saito T, Hanai S, Takashima S, et al. Neocortical layer formation of human developing brains and lissencephalies: Consideration of layerspecific marker expression. Cereb Cortex 2011;21:588-96
11. Molyneaux B, Arlotta P, Menezes J, et al. Neuronal subtype specification in the cerebral cortex. Nat Rev Neurosci 2007;8:427-37
12. Britanova O, de Juan Romero C, Cheung A, et al. Satb2 is a postmitotic determinant for upper-layer neuron specification in the neocortex. Neuron 2008;57:378-92
13. Weimann JM, Zhang YA, Levin ME, Devine WP, Brulet P, McConnell SK.
Cortical neurons require otx1 for the refinement of exuberant axonal projections to subcortical targets. Neuron 1999;24:819-31
14. Hevner R, Shi L, Justice N, et al. Tbr1 regulates differentiation of the preplate and Layer 6. Neuron 2001;29:353-66
15. Nieto M, Monuki E, Tang H, et al. Expression of Cux-1 and Cux-2 in the subventricular zone and upper Layers IIYIV of the cerebral cortex. J Comp Neurol
2004;479:168-80
16. Ferland RJ, Cherry TJ, Preware PO, Morrisey EE, Walsh CA. Characterization of Foxp2 and Foxp1 mRNA and protein in the developing and mature brain. J Comp Neurol 2003;460:266-79
17. Hevner RF. Layer-specific markers as probes for neuron type identity in human neocortex and malformations of cortical development. J Neuropathol Exp Neurol 2007;66:101-9
18. Hadjivassiliou G, Martinian L, Squier W, et al. The application of cortical layer markers in the evaluation of cortical dysplasias in epilepsy. Acta Neuropathol 2010;120:517-28
19. Hanai S, Saito T, Nakagawa E, et al. Abnormal maturation of nondysmorphic neurons in focal cortical dysplasia: Immunohistochemical considerations. Seizure 2010;19:274-9
20. Okazaki S, Ohsawa M, Kuki I, et al. Aristaless-related homeobox gene disruption leads to abnormal distribution of GABAergic interneurons in human neocortex:
Evidence based on a case of X-linked lissencephaly with abnormal genitalia (XLAG).
Acta Neuropathol 2008;116:453-62
21. Cubelos B, Sebastia´n-Serrano A, Beccari L, et al. Cux1 and Cux2 regulate
dendritic branching, spine morphology, and synapses of the upper layer neurons of the cortex. Neuron 2010;66:523-35
22. Roll P, Vernes SC, Bruneau N, et al. Molecular networks implicated in speech- related disorders: FOXP2 regulates the SRPX2/uPAR complex. Hum Mol Genet 2010;19:4848-60
TABLE 1. Clinicopathological profile of FCD with TD patients
FIGURE 1. Head magnetic resonance images of all patients showing the ‘‘transmantle sign’’ of focal cortical dysplasia (arrows). (A) Axial view of a T1-weighted image of Case 1. (B) Axial view of a T2-weighted image of Case 2. (C) Axial view of a T1-
Case Sex Age at Seizure
Onset Age at Surgery Seizure Type Intelligence (DQ or IQ)
TD Location on Imaging
Pathologic Diagnoses
1 F 1mo 6mo GTC 53 P+O FCD IIA
2 F 1mo 8mo GTC+WS 86 T+P+O FCD IIA
3 M 0mo 1mo WS 100 Fr FCD IIA
4 F 2y1mo 6y4mo GTC 83 Fr FCD IIA
5 F 1mo 2y9mo GTC+WS+MS 10 T+P+O FCD IIA
6 M 0mo 6mo GTC+MS 95 Fr FCD IIB
7 F 3y0mo 10y9mo CPS 111 T+P FCD IIB
8 M 1y0mo 1y1mo CPS 91 Fr FCD IIB
9 M 4mo 2y1mo WS+CPS 100 P FCD IIB
M, male; F, female; GTC, generalised tonic-clonic seizure; WS, West syndrome; MS, myoclonic seizure; CPS, complex partial seizure; IQ, intelliget quotient; DQ, developmental quotient; Fr, frontal lobe; T, temporal lobe; P, parietal lobe; O, Occipital lobe; TD, transmantle dysplasia; FCD IIA and FCD IIB, focal cortical dysplasia IIA and IIB. Pathological diagnoses are based on the international classification.
weighted image of Case 3. (D) Axial view of a FLAIR image of Case 4. (E) Axial view of a FLAIR image of Case 5. (F) Coronal view of a T2-weighted image of Case 6. (G) Axial view of a T1-weighted image of Case 7. (H) Coronal view of a FLAIR image of Case 8. (I) Coronal view of a FLAIR image of Case 9.
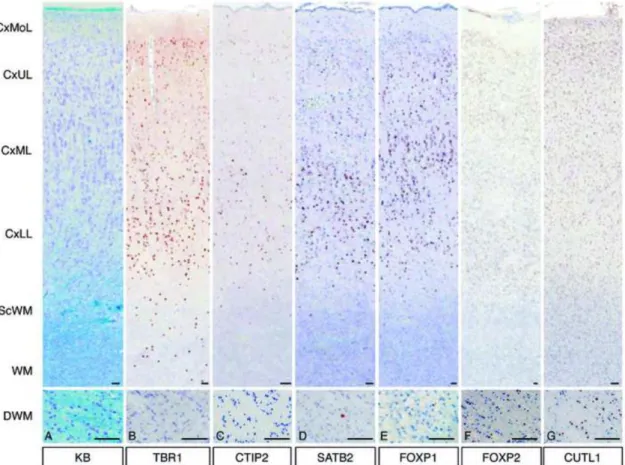
FIGURE 2. Expression patterns of layer-specific markers in focal cortical dysplasia (FCD) IIA. (A) FCD IIA shows cortical dyslamination, a high cell density, and many heterotopic neurons in the white matter. (B) TBR1-positive cells are distributed diffusely, particularly in the cortical upper (CxUL) and lower (CxLL) layers. (C, D)
CTIP2-positive cells and SATB2-positive cells are predominantly in the CxLL. (E) FOXP1-positive cells are in the cortical middle layer (CxML) and CxUL. (F) FOXP2- positive cells are diffusely distributed in the cortex and white matter; there are a few in the deep white matter (DWM). (G) CUTL1-positive cells are also diffusely distributed.
(A) KB indicates Klüver-Barrera. (B) TBR1 indicates T-box, brain, 1. (C) CTIP2 indicates COUP-TF interacting protein 2. (D) SATB2 indicates special AT-rich
sequence binding protein 2. (E) FOXP1 indicates Forkhead box protein P1. (F) FOXP2 indicates Forkhead box protein P2. (G) CUTL1 indicates Cut-like homeobox 1. CxMoL indicates molecular layer of cortex; CxUL, upper layer (upper one third of the cortex);
CxML, middle layer (middle one-third of the cortex); CxLL, lower layer (lower one- third of the cortex); ScWM, subcortical white matter; MWM, middle white matter;
DWM, deep white matter (near ventricular wall). Bars = 100 µm.
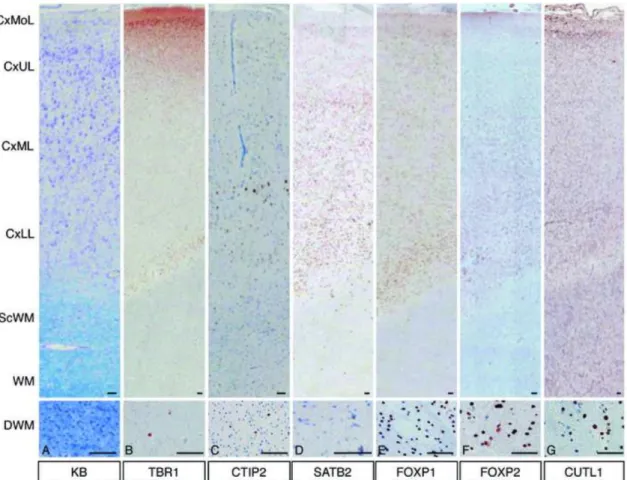
FIGURE 3. Expression patterns of layer-specific markers in focal cortical dysplasia (FCD) IIB. (A) FCD IIB also shows cortical dyslamination, high cell density, and many heterotopic neurons in the white matter. (B) TBR1-positive cells are diffusely
distributed in the cortex and white matter. (C) CTIP2-positive cells are in the CxML and CxLL. (D) SATB2-positive cells are diffusely distributed in the cortex, but there are only a few in the white matter. (E) FOXP1-positive cells are in the cortex and DWM.
(F) FOXP2-positive cells are also in the cortex and white matter. (G) CUTL1-positive cells are diffusely distributed; they are particularly numerous in the white matter. (A) KB indicates Klüver-Barrera. (B) TBR1 indicates T-box, brain, 1. (C) CTIP2 indicates
COUP-TF interacting protein 2. (D) SATB2 indicates special AT-rich sequence binding protein 2. (E) FOXP1 indicates Forkhead box protein P1. (F) FOXP2 indicates
Forkhead box protein P2. (G) CUTL1 indicates Cut-like homeobox 1. CxMoL indicates molecular layer of cortex; CxUL, upper layer (upper one-third of the cortex); CxML, middle layer (middle one-third of the cortex); CxLL, lower layer (lower one-third of the cortex); ScWM, subcortical white matter; MWM, middle white matter; DWM, deep white matter (near ventricular wall). Bars = 100 µm.
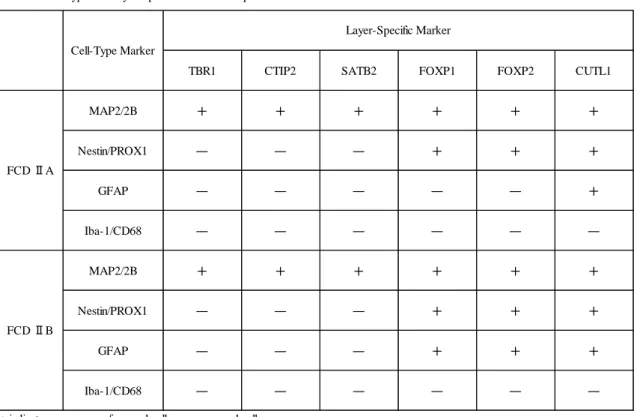
Table 2 Cell-Type and Layer-Specific Marker Coexpression
TBR1 CTIP2 SATB2 FOXP1 FOXP2 CUTL1
MAP2/2B + + + + + +
Nestin/PROX1 ― ― ― + + +
GFAP ― ― ― ― ― +
Iba-1/CD68 ― ― ― ― ― ―
MAP2/2B + + + + + +
Nestin/PROX1 ― ― ― + + +
GFAP ― ― ― + + +
Iba-1/CD68 ― ― ― ― ― ―
+ indicate appearance of merged cells; -, no merged cell appearance.
MAP2/2B indicates microtubule-associated protein 2/2B; GFAP, glial fibrillary acidic protein; TBR1, T-box, brain, 1; CTIP2, COUP-TF interacting protein 2; SATB2, special AT-rich sequence binding protein 2; CUTL1, Cut-like homeobox 1, FOXP1 and FOXP2, Forkhead box P1 and P2; PROX1, Peospero homeobox protein 1.
Cell-Type Marker
Layer-Specific Marker
FCD ⅡA
FCD ⅡB
FIGURE 4. Distribution of layer-specificmarker cell ratios (marker-positive cell number/total 4’,6’-dimamidino-2-phenylindoleYpositive cell number) in regions of focal cortical dysplasia (FCD) IIA and IIB. (A-F) Compared with FCD IIA, FCD IIB has a higher TBR1 ratio (A) and FOXP1 ratio (D) in the cortical upper layer (CxUL), and CUTL1 ratio in the middle white matter (MWM) (F). On the contrary, FCD IIA shows higher FOXP2 ratio in the CxUL (E). Other regionmarker ratios are not
significantly different between FCD IIA and FCD IIB. TBR1 indicates T-box, brain, 1;
CITP2, COUP-TF interacting protein 2; SATB2, special AT-rich sequence binding protein 2; FOXP1 and 2, Forkhead box protein P1 and P2; CUTL1, Cut-like homeobox 1.
FIGURE 5. Types of cells expressing layer-specific markers in focal cortical dysplasia (FCD) IIA. (A-F) All cells expressing layerspecific markers express microtubule- associated protein (MAP) 2 or 2B. (G-L) Forkhead box protein P1 (FOXP1)-positive, Forkhead box protein P2 (FOXP2)-positive, and Cut-like homeobox 1
(CUTL1)Ypositive cells also express the immature neuron markers, Nestin or Prospero homeobox protein 1 (PROX1) (J-L), whereas cells expressing the other markers do not (G-I). (M-R) Only CUTL1-positive cells express glial fibrillary acidic protein (GFAP) (R). (S-Y) Layer-specific marker-positive cells do not express Iba-1 or CD68.
FIGURE 6. Types of cells expressing layer-specific markers in focal cortical dysplasia (FCD) IIB. (A-F) All cells expressing layerspecific markers express microtubule- associated protein (MAP) 2 or 2B. (G-L) Forkhead box protein P1 (FOXP1)-positive, Forkhead box protein P2 (FOXP2)-positive, and Cut-like homeobox 1 (CUTL1)- positive cells also express the immature neuron markers, Nestin or Prospero homeobox protein 1 (PROX1) (J-L), whereas cells expressing the other markers do not (G-I). (M- R) FOXP1-positive, FOXP2-positive, and CUTL1-positive cells express glial fibrillary acidic protein (GFAP) (P-R). (S-Y) Layer-specific markerpositive cells do not express Iba-1 or CD68.