A Report on Infectious Disease Occurrence in a Japanese Child Care Center Situation 保育所における感染症発生状況に関する検討
Satoko Yokota
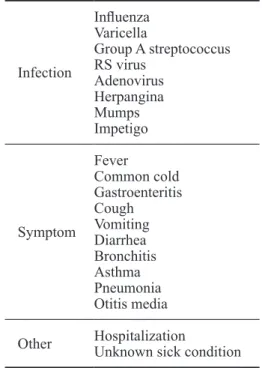
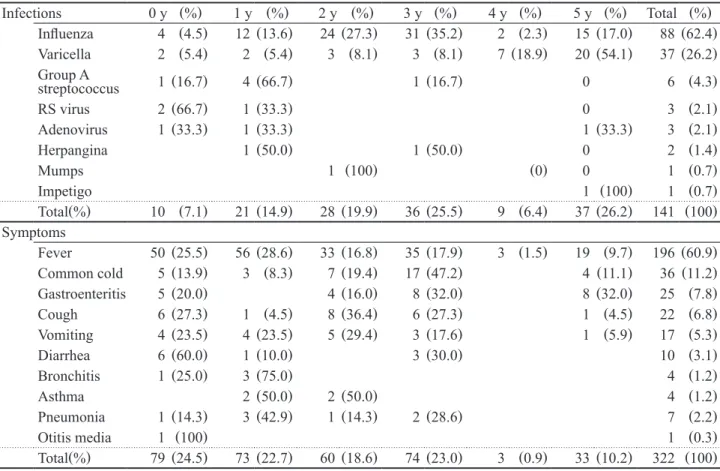
1)要約
保育所は,子どもが長時間接触しながら生活をしているため,感染症が発生するとすぐに広がる環境であ り,感染症対策が重要である.本研究は,感染症伝播動態メカニズムを分析するうえで基本となる,A保育 所の感染発生動向調査の結果を報告する.対象者は,2016 年 4 月 1 日から 2017 年 3 月 31 日まで保育所 に所属した 0 ~ 5 歳児.月ごとの最大在籍者数は 294 名であった.感染症を発症した子供の総数は 141 名 であった.最も多く報告された感染症はインフルエンザで,次に水痘であった.月別の感染症報告件数の比 較から、インフルエンザが 1 月に、水痘が 5 月に多く発生した結果となった。感染の流行が最も多かった 症状は,発熱,風邪,および胃腸炎であった.本調査結果から,A 保育所におけるインフルエンザと水痘の 集団感染の発生が示唆された.今後保育所における集団感染の要因、および感染経路を明らかにしていく必 要がある.
感染症,インフルエンザ,水痘,保育所