Establishment of systematic approach for
selection of prodrugs designed to improve oral absorption
著者 清水 麻衣
著者別表示 SHIMIZU Mai journal or
publication title
博士論文本文Full 学位授与番号 13301甲第408号
学位名 博士(創薬科学)
学位授与年月日 2020‑09‑28
URL http://hdl.handle.net/2297/00061311
Creative Commons : 表示 ‑ 非営利 ‑ 改変禁止 http://creativecommons.org/licenses/by‑nc‑nd/3.0/deed.ja
Establishment of systematic approach for selection of prodrugs designed to improve oral absorption
Mai Shimizu
July 2020
Dissertation
Establishment of systematic approach for selection of prodrugs designed to improve oral absorption
Graduate School of Medical Sciences Kanazawa University Division: Division of Pharmaceutical Sciences Laboratory: Drug Metabolism and Toxicology
School registration No.: 1729012005
Name: Mai Shimizu
Primary supervisor name: Miki Nakajima
LIST OF CONTENTS
ABBREVIATIONS
GENERAL INTRODUCTION
1CHAPTER 1
Establishment of systematic approach for selection of prodrugs based on
physicochemical/biopharmaceutical properties and metabolic profiles of marketed prodrugs
Summary 3
Introduction 3
Experimental procedures 4
Results 13
Discussion 27
CHAPTER 2
Systematic approach for selection of prodrugs: evaluation using oseltamivir analogues as models
Summary 32
Introduction 32
Experimental procedures 34
Results 39
Discussion 49
CONCLUSION
55REFERENCES 58
ACKNOWLEDGEMENTS 63
LIST OF PUBLICATIONS 64
ABBREVIATIONS
ADME Absorption, distribution, metabolism, and excretion BNPP Bis-p-nitrophenyl phosphate
BSA Bovine serum albumin
CES Carboxylesterase
Cequilibrium Equilibrium concentration
CLint Intrinsic clearance
CLint,liver CLint in liver
CLint,serum CLint in serum
CLint,small intestine CLint in small intestine
CLint,total The sum of CLint,small intestine, CLint,liver, and CLint,serum
CR Conversion ratio
CRliver CR in liver
CRserum CR in serum
CRsmall intestine CR in small intestine
CS Conversion score
CSliver CS in liver
CSserum CS in serum
CSsmall intestine CS in small intestine
CStotal The sum of CSsmall intestine, CSliver, and CSserum
DMSO Dimethyl sulfoxide
F Bioavailability
FaSSIF Fasted-state simulated intestinal fluid FeSSIF Fed-state simulated intestinal fluid Fg First pass effect in gut
HBSS Hanks’ balanced salt solution JP1 Japanese pharmacopoeia 1st fluid
JP2 Japanese pharmacopoeia 2nd fluid
LC/MS Liquid chromatography-mass spectrometry
LC-MS/MS Liquid chromatography-tandem mass spectrometry.
NADPH Nicotinamide adenine dinucleotide phosphate Papp Apparent permeability coefficients
Papp_AM Papp value of active metabolite
Papp_PD Papp value of prodrug
Papp_PD total The sum of Papp_PD value and Papp_PD>AM
Papp_PD>AM Papp value of active metabolite produced
PBS Phosphate-buffered saline
Pe Permeability coefficients
PK Pharmacokinetic
R Membrane retention
1
GENERAL INTRODUCTION
In drug development, we sometimes encounter disadvantages of new chemical entities such as low bioavailability, short duration of action, and toxicity. One of the effective
strategies to overcome them is the development of prodrugs (Rautio et al., 2008; Huttunen et al., 2011; Akhani et al., 2017). Prodrugs, which are pharmacologically inactive forms, are subjected to enzymatic or non-enzymatic biotransformation to form active metabolites in the body. Many prodrugs have been developed by the improvement of membrane permeability or solubility, because gastrointestinal permeability and solubility of drugs are the determinants to control the absorption and bioavailability of drugs. For example, enalapril, oseltamivir, and temocapril were developed to improve oral absorption by increasing of the permeability of the pharmacologically active compounds, whereas estramustine phosphate, fosamprenavir, and prednisolone phosphate were those by increasing the solubility of the pharmacologically active compounds (Rautio et al., 2008).
Although the concept of the some developed prodrugs on sale has been publicly
disclosed, there is limited information on the process for the development of efficient prodrug (Rautio et al., 2008; Huttunen et al., 2011; Akhani et al., 2017). Design for prodrugs has been well discussed focusing on certain active compounds (Nofsinger et al., 2014; Schade et al., 2014), but general systematic strategies to select candidate prodrugs with ideal
pharmacokinetics have not matured yet (Jana et al., 2010; Hoppe et al., 2014). In the case of drugs that are pharmacologically active themselves (non-prodrugs), their physicochemical parameters such as log P, molecular weight, and polar surface areas, have been often reviewed for their effects on pharmacokinetic parameters (Veber et al., 2002; Meanwell et al., 2011), whereas those of the marketed prodrugs have not been discussed. As the concept of
drug-likeness has been used for optimizing pharmacokinetic properties of marketed drugs (Leeson and Springthorpe, 2007), it should be possible to use the concept of prodrug-likeness to optimize pharmacokinetic properties of candidate prodrugs.
Pre-clinical studies using experimental animals are performed to predict the
2
pharmacokinetics in humans prior to clinical trials. There are species differences in substrate specificities and tissue distributions of drug-metabolizing enzymes including hydrolases, which are responsible for the conversion of prodrugs into active metabolites in most cases (Cerny, 2016; Fukami and Yokoi, 2012). Thus, similar to non-prodrug, the selection of appropriate experimental animal species is also crucial for prodrug development from the viewpoints of pharmacokinetics and pharmacodynamics.
In Chapter 1, to establish an in vitro system for selection of candidate prodrugs and appropriate experimental animals, physicochemical/biopharmaceutical properties (Log D, solubility, and membrane permeability) and metabolic stabilities of 21 selected clinically used prodrugs and their active metabolites were characterized. Twenty-one prodrugs, which had been developed for improved oral absorption of pharmacologically active metabolites, were classified into two types: (1) 16 prodrugs designed to improve membrane permeability of pharmacologically active metabolites and (2) 5 prodrugs designed to improve solubility. By characterizing of physicochemical and metabolic properties of 21 marketed prodrugs and their active metabolites, the purpose of this study is to establish an in vitro system for selection of candidate prodrugs and appropriate experimental animals.
In Chapter 2, the utility of the strategy established in Chapter 1 was evaluated by using oseltamivir and 23 oseltamivir analogues, since the used model compounds in Chapter 1 were from clinically used prodrugs (with different structures), and they should meet the criteria for desirable prodrugs. Oseltamivir analogues having various types of side chain were designed as model compounds to have higher log D values than oseltamivir acid, an active metabolite.
The physicochemical/biopharmaceutical properties (log D, solubility, and membrane permeability) and metabolic stabilities of these analogues were characterized.
3
CHAPTER 1
Establishment of systematic approach for selection of prodrugs based on physicochemical/biopharmaceutical properties
and metabolic profiles of marketed prodrugs
SUMMARY
To establish a systematic in vitro method to appropriately select candidate prodrugs, physicochemical/biopharmaceutical properties of 21 commercially available prodrugs (16 prodrugs with improved membrane permeability of pharmacologically active metabolites and 5 prodrugs with improved solubility) and their active metabolites were characterized in terms of solubility in artificial intestinal fluids and membrane permeability using Caco-2 cells. Their in vitro metabolic profiles were also evaluated, using human and animal enterocytes,
hepatocytes, and sera. Log D values of prodrugs with improved membrane permeability were higher than those of their active metabolites, whereas those of prodrugs with improved aqueous solubility were lower than those of active metabolites. The prodrugs with improved aqueous solubility were highly soluble in artificial intestinal fluids. All prodrugs were
efficiently converted to active metabolites by human matrices, whereas some were not by dog or monkey matrices. This study demonstrated that physicochemical/biopharmaceutical
properties could be useful information to facilitate the designing of prodrugs and for selection of candidate prodrugs. Moreover, the in vitro evaluation of conversion efficiency to active metabolites would be helpful for selecting ideal prodrugs as well as appropriate animals for in vivo PK studies.
INTRODUCTION
Duration and cost required for drug development tend to increase year by year, and the
4
success rate in development of drugs tends to decrease. For the development of effective and safe drugs, it is required to establish an efficient systematic strategy. Development of prodrug is one of the useful strategies for overcoming various defects of compounds such as low bioavailability, short duration of action, and toxicity (Rautio et al., 2008; Huttunen et al., 2011; Akhani et al., 2017). In fact, approximately 10% of marketed drugs are prodrugs (Rautio et al., 2018).
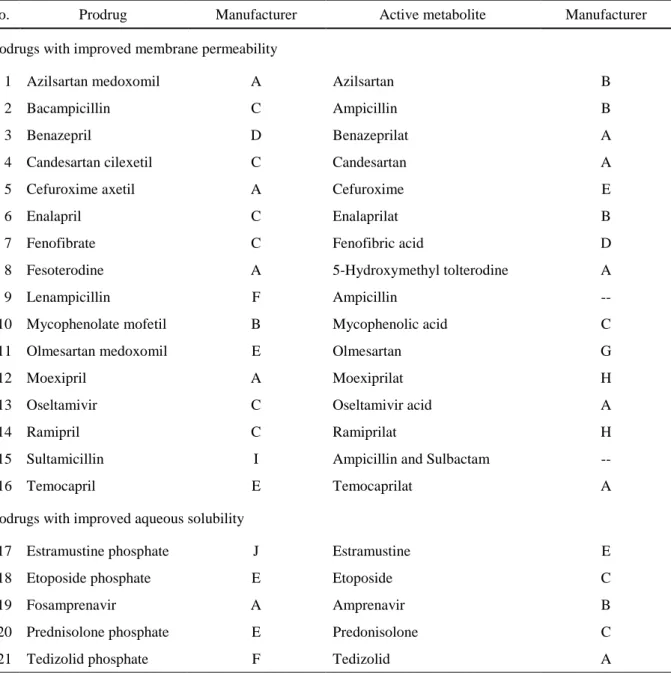
In this chapter, to establish a systematic strategy for selecting efficient candidate prodrugs, the physicochemical/biopharmaceutical properties and metabolic profiles of 21 marketed prodrugs and their active compounds were characterized. The used model prodrugs were azilsartan medoxomil, bacampicillin, benazepril, candesartan cilexetil, cefuroxime axetil, enalapril, fenofibrate, fesoterodine, lenampicillin, mycophenolate mofetil, olmesartan
medoxomil, moexipril, oseltamivir, ramipril, sultamicillin, and temocapril, that had been designed to improve membrane permeability of their pharmacologically active compounds, as well as estramustine phosphate, etoposide phosphate, fosamprenavir, prednisolone phosphate, and tedizolid phosphate, that had been designed to improve solubility of their
pharmacologically active compounds.
EXPERIMENTAL PROCEDURES
Chemicals and reagents
Twenty-one marketed prodrugs and their pharmacologically active metabolites were purchased from suppliers shown in Table 1. Japanese pharmacopoeia 1st fluid (JP1) and Japanese pharmacopoeia 2nd fluid (JP2), which are simulated gastric and intestinal fluids, respectively, were purchased from Kanto Chemical Co., Inc., (Tokyo, Japan). The
compositions of the buffers are shown in Table 2. Phosphate-buffered saline (PBS) was purchased from Thermo Fisher Scientific Inc. (Waltham, MA). Reagent mixture for simulated intestinal fluid mix was purchased from Celeste (Tokyo, Japan). Bis-p-nitrophenyl phosphate (BNPP) and bovine serum albumin (BSA) were purchased from Sigma-Aldrich Co. LLC.
5
(St. Louis, MO). All other chemicals were of analytical or the highest quality commercially available. Tissue S9 fractions, cryopreserved enterocytes, cryopreserved hepatocytes, and sera from four species (human, rat, monkey, and dog) shown in Table 3 were purchased from
Table 1. Compounds used in this study.
No. Prodrug Manufacturer Active metabolite Manufacturer
Prodrugs with improved membrane permeability
1 Azilsartan medoxomil A Azilsartan B
2 Bacampicillin C Ampicillin B
3 Benazepril D Benazeprilat A
4 Candesartan cilexetil C Candesartan A
5 Cefuroxime axetil A Cefuroxime E
6 Enalapril C Enalaprilat B
7 Fenofibrate C Fenofibric acid D
8 Fesoterodine A 5-Hydroxymethyl tolterodine A
9 Lenampicillin F Ampicillin --
10 Mycophenolate mofetil B Mycophenolic acid C
11 Olmesartan medoxomil E Olmesartan G
12 Moexipril A Moexiprilat H
13 Oseltamivir C Oseltamivir acid A
14 Ramipril C Ramiprilat H
15 Sultamicillin I Ampicillin and Sulbactam --
16 Temocapril E Temocaprilat A
Prodrugs with improved aqueous solubility
17 Estramustine phosphate J Estramustine E
18 Etoposide phosphate E Etoposide C
19 Fosamprenavir A Amprenavir B
20 Prednisolone phosphate E Predonisolone C
21 Tedizolid phosphate F Tedizolid A
--: Duplication or notapplicable
A: Toronto Research Chemicals (Toronto, Canada), B: Sigma-AldrichCo. LLC. (St. Louis, MO), C: FUJIFILM Wako Pure Chemical Corporation (Osaka, Japan), D: Combi-Blocks Inc. (San Diego, CA), E: LKT Laboratories, Inc. (St Paul, MN), F: Haoyuan Chemexpress Co., Ltd (Shanghai, China), G: Tocris Bioscience (Bristol, UK), H: Santa Cruz Biotechnology, Inc. (Dallas, TX), I: AK Scientific, Inc. (Union City, CA), J: MedChemExpress LLC (Princeton, NJ)
6
Sekisui XenoTech, LLC (Kansas City, KS), In Vitro ADMET Laboratories, Inc. (Columbia, MD), BioIVT (Westbury, NY), and Biopredic International (Rennes, France), respectively.
Determination of log D and solubility of prodrugs and their active metabolites in various buffers
Log D values of the 21 prodrugs and their active metabolites were determined basedon the retention time in reversed-phase high-performance liquid chromatography using 7
standard compounds, butyl 4-hydroxybenzoate, ethyl 4-hydroxybenzoate, heptyl paraben, methyl 4-hydroxybenzoate, phenol, propyl 4-hydroxybenzoate, and uracil, as reported previously (Valkó et al., 1997; Du et al., 1998). Solubility of compounds was determined according to methods reported previously with slight modifications (Roy et al., 2001; Alenz and Kansy, 2007). Briefly, each compound was dissolved in DMSO at 10 mM, asa stock solution. Ten µL of the stock solution in 96-well plates were evaporated, and 200 µL of JP1, JP2, fasted-state simulated intestinal fluid (FaSSIF), fed-state simulated intestinal fluid (FeSSIF), or 990 µL of PBS was added and rigorously mixed. The mixtures were centrifuged (5000 rpm, 15°C, 5 min), and the supernatants were subjected to LC/MS (Quatro Premier XE, Waters Corporation, Milford, MA) on a system equipped with an Acquity UPLC BEH C18 column (1.7 µm particle size, 2.1 × 50 mm; Waters Corporation). The mobile phase consisted of (A) 20 mM ammonium acetate/5% acetonitrile and (B) 10 mM ammonium acetate/95%
Table 2. Composition of JP1, JP2, FaSSIF, FeSSIF, and PBS.
JP1 JP2 FaSSIF FeSSIF PBS
pH 1.2 6.8 6.5 5.0 7.0 - 7.3
NaCl (mM) 34.2 -- -- -- 136.9
HCl (mM) 82.3 -- -- -- --
KH2PO4 (mM) -- 12.5 028.7 -- 001.5
Na2HPO4 (mM) -- 12.7 -- -- 015.5
Taurocholate (mM) -- -- 003.0 015.0 --
Lecithin (mM) -- -- 000.75 003.75 --
Acetic acid (mM) -- -- -- 144.0 --
KCl (mM) -- -- 103.3 203.9 002.7
7 Table 3. Donor information of various matrices.
Species Strain, breed, or race Sex (animals or individuals) Age Lot No.
Human
Small intestine S9 fractions AA (2) and C (4) Pool of 3 M and 3 F 15 – 66 years 1410064 Liver S9 fractions AA (9), A (3), C (172), and H (16) Pool of 100 M and 100 F 11 - 83 years 0910256
Cryopreserved enterocytes C 1 F 44 years HE3009
Cryopreserved hepatocytes C (17), H (2), and O (1) Pool of 10 M and 10 F 3 Days – 80 years UYG
Serum Not available Pool of 13 M and 13 F 27 - 68 years SER019A050C001
Rat
Small intestine S9 fractions Sprague-Dawley Pool of 200 M ~ 8 weeks 1410151
Liver S9 fractions Sprague-Dawley Pool of 207 M ~ 7 weeks 0610331
Cryopreserved enterocytes Sprague-Dawley Pool of 6 M 8 - 12 weeks RSE3023
Cryopreserved hepatocytes Sprague-Dawley Pool of 30 M 10-11 weeks MSO
Serum Sprague-Dawley Pool of 70 M and 35 F 10 – 19 weeks 5H1552
Cynomolgus monkey
Small intestine S9 fractions -- 1 M 3 years 0710573
Liver S9 fractions -- Pool of 4 M 5 – 6 years 0210315
Cryopreserved enterocytes -- 1 M 27 months PCE3012
Cryopreserved hepatocytes -- Pool of 3 M 8 - 13 years HEL
Serum -- Pool of 21 M and 13 F 20 months – 74 months 5K2003
Dog
Small intestine S9 fractions Beagle Pool of 3 M > 6 months 1410280
Liver S9 fractions Beagle Pool of 8 M 0.5 – 3 years 0810316
Cryopreserved enterocytes Beagle 1 M 3 – 4 months DBE3026
Cryopreserved hepatocytes Beagle Pool of 3 M 6 months SCD
Serum Beagle Pool of 10 M and 5 F 3 – 6 years 6G1423
AA: African American, C: Caucasian, A: Asian, H: Hispanic, O: Oriental, M: male, F: female, (): Number of donors.
--: Not applicable.
8
acetonitrile. The flow rate was 0.8 mL/min, and the gradient conditions for elution were as follows: gradient [min, B%] = [0, 0] - [1.0, 100] - [1.5, 100] - [1.7, 0]. Mass spectrometric conditions for individual analytes are shown in Table 4.
Membrane permeability of prodrugs and their active metabolites
Membrane permeability of the 21 marketed prodrugs and their active metabolites was determined using Caco-2 cells monolayers according to a method previously reported (Imai et al., 2005; Ohura et al., 2010) in the absence or presence of BNPP, a general inhibitor of serine hydrolases (Oda et al., 2015). Membrane permeability of propranolol was also evaluated as a marker compound with high permeability. Transport buffer in apical side was Hanks’
balanced salt solution (HBSS) containing 25 mM D-(+)-glucose and 20 mM 2-(N-morpholino) ethanesulfonic acid (pH 6.5), whereas that in basolateral side was HBSS containing 25 mM
D-(+)-glucose, 25 mM 4-(2-hydoxyethyl)-1-piperazineethanesulfonic acid, and 4.5% BSA (pH 7.4). BNPPdissolved in the transport buffer (pH 6.5) was added to both apical and basolateral sides at a final concentration of 200 µM. After 20 min of incubation, prodrugs or their active metabolites were added to the apical side at 25 µM, and incubated at 37˚C for 2 h.
Thecompounds transported to basolateral side were measured using an LC-MS/MS system (Xevo TQS, Waters Corporation) equipped with an Acquity UPLC BEH C18 column (1.7 µm particle size, 2.1 × 50 mm; Waters Corporation). The mobile phase consisted of (A) 0.1%
formic acid and (B) 0.1% formic acid/acetonitrile. The flow rate was 1.0 mL/min, andthe gradient condition was as follows: gradient [min, B%] = [0, 2] - [0.2, 2] - [0.4, 98] - [1.0, 2].
Mass spectrometric conditions for individual analytes are shown in Table 4. Whenprodrugs were added to the apical side, the concentrations of their active metabolites inbasolateral side
9 Table 4. LC-MS/MS or LC-MS conditions for compounds.
No. Prodrug Electrospray
ionization m/z Collision
energy Active metabolite Electrospray
ionization m/z Collision
energy Prodrug with improved membrane permeability
1 Azilsartan medoxomil Positive 569.15 > 233.15 40 Azilsartan Positive 457.17 > 233.13 30
2 Bacampicillin Positive 466.08 > 276.09 10 Ampicillin Positive 350.10 > 105.98 20
3 Benazepril Positive 425.19 > 351.11 20 Benazeprilat Positive 397.20 > 351.09 20
4 Candesartan cilexetil Positive 611.23 > 423.01 10 Candesartan Positive 441.15 > 263.13 10
5 Cefuroxime axetil Positive 511.13 > 458.94 10 Cefuroxime Positive 425.07 > 270.97 20
6 Enalapril Positive 377.21 > 117.02 40 Enalaprilat Positive 349.16 > 116.97 30
7 Fenofibrate Positive 361.07 > 138.93 30 Fenofibric acid Positive 319.01 > 233.05 20
8 Fesoterodine Positive 412.07 > 222.97 40 5-Hydroxymethyl tolterodine Positive 342.14 > 223.11 30
9 Lenampicillin Positive 462.15 > 160.05 20 Ampicillin Positive 350.10 > 105.98 20
10 Mycophenolate mofetil Positive 434.02 > 114.02 40 Mycophenolic acid Positive 321.02 > 207.10 20
11 Olmesartan medoxomil Positive 559.32 > 207.09 30 Olmesartan Positive 447.18 > 207.08 30
12 Moexipril Positive 499.29 > 234.15 20 Moexiprilat Positive 471.23 > 206.12 20
13 Oseltamivir Positive 313.65 > 166.07 20 Oseltamivir acid Positive 285.11 > 197.08 10
14 Ramipril Positive 417.23 > 117.01 40 Ramiprilat Positive 389.10 > 206.14 20
15 Sultamicillin Positive 595.14 > 113.97 40 Ampicillin Positive 350.10 > 105.98 20
16 Temocapril Positive 477.00 > 270.04 20 Temocaprilat Positive 449.07 > 270.03 20
Prodrug with improved aqueous solubility
17 Estramustine phosphate Negative 518.13 -- Estramustine Positive 440.18 --
18 Etoposide phosphate Positive 669.16 -- Etoposide Positive 589.19 --
19 Fosamprenavir Positive 586.20 -- Amprenavir Positive 506.23 --
20 Prednisolone phosphate Negative 441.17 -- Predonisolone Positive 361.20 --
21 Tedizolid phosphate Positive 451.09 -- Tedizolid Positive 371.13 --
--: Not applicable
10
were also measured, because prodrugs can possibly decompose spontaneously or be
hydrolyzed in Caco-2 cells or by added BSA. Apparent permeability coefficients (Papp) were calculated as follows:
Q (nmol) = Measured concentration (nmol/L) × volume of basolateral side (0.001 L) Papp (cm/s) = (dQ/dt) / (A × C0)
where dQ/dt is apparent transport rate (nmol/s), “t” represents the incubation time (7200 s),
“A” represents the membrane surface area (0.3 cm2/well), and “C0” represents the nominal concentration before incubation (25 µM). Papp values of prodrugs (Papp_PD total) were the sum of Papp values of prodrugs themselves (Papp_PD) and Papp values of the active metabolites (Papp_PD>AM) produced, which were calculated using Q values of active metabolite and C0
value of nominal concentration of prodrug before incubation. As for the evaluation of permeability of active metabolites, Papp values (Papp_AM) were calculated based on the concentration of each active metabolite in basolateral side.
Evaluation of metabolic stability of prodrugs and their active metabolites
To determine the stability of the prodrugs, the conversion of prodrugs to active metabolites was evaluated using small intestine and liver S9 fractions, cryopreserved enterocytes, cryopreserved hepatocytes, and sera from humans and experimental animals.
Prodrugs were dissolved in acetonitrile/DMSO (95:5, v/v) at 500 µM, and were added to the reaction mixture to be a final concentration of 5 µM. The stabilities of prodrugs in small intestine and liver S9 fractions and in sera were determined as follows: a typical incubation mixture (final volume: 0.2 mL) contained 100 mM potassium phosphate buffer (pH 7.4), a nicotinamide adenine dinucleotide phosphate (NADPH)-generating system, and enzyme sources [10% (serum) or 0.2 mg/mL (S9 fractions)]. The mixture was incubated for 0, 5, and 30 min at 37°C. The reactions were terminated by the addition of 200 µL of acetonitrile. The stabilities of prodrugs in enterocytes and hepatocytes were determined as follows: a typical
11
incubation mixture (final volume of 0.1 mL) contained Williams’ E Medium (pH 7.4) and enterocytes or HBSS (pH 7.4, in the presence or absence of 10% serum from each species) and hepatocytes. The mixture (cell density: 0.2 × 10⁶ cells/mL) was incubated for 0, 10, 60, and 120 min at 37°C in a CO2 incubator. The reactions were terminated by the addition of 100 µL of acetonitrile. The mixtures were centrifuged at 3000 rpm, 15°C for 20 min to collect the supernatants. The concentrations of prodrugs or their active metabolites in the sample were measured.
Next, the metabolic instability of active metabolites was examined using small intestine and liver S9 fractions, cryopreserved enterocytes, cryopreserved hepatocytes, and sera from humans and experimental animals. A typical incubation mixture was the same as those for prodrugs except for the cell density of enterocytes and hepatocytes at 0.5 × 10⁶ cells/mL. The mixtures containing small intestine and liver S9 fractions or serum were incubated for 0, 10, and 60 min at 37°C. The mixtures containing enterocytes or hepatocytes were incubated for 0, 60, 120, and 240 min at 37°C in a CO2 incubator. Subsequent experimental procedures were similar to those for the prodrugs.
The concentrations of prodrugs or active metabolites in the samples were measured using an LC/MS system equipped with SQ detector or TQ detector (Waters Corporation), and an Acquity UPLC BEH C18 column (1.7 µm particle size, 2.1 × 50 mm; Waters Corporation).
The mobile phase consisted of (A) 0.1% formic acid and (B) 0.1% formic acid/ acetonitrile.
The flow rate was 0.5 mL/min, and the gradient conditions for elution were as follows:
gradient [min, B%] = [0, 2] - [1.8, 98] - [2.5, 2] - [2.8, 2].
In vitro metabolic stabilities of prodrugs or their active metabolites were evaluated by calculating the remaining amounts after the incubation. Half-life and intrinsic clearance (CLint) were calculated using the following equations, as reported previously (Obach et al., 1997):
12
CLint = 0.693 × [1 / t1/2 (min)]
× [1/ concentration of matrix (mg/mL or 106 cells/mL)]
× [scale-up factor (mg/g or 106 cells/g)]
× [tissue weight (g) / body weight (kg)]
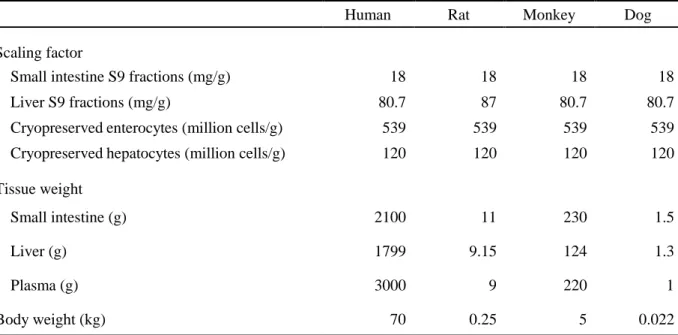
The in vitro CLint in cryopreserved enterocytes, cryopreserved hepatocytes, small intestine and liver S9 fractions, and sera from humans and experimental animals was scaled to the in vivo CLint using scaling factors shown in Table 5.
Calculation of conversion ratio (CR) and conversion score (CS)
To estimate the contribution of hydrolysis to overall metabolism of the prodrugs, two novel parameters were set. The ratio of the amount of active metabolite to amount of all metabolites after an in vitro metabolic instability using each matrix was defined as conversion ratio (CR), as follows:
Table 5. Physiological constants and scaling factors in human and animals.
Human Rat Monkey Dog
Scaling factor
Small intestine S9 fractions (mg/g) 18 18 18 18
Liver S9 fractions (mg/g) 80.7 87 80.7 80.7
Cryopreservedenterocytes (million cells/g) 539 539 539 539
Cryopreservedhepatocytes (million cells/g) 120 120 120 120
Tissue weight
Small intestine (g) 2100 11 230 1.5
Liver (g) 1799 9.15 124 1.3
Plasma (g) 3000 9 220 1
Body weight (kg) 70 0.25 5 0.022
The values of scaling factors except for liver S9 fractions in rat were assumed to be similar to humans and the same values were used. Scaling factors of small intestine and liver S9 fractions were assumed to be similar to cytosol fractions (Strikwold et al., 2013). Since there was no report about scaling factor of cryopreserved enterocytes, it was set on the assumption that the area of the small intestine was 200 m2 and the cell size was 15 µm. Scaling factor of cryopreserved hepatocytes was reported in Bayliss et al (1999).
13
CR = [Formation of active metabolite (%)] / {100 – [Remaining prodrug (%)]}
CRsmall intestine, CRliver, or CRserum represent the rate of conversion in each tissue. The sum of CLint,small intestine, CLint,liver, and CLint,serum was defined as CLint,total, representing the intrinsic clearance in body. To estimate the conversion efficacy in each tissue, conversion score (CS) was defined. CSsmall intestine, CSliver, or CSserum represent the ratio of the intrinsic clearance of prodrug that was converted to active metabolite in each tissue to the that in body, and was calculated using the following equations:
CSsmall intestine = CRsmall intestine × CLint,small intestine / CLint,total
CSliver = CRliver × CLint,liver / CLint,total
CSserum = CRserum × CLint,serum / CLint,total
The sum of CSsmall intestine, CSliver, and CSserum was defined as CStotal, and CStotal should ideally be 1.0, if prodrugs were efficiently converted to active metabolites in human body.
RESULTS
Log D values of prodrugs and their active metabolites
Twenty-one prodrugs (Table 1), which had been developed for improved oral absorption of pharmacologically active metabolites, were classified into two types: (1) 16 prodrugs designed to improve membrane permeability of pharmacologically active
metabolites and (2) 5 prodrugs designed to improve solubility. To clarify physicochemical properties of prodrugs and their active metabolites, their log D values were determined.
Figure 1 shows the relationship between the log D values of prodrugs and those of their active metabolites. For the 16 prodrugs with improved membrane permeability, the log D values were 1.7 to 4.2 times higher than those of their active metabolites. On the other hand, for the 5 prodrugs with improved aqueous solubility, the log D values were 0.4 to 0.6 times less than
14
those of their active metabolites. Thus, it was demonstrated that the lipophilicity of the prodrugs had been changed from that of their active metabolites in accordance with the intention of their design.
Fig. 1. Relationship between log D values of prodrugs and those of their active metabolites.
Open circles represent 16 prodrugs with improved membrane permeability and closed circles represent 5 prodrugs with improved aqueous solubility. The numbers of compounds are shown in Table 1.
Solubility of prodrugs and their active metabolites in artificial intestinal fluids
To further investigate physicochemical properties of the 21 prodrugs and their active metabolites, the solubility of each in JP1, JP2, FaSSIF, FeSSIF, or PBS was determined (Table 6). Among 16 prodrugs with improved membrane permeability, the solubilities of ampicillin, enalapril, and fenofibrate could not be evaluated, because these compounds disappeared in the process of evaporation for some reasons. Also, thesolubility of
sultamicillin could not be evaluated, because it was unstable in JP2, FaSSIF, and PBS. In JP1, benazepril and mycophenolate mofetil showed higher solubility than that of theiractive metabolite (Fig. 2). In JP2, azilsartan medoxomil, candesartan cilexetil, and mycophenolate mofetil showed lower solubility than that of their active metabolite. Theresults might be related to their higher lipophilicity than their active metabolites. Similarphenomena were
15 Table 6. Solubilities (%) of prodrug with improved membrane permeability or aqueous solubility.
Prodrug
JP1 JP2 FaSSIF
(%) FeSSIF PBS
Prodrug Active
metabolite Prodrug Active
metabolite Prodrug Active
metabolite Prodrug Active
metabolite Prodrug Active metabolite Prodrug with improved membrane permeability
Azilsartan medoxomil 3 2 8 100 13 100 15 100 72 100
Bacampicillin 93 N.E. 70 N.E. 83 N.E. 98 N.E. 100 N.E.
Benazepril 100 37 100 100 100 100 100 100 100 100
Candesartan cilexetil 0 5 2 92 46 92 63 88 81 100
Cefuroxime axetil 94 53 89 99 95 95 98 100 100 81
Enalapril N.E. 50 N.E. 100 N.E. 100 N.E. 100 N.E. 100
Fenofibrate N.E. 0 N.E. 100 N.E. 100 N.E. 98 100 100
Fesoterodine 100 100 99 100 96 100 96 97 100 100
Lenampicillin 100 N.E. 84 N.E. 94 N.E. 100 N.E. 100 N.E.
Mycophenolate mofetil 98 17 32 98 91 96 98 93 93 100
Olmesartan medoxomil 96 100 92 99 95 100 92 96 100 100
Moexipril 97 100 100 100 98 100 98 100 100 100
Oseltamivir 97 100 100 99 89 96 95 98 100 100
Ramipril 100 100 100 100 100 99 100 100 100 95
Sultamicillin 80 N.E. N.E. N.E. N.E. N.E. 56 N.E. N.E. N.E.
Temocapril 100 100 100 100 100 100 100 100 100 100
Prodrug with improved aqueous solubility
Estramustine phosphate 1 1 100 1 100 52 100 44 97 3
Etoposide phosphate 92 92 100 100 100 100 100 100 100 96
Fosamprenavir 100 100 100 72 100 88 97 98 90 86
Prednisolone phosphate 100 100 100 99 100 100 100 100 100 100
Tedizolid phosphate 3 16 100 3 100 5 100 13 100 45
N.E.: Not evaluated. Since ampicillin, enalapril, and fenofibrate are volatile, their solubilities could not be evaluated. In addition, because sultamaicillin was unstable in JP2, FaSSIF, and PBS, data were not obtained.
16
observed in FaSSIF (azilsartan medoxomil and candesartan cilexetil), FeSSIF (azilsartan medoxomil and candesartan cilexetil), and PBS (azilsartan medoxomil). The other tested prodrugs and their active metabolites showed solubility of over 80%. In the 5 prodrugs with improved aqueous solubility, estramustine phosphate and tedizolid phosphate showed lower solubility in JP1 than that of their active metabolite, although they showed higher solubility in the other buffers. Thus, it was revealed that the solubility of these prodrugs was improved further than that of their active metabolites. The artificial intestinal fluid would be suitable to evaluate whether the solubility of candidate prodrugs is improved compared with their active metabolites.
Fig. 2. Solubility of prodrugs and their active metabolites in JP1, JP2, FaSSIF, FeSSIF, and PBS. Open circles represent 16 prodrugs with improved membrane permeability and their active metabolites. Closed circles represent 5 prodrugs with improved aqueous solubility and their active metabolites.
Membrane permeability of prodrugs
To evaluate whether the membrane permeability of each of the prodrugs with improved membrane permeability is higher than that of their active metabolites, apparent permeability
17
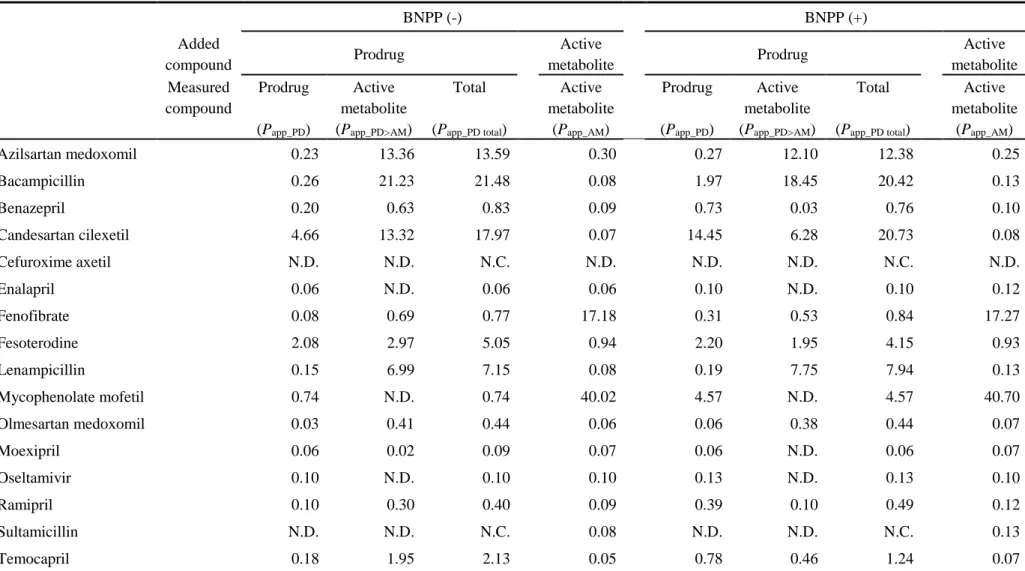
coefficients (Papp) of the prodrugs and their active metabolites were evaluated using Caco-2 cells (Table 7). The Papp values of cefuroxime axetil, sultamicillin, and cefuroxime could not be calculated, because these compounds were not detected in basolateral side. Of the tested 16 prodrugs, 9 showed higher (more than four times) Papp_PD total values than Papp_AM values, although the Papp_PD total values of enalapril, moexipril, and oseltamivir were almost equal with Papp_AM values, and Papp_PD total values of fenofibrate and mycophenolate mofetil were more than 20 times lower than their Papp_AM values. Moreover, 10 out of 16 prodrugs showed higher Papp_PD>AM values than their Papp_PD values, suggesting that these compounds would be
efficiently hydrolyzed to their active metabolites in Caco-2 cells or transport buffer in apical side, because carboxylesterase 1 (CES1) catalyzing hydrolysis of various drugs is highly expressed in Caco-2 cells, although it is not expressed in human erythrocytes (Imai et al., 2005). To exclude the factor of the CES1-mediated hydrolysis in Caco-2 cells, a general serine esterase inhibitor BNPP was added. If the active metabolite formed in the cells is transported across the membrane by simple diffusion, it would be equally transported into apical and basolateral sides and taken up again into the cells by the pH-partition hypothesis.
Basic compounds are preferentially transferred into apical side (lower pH), whereas acidic compounds are more likely transferred into basolateral side (higher pH). It was expected that Papp_PD total and Papp_PD values would be increased by the addition of BNPP, if intercellular hydrolysis is decreased, and the amount of active metabolite transferred to the basolateral side is decreased, in the case of neutral or acidic compounds. As shown in Table 4, by the addition of BNPP, the Papp_PD>AM values of benazepril, ramipril, and temocapril were decreased by over one third, and their Papp_PD values were increased by 3-fold. However, their Papp_PD total
values were not largely changed. The Papp_PD>AM values of the other tested prodrugs were not substantially decreased by the addition of BNPP, although the conditions used for BNPP (200 µM) have been reported to sufficiently inhibit hydrolase activity (86% inhibition for in cellulo O-butyryl-propranolol hydrolysis) (Ohura et al., 2010). Thus, these prodrugs may have been hydrolyzed by an enzyme(s) that is not inhibited by BNPP, or the hydrolysis reaction might have proceeded during the 2 h incubation by the partially remaining active enzyme.
18
Table 7. Papp (× 10-6 cm/s) values of prodrugs with improved membrane permeability and their active metabolites.
BNPP (-) BNPP (+)
Added
compound Prodrug Active
metabolite Prodrug Active
metabolite Measured
compound
Prodrug (Papp_PD)
Active metabolite (Papp_PD>AM)
Total (Papp_PD total)
Active metabolite
(Papp_AM)
Prodrug (Papp_PD)
Active metabolite (Papp_PD>AM)
Total (Papp_PD total)
Active metabolite
(Papp_AM)
Azilsartan medoxomil 0.23 13.36 13.59 0.30 0.27 12.10 12.38 0.25
Bacampicillin 0.26 21.23 21.48 0.08 1.97 18.45 20.42 0.13
Benazepril 0.20 0.63 0.83 0.09 0.73 0.03 0.76 0.10
Candesartan cilexetil 4.66 13.32 17.97 0.07 14.45 6.28 20.73 0.08
Cefuroxime axetil N.D. N.D. N.C. N.D. N.D. N.D. N.C. N.D.
Enalapril 0.06 N.D. 0.06 0.06 0.10 N.D. 0.10 0.12
Fenofibrate 0.08 0.69 0.77 17.18 0.31 0.53 0.84 17.27
Fesoterodine 2.08 2.97 5.05 0.94 2.20 1.95 4.15 0.93
Lenampicillin 0.15 6.99 7.15 0.08 0.19 7.75 7.94 0.13
Mycophenolate mofetil 0.74 N.D. 0.74 40.02 4.57 N.D. 4.57 40.70
Olmesartan medoxomil 0.03 0.41 0.44 0.06 0.06 0.38 0.44 0.07
Moexipril 0.06 0.02 0.09 0.07 0.06 N.D. 0.06 0.07
Oseltamivir 0.10 N.D. 0.10 0.10 0.13 N.D. 0.13 0.10
Ramipril 0.10 0.30 0.40 0.09 0.39 0.10 0.49 0.12
Sultamicillin N.D. N.D. N.C. 0.08 N.D. N.D. N.C. 0.13
Temocapril 0.18 1.95 2.13 0.05 0.78 0.46 1.24 0.07
N.D.: Not detected, N.C.: Not calculated.
19
The Papp_PD total values of the prodrugs with improved membrane permeability had been expected to be substantially higher than the Papp_AM values, because test compounds were selected as “successful examples.” However, the Papp_PD total values of fenofibrate and mycophenolate mofetil were lower than their Papp_AM values. In addition, in both cases, with or without BNPP, total Papp_PD total values of benazepril, enalapril, fenofibrate,
mycophenolate mofetil, olmesartan medoxomil, moexipril, oseltamivir, and ramipril were much lower than that of Papp value (13.3 × 10⁻⁶ cm/s) of propranolol, which shows a high fraction of the dose was absorbed (Fa). Thus, it was demonstrated that the prodrugs with improved membrane permeability did not necessarily show Papp values that are higher than those of their active metabolites, and were close to the Papp values of propranolol when Caco-2 cells were used. Thus, Caco-2 cells may have some limitation for the evaluation of membrane permeability.
Stability of prodrugs in buffers or media
To examine the extent of non-enzymatic degradation of the prodrugs, their stabilities in potassium phosphate buffer, HBSS, and Williams’ E Medium were evaluated (Fig. 3).
Potassium phosphate buffer (incubation time: 30 min), HBSS (incubation time: 120 min), and Williams’ E Medium (incubation time: 120 min) were used for the reaction mixtures of serum and S9 fractions, cryopreserved hepatocytes, and cryopreserved enterocytes, respectively.
Azilsartan medoxomil, bacampicillin, cefuroxime axetil, lenampicillin, and olmesartan medoxomil were unstable in Williams’ E Medium (0.0 to 25.2%), whereas they were relatively stable in potassium phosphate buffer (73.5 to 98.7%) and HBSS (48.5 to 80.8%).
Fenofibrate was unstable in potassium phosphatebuffer (64.4%). Sultamicillin was extremely unstable in all buffers and media (0.0 to 4.9%). The other compounds were stable (over 80%) in all buffers and media. From these results, some marketed prodrugs might be
non-enzymatically degraded in in vitro studies and the unstable prodrugs are expected to be naturally hydrolyzed in the body.
20
Fig. 3. Stability of prodrugs in buffers or media. Tested prodrugs (5 µM) were incubated with potassium phosphate buffer (PPB), HBSS (HB), or Williams’ E Medium (WEM). Closed squares represent the percentages of remaining prodrugs.
Stability and metabolic efficiency of prodrugs by various human and animal matrices The metabolic stabilities of prodrugs and the formation rate of their active metabolites were determined using human small intestinal and liver S9 fractions, cryopreserved
enterocytes, cryopreserved hepatocytes in the presence or absence of human serum, or human serum (Fig. 4). Since there is a lag in the time from the addition of prodrugs to placement of samples into a CO2 incubator, the samples with cryopreserved enterocytes or hepatocytes at 0 min could contain active metabolites. Prodrugs that were hydrolyzed by all human matrices were azilsartan medoxomil, bacampicillin, cefuroxime axetil, fesoterodine, lenampicillin, mycophenolate mofetil, olmesartan medoxomil, and sultamicillin. As shown in Fig. 3,
bacampicillin was unstable in all buffers and media, but the enzymatic hydrolysis appeared to proceed, since the remaining percentages of bacampicillin with all human matrices were
21
Fig. 4. Stabilities of 21 tested prodrugs in human various matrices. Test prodrugs (5 µM) were incubated with human small intestine S9 fractions (IS9), liver S9 fractions (LS9), enterocytes (EC), hepatocytes in the absence (HC) or presence of serum (HC + S), or serum (S). Closed squares represent the remaining percentages of prodrugs and open squares represent the formation rate of their active metabolites.
22
smaller than that of spontaneous decomposition. A similar phenomenon was observed in cefuroxime axetil and lenampicillin. Fesoterodine and mycophenolate mofetil were
enzymatically hydrolyzed, because they were stable in potassium phosphate buffer, HBSS, and Williams’ E Medium. The remaining percentages of sultamicillin with all human matrices were similar to those in all buffers or media; therefore, sultamicillin seems to be
non-enzymatically degradated to a great extent. Benazepril, enalapril, fenofibrate, moexipril, oseltamivir, ramipril, and temocapril were hydrolyzed by human liver matrices, consistent with the fact that these prodrugs are hydrolyzed by CES1, which is abundantly expressed in human liver, not in intestine. Candesartan cilexetil and fenofibrate were hydrolyzed by human matrices except for serum. Ishizuka et al. (2013) have reported that candesartan cilexetil is hydrolyzed by hepatic CES1 rather than intestinal enzymes, including CES2, but this study showed that candesartan cilexetil was hydrolyzed in human small intestine S9 fractions as well as in human cryopreserved enterocytes, in which CES1 is not expressed. As for the 5 prodrugs with improved aqueous solubility, estramustine phosphate was slightly hydrolyzed by human cryopreserved hepatocytes in the absence of serum, and the other 4 prodrugs, etoposide phosphate, fosamprenavir, predonisolone phosphate, and tedizolid phosphate were hydrolyzed by human cryopreserved enterocytes and hepatocytes in the presence or absence of serum. Thus, these prodrugs containing phosphoester group were readily hydrolyzed in cellulo rather than by tissue S9 fractions. A plausible possibility for this difference might be that the enzyme(s) that are not localized in endoplasmic reticulum or cytosol, or enzymes(s) that require cofactors other than NADPH might be involved in their hydrolysis.
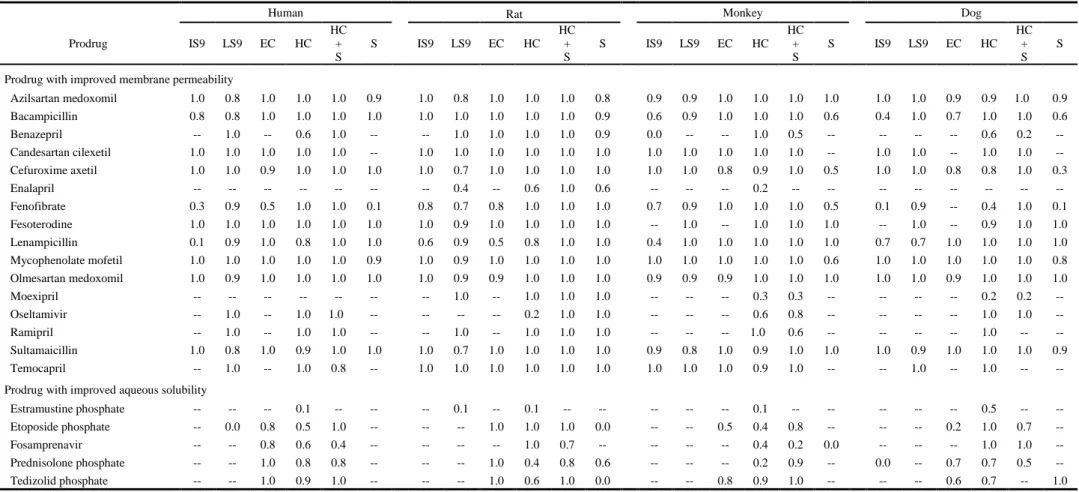
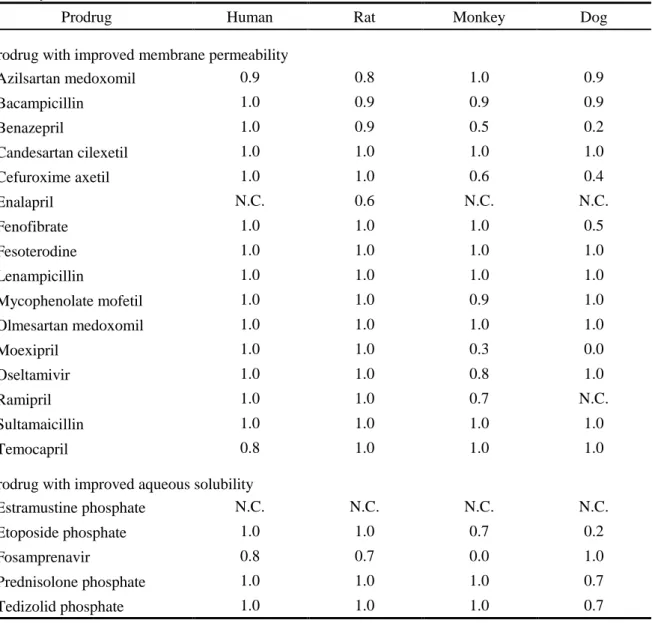
The metabolic stabilities of prodrugs and the formation rate of their active metabolites were also analyzed using matrices from rat, monkey, or dog. The conversion ratio (CR) values in human or animal tissues then were calculated (Table 8). If a prodrug is metabolized to only active metabolites, the CR value should be 1.0. The CR values of several compounds could not be calculated, because of high metabolic stability (over 90%). For most of the prodrugs, CR values in human matrices were over 0.7, indicating that the tested prodrugs are efficiently converted to active metabolites. The apparent clearance of active metabolite formation was