Asian and Pacific Coasts 2005 September 4-8, 2005, Jeju, Korea
STUDY ON MECHANISMS OF ENVIRONMENTAL CHANGE IN AN ARTIFICIAL TIDAL FLAT
Kentaro Morimoto
1, Kiyoshi Takikawa
2, Kenji Tanaka
3, Tatuya Masuda
4ABSTRACT: The Ariake Sea, a typical closed bay on the west coast of Kyushu Island, has suffered from several external impacts. However, the relative contribution of the various factors and processes is still unclear. In this study, field observations were conducted inside the artificial tidal flat to model the physical, chemical and ecological attributes of the tidal flat system for the preservation and recovery of the coastal environment in the Ariake Sea. The communities and environment within the artificial tidal flat pond became established within one year of the artificial pond being completed. Meteorological and tidal conditions were found to strongly affect the topography of the pond, particularly the region between the sub-tidal zone to the supra littoral zone, the development of which itself resulted in stabilization of the tidal flat habitat within the pond.
KEYWORDS: Artificial Tidal Flat, Field Observation, Environmental Change, Ecosystem 1. Introduction
The Ariake Sea, a typical closed bay on the west coast of Kyushu Island, is characterized as having a tidal range of approximately 6.0 m at spring tide. The tidal flats are extensive (207 km
2), occupying approximately 40% of the total area of Japan. This range in tidal and other environmental conditions has resulted in the establishment of considerable ecological heterogeneity and has also facilitated the establishment of a delicate environmental balance with the marine environment.
In recent years however, environmental deterioration in the Ariake Sea has occurred with increasing frequency. These events include the color-dulling damage for sea weed such as laver in the winter of 2000-2001 and massive red tide blooms. Consequently, the remediation the tidal environment system (ecosystem, the purification of the sea water and tidal bottom soil) has become necessary.
Factors contributing to environmental deterioration in the Ariake Sea have been widely
1
Researcher, Department of Civil and Environmental Engineering, Kumamoto University, Kurokami 2-39-1, Kumamoto, 860-8555, Japan. [email protected]
2
Professor, Center for Marine Environmental Study, Kumamoto University, Kurokami 2-39-1, Kumamoto, 860-8555, Japan. [email protected]
3
Research Associate, Department of Civil and Environmental Engineering, Kumamoto University, Kurokami 2-39-1, Kumamoto, 860-8555, Japan. [email protected]
4
Graduate, Department of Water Environment, Asia planning Co. Ltd.,
Toroku 7-15-27-101, Kumamoto, 862-0970, Japan. [email protected]
discussed by Japanese engineers and scientists (Nakata et al., 2002; Takikawa e.g., et al., 2003), and several environmental recovery programs have been proposed. However, the process of how to facilitate the development of a natural tidal flat system is still unclear. A prerequisite for acquiring the knowledge necessary to understand this system is an integrated approach using field surveys, the findings of which can then be used to develop and implement sustainable environmental recovery programs.
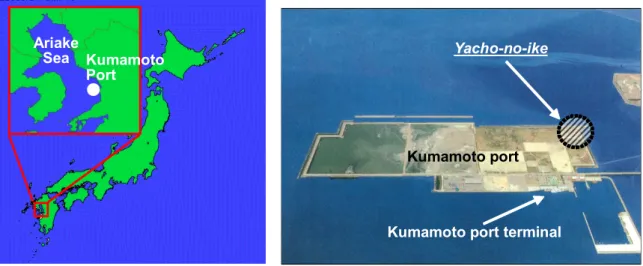
The Yacho-no-ike pond was constructed in October 2002 at the northeastern end of Kumamoto Port (Fig. 1) to promote the establishment of a tidal flat ecosystem inside the bay that was independent of artificial influence. Field observations of water and sediment physicochemical parameters, and biological characteristics have been conducted since construction of the pond was completed. The purpose of this study was to investigate whether construction of the pond has benefited tidal flat ecosystem integrity and resulted in the establishment of tidal flat communities within the pond. To achieve this aim, variation in environmental variables and the mass budget were investigated.
2. Field Observations in the Artificial Tidal Flat
2.1. The establishment of a tidal flat ecosystem within an artificial pond (Yacho-no-ike)
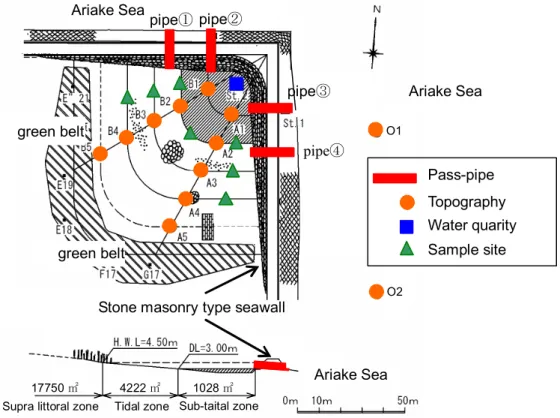
The Yacho-no-ike pond was constructed in October 2002 at the northeastern end of Kumamoto Port (Fig. 1). The pond was constructed in order to facilitate the establishment of a tidal flat ecosystem inside the port to avoid the need for artificial control. Figure 2 is a plan of Yacho-no- ike. The artificial pond is separated from the open sea by a stone masonry-type seawall. The artificial pond is a so-called ‘semi-open system’ with a muddy bottom and four pass-pipes (1.0 m in diameter) that connect the pond to the sea and facilitate the exchange water, nutrients and biota according to tidal fluctuations (Fig. 2). The gradient within the pond is approximately 1:36, which is steeper than that of the surrounding tidal flat (1:600). The soil particles are composed primarily of mud 70% (w/w). The total area of the pond is 23,000 m
2and the relative extent of the tidal flat zones inside the pond in 2002 was a sub-tidal zone of 1,028 m
2, an inter-tidal zone of 4,222 m
2, and a supra-littoral zone of 17,750 m
2. The sub-tidal zone remains underwater at low tide and is less than 1.0 m at its deepest (mean = 0.3 m).
Kumamoto port Yacho-no-ike
Kumamoto port terminal Ariake
Sea Kumamoto Port
●
Fig. 1 Location of study site (the artificial pond Y acho-no-ike in the Ariake Sea)
2.2. Observation methods
Topographical survey of the artificial pond was performed by setting up a longitudinal transect with paling from DL(Datum Line) +2.5 m in the tidal zone to DL +4.5 m of H.W.L at 10 points along transects A and B at 0.5 m intervals (Fig. 2). In addition, a soil compaction meter (Cone Penetrometer) was inserted into the ground at eight points (A2-A5, B2-B5) in the tidal zone to assess cone bearing capacity.
Sediment sampling was performed by obtaining mud cores of approximately 30 cm at 10 sites along the longitudinal profile of the pond and at 2 points in the outside pond (Fig. 2). Core samples were divided into four layers - surface layer (0 to -0.5 cm), upper layer (-9 to -11 cm), middle layer (-19 to -21 cm) and a lower layer (-29 to -31 cm) - each of which was analyzed for the following parameters: grain size distribution, water content, chemical oxygen demand (COD), ignition loss (IL), moisture content, total sulfide (T-S), oxidation-reduction potential (ORP) and hydrogen ion concentration index (pH).
The water quality investigation was done by two methods: one was by continuous in situ observations using multi parameter water quality meter (W-23XD, HORIBA, located St.1 and St.2) and the other was a detailed analysis of water samples in a laboratory off site. The following water physicochemical parameters were analyzed: chemical oxygen demand (COD), dissolved chemical oxygen demand (D-COD), total nitrogen (T-N), dissolved total nitrogen (D-T-N), NH
4- N, NO
2-N, NO
3-N, PO
4-P, chlorophyll-a (Chl-a), suspended solids (SS), pH, and dissolved
green belt green belt
1028㎡ 4222㎡
17750㎡
Supra littoral zone Tidal zone Sub-taital zone
Ariake Sea
Stone masonry type seawall pipe③
pipe④ pipe②
pipe①
Ariake Sea
Ariake Sea
O1
O2
Sample site Water quarity Pass-pipe Topography
Fig. 2 Sample sites and transects at “Yacho-no-ike”
oxygen (DO). The continuous measurements were taken at St.01 and St.02 shown in Fig.02.
Measurements at St.02 were taken at a depth of 10 cm below the surface and at a point 30 cm from the bottom.
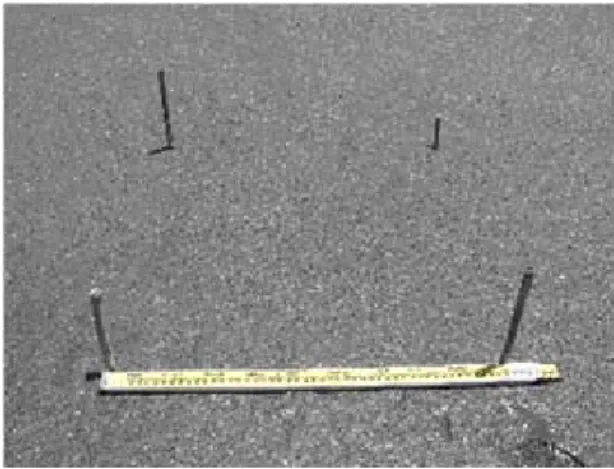
Biota was assessed quantitatively and qualitatively. The number of benthic and fish species was investigated using a nets and visual observations. Benthos was also sampled using a cuboid soil sampler (25 cm in width and 20 cm in depth) and the density of burrow entrances was investigated by counting the number of holes per m
2(Fig. 3).
3. Results and Considerations
3.1. Topography survey and bottom quality investigation
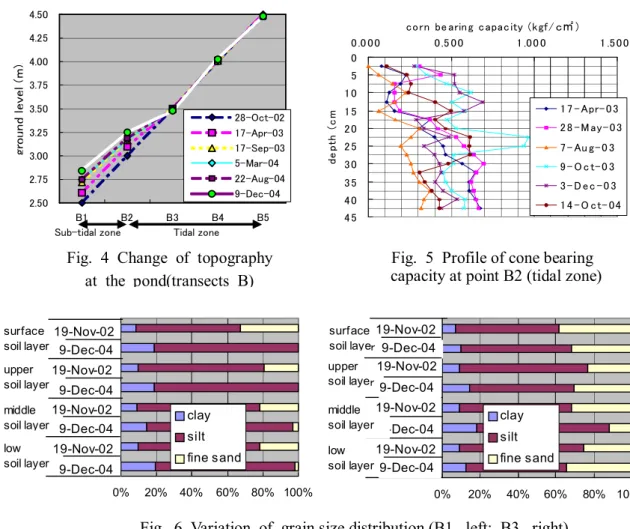
The rate of deposition in the sub-tidal zone of the artificial pond was 10 cm in the six months following construction, reaching 25 to 30 cm after approximately two years (Fig. 4). It is thought that this sediment was derived from SS from the open ocean and through erosion of the green belt to the south of the tidal flat by rainfall and wave action.
Cone bearing capacity showed that sediments became softer at almost all sample locations and layers during summer in response to activation of living thing and a change in the temperature of mud. Figure 5 shows an example of cone bearing capacity at site B2. At site B2, it can be thought that the increase in the number of entrance holes (described later) was found to contribute to the increased softness of the mud.
Figure 6 shows the distribution in grain size for samples taken on 19 Nov. 2002 and 9 Dec.
2004 at sites B1 (left panel) and B3 (right panel), respectively. The mass of mud and silt increased in all layers and the water content also increased at the sub-tidal zone at site B1 in the two years of sampling at the site. It was suggested that the present lower layer lay to the surface on 19 Nov. 2002, a lot of mud clay with small particle deposited because of erosion by rainfall and wave action at sub-tidal zone. At site B3, it increased slightly. That is, there was a continuous supply of silt to site B3 from supra littoral zone and tidal zone in spite of the soil on the surface a lost amount for sub-tidal zone.
Figure 7 shows the vertical profiles for specific water content, ignition loss, Chemical Oxygen
Fig. 3 Density of burrow entrances per m
2Demand (COD) and total sulfate content. Each of these parameters sampled at site O2 (outside pond) and along transect B (inside pond) is shown in the left and right panels of the figure, respectively. A marked increase in water content was observed in the sub-tidal zone of the pond in 2004 compared to 2003 (Fig. 7B). Interestingly, this increase was not observed at site O2 outside the pond (Fig. 7A). Ignition loss decreased in summer both inside and outside of the tidal flat pond. In both areas, IL tended to increase in winter. The amount of organisms is increased during summer when biomass production was high. This trend was observed at all sites in the pond.
Chemical Oxygen Demand (COD) levels exhibited a pattern similar to that of ignition loss (Fig.
7E and 7F). Given the preference among tidal flat biota for clay environments, the deposition of clay in the surface layer of the substrate is likely to have been responsible for the increase observed in COD. Moreover, compared with the outside pond, the sub-tidal zone inside the pond was characterized as having high values in COD in 2004, while in 2003 the outside pond was characterized as having higher values (Fig. 7E). It is thought that colonization of the environment by organisms could occur easily at this stage because the particle size of sediments was less than 0.05 mm.
Fig. 4 Change of topography at the pond(transects B)
Fig. 5 Profile of cone bearing capacity at point B2 (tidal zone)
0% 20% 40% 60% 80% 100%
1 2 3 4 5 6 7 8
clay silt fine sand 19-Nov-02
9-Dec-04 19-Nov-02 9-Dec-04 19-Nov-02
9-Dec-04 9-Dec-04 19-Nov-02 surface
soil layer upper soil layer middle soil layer low soil layer
0% 20% 40% 60% 80% 100%
1 2 3 4 5 6 7 8
clay silt fine sand 19-Nov-02
9-Dec-04 9-Dec-04 19-Nov-02 surface
soil layer upper soil layer middle soil layer low soil layer
19-Nov-02
19-Nov-02 9-Dec-04 9-Dec-04
Fig. 6 Variation of grain size distribution (B1, left; B3, right)
2.50 2.75 3.00 3.25 3.50 3.75 4.00 4.25 4.50
B1 B2 B3 B4 B5
28-Oct-02 17-Apr-03 17-Sep-03 5-Mar-04 22-Aug-04 9-Dec-04
ground level (m).
Sub-tidal zone Tidal zone
0 5 1 0 1 5 2 0 2 5 3 0 3 5 4 0 4 5
0 .0 0 0 0 .5 0 0 1 .0 0 0 1 .5 0 0
co rn be arin g c apac ity (kgf/ c㎡ )
depth (cm) 1 7 - Apr- 0 3
2 8 - M ay- 0 3 7 - Au g- 0 3 9 - O c t- 0 3 3 - D e c - 0 3 1 4 - O c t- 04
-40 -30 -20 -10 0
0 50 water content (%)100 150 200 250
depth (cm)
17-Jan-03 6-Aug-03 2-Dec-03
15-Oct-04 9-Dec-04
A outside 2
-40 -30 -20 -10 0
0 50 100 150 200 250
water content (%)
depth (%)
B inside B1
-40 -30 -20 -10 0
0 5 10
ignition loss (%)
depth (cm)
C outside 2
-40 -30 -20 -10 0
0 5 10
ignition loss (%)
depth (cm)
D inside B1
-40 -30 -20 -10 0
0 5 10 15 20
chmical oxygen demand (mg/l)
depth (cm)
E outside 2
-40 -30 -20 -10 0
0 5 10 15 20
chmical oxygen demand (mg/l)
depth (cm)
F
insitde B1
-40 -30 -20 -10 0
0.00 0.05 0.10 0.15 0.20
total sulfide (mg/gday)
depth (cm)
G
outside 2 -40
-30 -20 -10 0
0.00 0.05 0.10 0.15 0.20
total sulfide (mg/gday)
depth (cm)
H inside B1
Fig. 7 Vertical profile of sediment characteristics (site O2, left; site B1, right)
3.2. Water quality 3.2.1. Diurnal variation
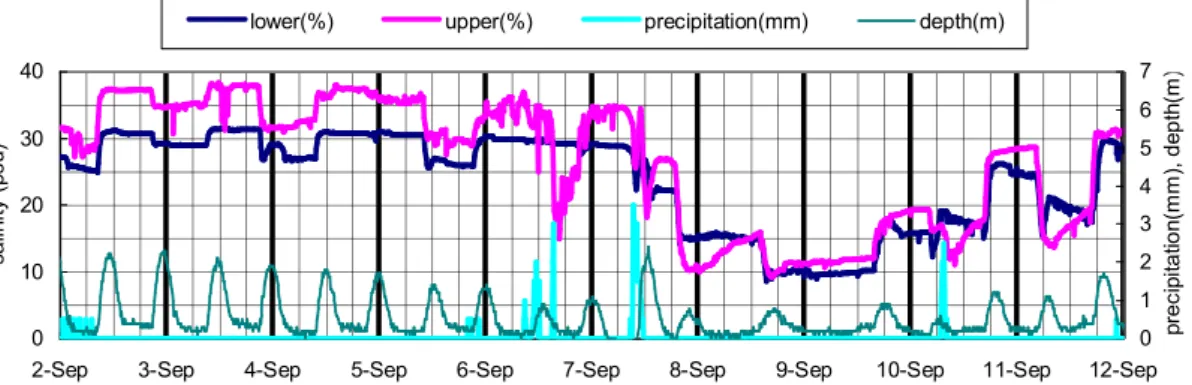
Figure 8 shows precipitation and salinity values at 10-minute intervals between 2
ndand 12
thSep.
2004. Tidal action at the surface mixes the fresh water from outside the pond and decreases the salinity of the surface water. Furthermore, given that the mouth of the Shira river is located approximately 1.5 km northeast from the pond, water with a low salinity sometimes enters the pond after precipitation events such as when Typhoon 0418 hit Kyushu on 7
thSep. 2004.
According to an automated weather station nearby, the minimum barometric pressure recorded during the year was 962.5 hPa, approximately 50 hPa lower than the fine weather in summer.
Maximum wind speeds of 46.9 m s
-1were recorded on 7
thSep. 2004. These conditions of low pressure and high wind speeds could account for the anomalous higher elevation. After the typhoon passed, the salinity inside the pond remained below 30psu.
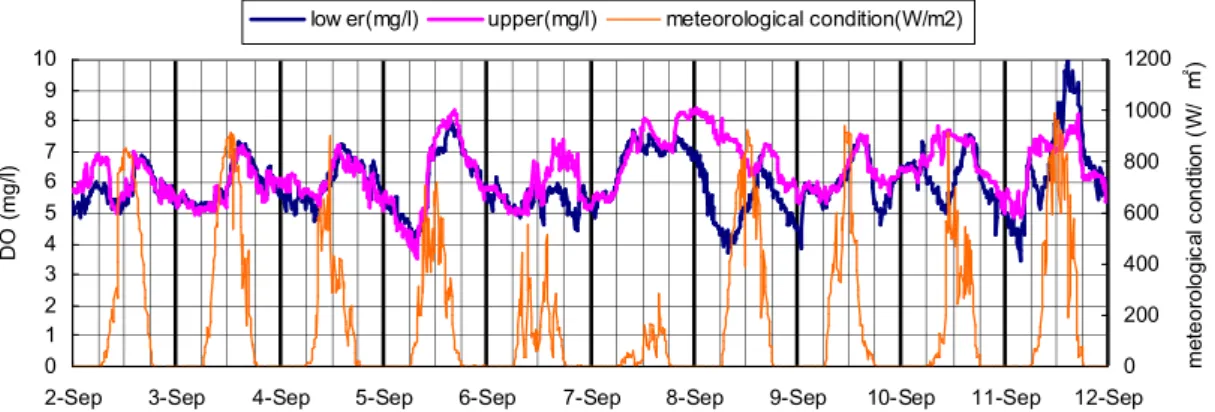
Figures 9 and 10 show the diurnal variation of pH, DO and incoming solar radiation flux density. The pH and DO both increased in the daytime in response to phytoplankton photosynthesis, while at night the production of O
2by phytoplankton stopped and the dissolved
Fig. 9 Change in precipitation, depth, and pH between 2 to 12 Sep., 2004 Fig. 8 Change in precipitation, depth and salinity between 2 to 12 Sep., 2004
7 7.2 7.4 7.6 7.8 8 8.2
2-Sep 3-Sep 4-Sep 5-Sep 6-Sep 7-Sep 8-Sep 9-Sep 10-Sep 11-Sep 12-Sep
pH
0 1 2 3 4 5 6 7
precipitation(mm), depth(m)
low er upper precipitation(mm) depth(m)
0 10 20 30 40
2-Sep 3-Sep 4-Sep 5-Sep 6-Sep 7-Sep 8-Sep 9-Sep 10-Sep 11-Sep 12-Sep
salinity (psu)
0 1 2 3 4 5 6 7
precipitation(mm), depth(m)
lower(%) upper(%) precipitation(mm) depth(m)
oxygen was consumed. On Sep. 8, the reason for the decrease of DO in the bottom layer is thought to be correlated with high rainfall causing resuspension of the substrate.
This resuspension is apparent Fig. 11 where a marked increase in SS levels of the bottom layer was observed on the same day. However, recovery of average density after several days indicates the stability of the pond environment as a site biological activity.
3.2.2. Seasonal variability
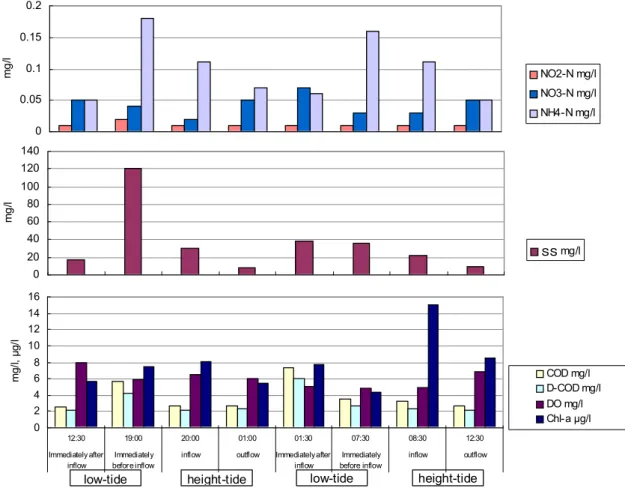
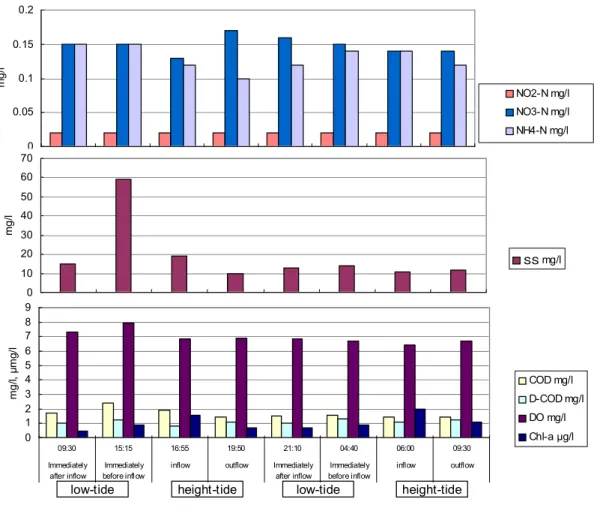
Figures 12 and 13 show the changes in water quality during summer and winter, respectively. As for inorganic nitrogen, nitrate levels increased while organic nitrogen decreased at high tide (Figs.
12A and 13D). So it is inferred nitrification because the aerobic environment in the tidal zone is maintained. On the other hand, organic nitrogen increased and nitrate nitrogen decreased at low tide. This can be inferred since the environment of the sub-tidal zone was anaerobic and inorganic nitrogen was removed outside the pond. As for the increase in organic nitrogen associated with drying up at night, the microorganism was able to resolve the organism and because of COD being decreased. Since it is unlikely that the pond dried up during the day was
Fig. 11 Change in precipitation, depth, and suspended solid levels between 2 to 12 Sep., 2004
Fig. 10 Change in dissolved oxygen and meteorological condition between 2 to 12 Sep., 2004
0 1 2 3 4 5 6 7 8 9 10
2-Sep 3-Sep 4-Sep 5-Sep 6-Sep 7-Sep 8-Sep 9-Sep 10-Sep 11-Sep 12-Sep
DO (mg/l)
0 200 400 600 800 1000 1200
meteorological condtion (W/㎡)
low er(mg/l) upper(mg/l) meteorological condition(W/m2)
0 200 400 600 800 1000 1200
2-Sep 3-Sep 4-Sep 5-Sep 6-Sep 7-Sep 8-Sep 9-Sep 10-Sep 11-Sep 12-Sep
suspended solid(NTU)
0 1 2 3 4 5 6
precipitation(mm), depth(m)
low er(NTU) precipitation(mm) depth(m)
dissolved the organism from an increase COD, an increase in organic nitrogen was caused by the resuspension of sediments. This relationship between SS and DO is shown in Fig. 12 (B) and Fig.
13 (C). A similar tendency could be observed in winter, although the mass balance was less than it was in summer. It is thought that the climate in summer favors denitrification compared to nitrification. Moreover, SS exhibited the tendency to decrease at low tide. These findings suggest that the SS that entered the pond from the open sea was deposited in the tidal and the sub-tidal zones of the pond.
As for COD, there was no decrease or nor any change associated with drying at low tide. As a result, it appears that the organisms that entered the pond from the open sea was dissolved by the benthos in the pond or deposited in the tidal and the sub-tidal zones. A decrease in COD and increase in DO was observed and can be attributed to the resolution of a particle organism and becoming a dissolubility organism.
Chl-a decreased during the day and at low tide at night. This reason is thought to be because the phytoplankton from open sea settled and stayed in the sub-tidal zone and tidal zones of the pond. Additionally, another reason for the decrease in phytoplankton was due to consumption by zooplankton; withering for becoming the organism, but the difference between low and high tide was not marked. In addition, average Chl-a concentrations were high during summer (4.5 to 15.0
0 0.05 0.1 0.15 0.2
mg/l
NO2-N mg/l NO3-N mg/l NH4-N mg/l
0 20 40 60 80 100 120 140
mg/l
SS mg/l
Fig. 12 Changes in NO
2-N, NO
3-N, NH
4-N, SS, COD, D-COD, DO, Chl-a between 16 to 17 Sep., 2004
0 2 4 6 8 10 12 14 16
12:30 19:00 20:00 01:00 01:30 07:30 08:30 12:30
Immediately after inflow
Immediately before inflow
inflow outflow Immediately after inflow
Immediately before inflow
inflow outflow
mg/l, μg/l
COD mg/l D-COD mg/l DO mg/l Chl-a μg/l
height-tide height-tide low-tide
low-tide
mg l
-1in summer and 0.5 to 2.0 mg l
-1in winter), implying that phytoplankton production was high during summer because the daily amount of solar radiation is higher than it is in winter.
Consequently, seasonal variations in solar radiation and tidal motion play a significant role in seasonal DO and Chl-a concentrations by affecting photosynthesis.
3.3. Biological investigation
Figure 14 shows the number of specimens and species sampled inside and outside the pond shortly after construction. Eleven species where found outside the pond after construction, mainly polychaetes, crustaceans and mudskippers. Only biota well adapted to the muddy environment of tidal flats were found outside the pond as the concentration of mud exceeded 80% (v/v).
Conversely, the number of biota inside the pond increased slowly since hermit crab such as Camptandrium sexdentatum Stimpson was first observed in Nov. 2000. Species increased in the following order: mussel worms, crabs, and mudskippers. By Oct. 2003, 12 species had been observed, exceeding that observed outside the pond. In addition, rare species such as Uca arcuata and Uca lacteal were observed inside the pond, increasing the total number of species to 17 by Sep. 2004.
0 0.05 0.1 0.15 0.2
mg/l
NO2-N mg/l NO3-N mg/l NH4-N mg/l
0 10 20 30 40 50 60 70
mg/l
SS mg/l
0 1 2 3 4 5 6 7 8 9
09:30 15:15 16:55 19:50 21:10 04:40 06:00 09:30
Immediately after inflow
Immediately before inflow
inflow outflow Immediately
after inflow
Immediately before inflow
inflow outflow
mg/l, μmg/l
COD mg/l D-COD mg/l DO mg/l Chl-a μg/l
low-tide
low-tide height-tide height-tide
Fig. 13 Changes in NO
2-N, NO
3-N, NH
4-N, SS, COD, D-COD, DO, Chl-a
between 9 to 10 Dec., 2004
It is thought that the Do you mean that habitat variability and gradient inside the pond accounted for the increase in the number of species inside the pond. Moreover, the number of taxa is expected to increase in the future because mollusks have not observed inside the pond.
0 2 4 6 8 10 12 14 16 18
inside outside inside outside inside outside inside outside inside outside inside outside inside outside 28.Oct.0217.Mar.0328.May.0313.Aug.03 9.Oct.03 9.Dec.0327.Sep.04
annelid mollusca arthropoda vertebrate
number of species
0 200 400 600 800 1000 1200 1400 1600 1800
1 2 3 4
3.0m annelid 3.0m arthropoda
3.5m annelid 3.5m arthropoda
outside annelid outside arthropoda
13.Aug.03 9.Oct.03 9.Dec.03 27.Sep.04
0 0.2 0.4 0.6 0.8 1 1.2 1.4
1 2 3 4
3.0m annelid 3.0m arthropoda
3.5m annelid 3.5m arthropoda
outside annelid outside arthropoda
13.Aug.03 9.Oct.03 9.Dec.03 27.Sep.04 (g)
0 20 40 60 80 100 120 140
1-Dec-02 1-Mar-03 1-Jun-03 1-Sep-03 1-Dec-03 1-Mar-04 1-Jun-04 1-Sep-04 1-Dec-04
3.0m S 3.0m L 3.5m S 3.5m L 4.0m S 4.0m L
number of nest-hole.