33
Copyright@SPSD Press from 2010, SPSD Press, Kanazawa
Study on a Method of Making a Concentrated Urban Structure Model Based on an Urban Master Plan
Shirou Tsuboi
1*, Shinji Ikaruga
1, and Takeshi Kobayashi
11 Science and Engineering, Yamaguchi University
* Corresponding Author, Email: [email protected] Received 14 September, 2014; Accepted 24 Feberuary, 2015
Key words: Local City, Compact City, Future Population, Concentrated Urban Structure, Master Plan
Abstract: In this study, we created concentrated urban structure models based on the scenarios that demonstrate a compact city. We investigated urban districts, suburban sprawl areas and rural community areas. Moreover, we aimed to show a way to control land use and develop a future urban structure for local cities. The target area is the city of Yamaguchi, a non-area divided city1) and the city of Hofu, an area divided city1). First, using 100 meter mesh data, we analysed urban structures by using district and population distribution. Then, we built future population distribution models from 2010 to 2060 for the target area. Moreover, we produced a “Knowledge Base of Planning Policy” in order to realize a compact city based on each master plan of the target area.
Additionally, we set the “Rules of Population Migration” based on it. We created concentration urban structure models that applied the rules to future population distribution models. Lastly, we evaluated the concentrated urban structure models using the population distribution and the distance from urban facilities.
1. INTRODUCTION
1.1 Background and purpose of this study
The world population is continually increasing, however the Japanese population is decreasing (Table 1). As shown in Table 1, the Japanese population in 2050 is less than 100 million people. Also, Figure 1 showed the age structure of 2010 and 2060 in Japan. 40% of the people were over the age of 65 for the year 2060. The data shows that declining birth rate and population aging rate are progressing. Formations of urban structures are needed to solve such problems. The local government is considering a compact city project, which can recover the vitality of the central district and life base for residents.
Yamaguchi Prefecture, which is our target area, has their idea of a
compact city of urban structure that is multi-core and multi-layer. However,
the urban structure has been sprawling, with unplanned developments in the
suburbs and a decline of the central district. Due to this, a planning method
is needed for the formation of a concentrated urban structure. This will begin
to address the issues of a declining population, birth rate and central district
by local government.
Therefore, in this study, we set “Rules of Population Migration” based on future population, sprawling areas in suburbs and urban planning basic policy such as a general plan and urban master plan. Then, using these rules, we formed concentrated urban structure models and evaluated it. We aimed to consider a technical approach for the realization of a compact city.
Table 1. World population and Japanese population
2010 Population 2020 Population 2030 Population World 6,916,183,000 7,716,749,000 8,424,937,000
Japan 128,057,000 124,100,000 116,618,000 2040 Population 2050 Population 2060 Population World 9,038,687,000 9,550,944,000 9,957,398,000
Japan 107,276,000 97,076,000 86,737,000
Figure 1. Age structure of 2010 and 2060 in Japan
1.2 Review of related studies
There are many studies about compact cities worldwide. For example, there are studies that have focused on the form of a compact city as a result of the population density of elementary school zones (Kim, et al., 2010), those that have proposed a direction of urban regeneration (Jung Geun, et al., 2014), those that have been verified from carbon dioxide emissions (Gao, et al., 2013) and those that have verified compact cities according to public transport factors (Boquet, 2014).
Also, there are many studies about compact cities in Japan. For example, there are studies that have verified compact cities by using the cost of the formation effect (Takahashi and Deguchi, 2007), have verified from the carbon dioxide emissions (Uchida, et al.,2009; Kobayashi and Ikaruga, 2012; Kobayashi, et al., 2010) or have verified from the effect of the behaviour patterns of consumers (Yamane, et al., 2007).
However, there are few studies that have examined the formation method of a compact city in detail for a targeted local city in Japan.
1.3 Study methods
In this study, the target area is the city of Yamaguchi which is the capital of Yamaguchi Prefecture and the city of Hofu which has over 100,000 people. At first, using 100 meter mesh data, we analysed urban structures by using district and population distribution. Next, we forecast the future population by using a primary factors cohort. We also, built future population distribution models from 2010 to 2060 in our target area.
Moreover, we made “Knowledge Base of Planning Policy” for the
0% 20% 40% 60% 80% 100%
0-14 15-64 65- Uncertain Age
2010 (13%) (63%)
(1%)
2060 (9%) (51%) (40%)
(23%)
realization of a compact city based on each master plan for the target area.
We also set “Rules of Population Migration” based on it. We created concentrated urban structure models by applying the rules and future population distribution models. Then, we evaluated the models using the population distribution and the distance from urban facilities. Lastly, we show knowledge on building methods and evaluation of the models.
2. SUMMARY OF THE TARGET AREA
As previously mentioned, the target area is the city of Yamaguchi which is a non-area divided city and the city of Hofu which is an area divided city.
2.1 Land use
Urban structures in the target area were analysed using land use with 100 meter mesh data
2). The land use was classified into 14 categories of “Rice Area”, “Growth Area”, “Mountain Area”, “Water Area”, “Other Nature Area”, “Residential Area”, “Commercial Area”, “Industrial Area”, “Public Institution Area”, “Traffic Facility Area”, “Public Vacant Area”, “Other Public Institution Area”, “Other Vacant Area”, and “Road Area”. Table 2 shows the number of the land use mesh. For Inside Use District, “Residential Area” has largest number of meshes. On the other hand, Outside Use District, “Mountain Area” is the largest.
Table 2. Number of Land Use Meshes
2.2 Population distribution
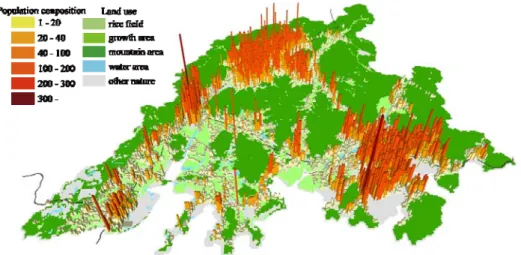
Urban structures in target areas were analysed using population distribution with 100 meter mesh data
3). Population distribution was classified into seven categories of “0 people”, “1-20 people”, “20-40 people”, “40-100 people”, “100-200 people”, “200-300 people”, and “over 300 people”. Figure 2 and Table 3 show the number of mesh for the population distribution. For Inside Use District, “40-100 people” have the
Land Use Target Area
Inside Use District Outside Use District Rice Area 1,162 (14.9%) 8,751 (15.1%) Growth Area 117 (1.5%) 1,101 (1.9%) Mountain Area 781 (10.0%) 41,293 (71.5%) Water Area 96 (1.2%) 924 (1.6%) Other Nature Area 217 (2.8%) 1,658 (2.9%) Residential Area 2,662 (34.1%) 1,256 (2.2%) Commercial Area 425 (5.5%) 228 (0.4%) Industrial Area 920 (11.8%) 286 (0.5%) Public Institution Area 562 (7.2%) 489 (0.8%) Traffic Facility Area 56 (0.7%) 75 (0.1%) Public Vacant Area 211 (2.7%) 371 (0.5%) Other traffic facility area 48 (0.6%) 317 (0.5%) Other Vacant Area 394 (5.1%) 879 (1.5%) Road Area 145 (1.9%) 156 (0.3%) Total 7,796 (100.0%) 57,787 (100.0%)
Figure 2. Population Distribution in the Target Area
largest number of mesh. On the other hand, Outside Use District, “0 people”
is largest.
Table 3. Number of the Mesh of the Population
3. CALCULATION OF FUTURE POPULATION AND BUILDING OF FUTURE POPULATION
DISTRIBUTION MODELS
In this section, we explain how to build the future population distribution models for the target area. At first, we calculated the future population by using a primary factors cohort. Then, we made parameters of population distribution using number of Tele-point
4)and built the 100 meter mesh population distribution models. Finally, we evaluated future population distribution models.
3.1 Calculation of future population
At first, we calculated the future population of 2020, 2030, 2040, 2050 and 2060 by using a primary factors cohort based on the 5-year age group and population composition of 2000, 2005 and 2010. Table 4 shows the future population. When comparing the population in 2010 to that of 2060, it is possible to see that the population of Yamaguchi City will decrease by 62.4% and Hofu by 65.9%.
Population Target Area
Inside Use District Outside Use District 0 2,123 (27.2%) 49,080 (84.9%) 1-20 1,825 (23.4%) 7,376 (12.8%) 20-40 1,441 (18.5%) 970 (1.7%) 40-100 2,190 (28.1%) 340 (0.6%) 100-200 211 (2.7%) 19 (0.0%)
200-300 5 (0.1%) 1 (0.0%)
300- 1 (0.0%) 1 (0.0%)
Total 7,796 (100.0%) 57,787 (100.0%)
Table 4. Future Population
2010 Population 2020 Population 2030 Population Target Area 284,772 261,792 (91.9) 238,162 (83.6) Yamaguchi City 183,223 167,612 (91.5) 154,317 (84.2)
Hofu City 101,549 94,180 (92.7) 83,845 (82.6)
2040 Population 2050 Population 2060 Population Target Area 223,705 (78.6) 200,194 (70.3) 181,358 (63.7) Yamaguchi City 144,079 (78.6) 128,248 (70.0) 114,403 (62.4)
Hofu City 79,626 (78.4) 71,947 (70.8) 66,955 (65.9)
( ) shows the change rate for 2010 population
3.2 The building of future population distribution models
The 100 meter mesh future population distribution models are referenced in Figure 1. We calculated the population distribution parameter according to the number of the Tele-point in the target area. Then, we distributed the population to each mesh by parameter. Formula 1 shows how to calculate the population distribution parameter.
Distribution Parameter =
Number of the Tele-point on each 100 meter mesh
Formula 1 Number of the Tele-point
on the target area
3.3 Evaluation of future population distribution models
Finally, we evaluated the future population distribution models. Table 5 shows the number of mesh. In the 2010 urban structure, “1-20 people” has 9,201 (14.0%). On the other hand, in 2060 urban structure has 10,387 (15.8%). Also, in the 2010 urban structure, over 100 people has 238, on the other hand, 2060 urban structure has 19.
Table 5. Number of the Mesh of the Future Population
2010 Population 2020 Population 2030 Population 0 51,203 (78.1%) 51,683 (78.8%) 51,733 (78.9%) 1-20 9,201 (14.0%) 9,429 (14.4%) 9,728 (14.8%) 20-40 2,411 (3.7%) 2,415 (3.7%) 2,386 (3.6%) 40-100 2,530 (3.9%) 1,970 (3.0%) 1,680 (2.6%)
100-200 230 (0.4%) 82 (0.1%) 53 (0.1%)
200-300 6 (0.0%) 4 (0.0%) 3 (0.0%)
300- 2 (0.0%) 0 (0.0%) 0 (0.0%)
2040 Population 2050 Population 2060 Population 0 51,749 (78.9%) 51,820 (79.0%) 51,983 (79.3%) 1-20 9,916 (15.1%) 10,204 (15.6%) 10,387 (15.8%) 20-40 2,408 (3.7%) 2,424 (3.7%) 2,342 (3.6%) 40-100 1,471 (2.2%) 1,110 (1.7%) 852 (1.3%)
100-200 37 (0.1%) 25 (0.0%) 19 (0.0%)
200-300 2 (0.0%) 0 (0.0%) 0 (0.0%)
300- 0 (0.0%) 0 (0.0%) 0 (0.0%)
4. THE BUILDING OF CONCENTRATED URBAN STRUCTURE MODELS
In this section, at first, we made the “Knowledge Base of Planning Policy”
based on the master plan of Yamaguchi Prefecture and the cities of Yamaguchi and Hofu. Then, we set “Rules of Population Migration” based on the “Knowledge Base of Planning Policy”. Finally, we created concentrated urban structure models based on the rules.
4.1 The making of the “Knowledge Base of Planning Policy”
We made the “Knowledge Base of Planning Policy” to build concentrated urban structure models, applicable though government plans. At first, we used the six categories of “Environmental Protection”, “Residential Area”,
“Commercial and Business Area”, “Public Transportation”, “Roadside”, and
“Suburban” as referenced in the “Yamaguchi National Land Use Plan -The Fourth- (Yamaguchi Prefecture, 2010)”
5), “Yamaguchi City Planning Master Plan (Yamaguchi City, 2012)”
5), “Basic Policy for City Planning in Hofu (Hofu City, 1999)”
5)and “Yamaguchi Prefecture Master Plan Revised Version (Yamaguchi Civil Building Department, City Planning Division, 2008)”
6).
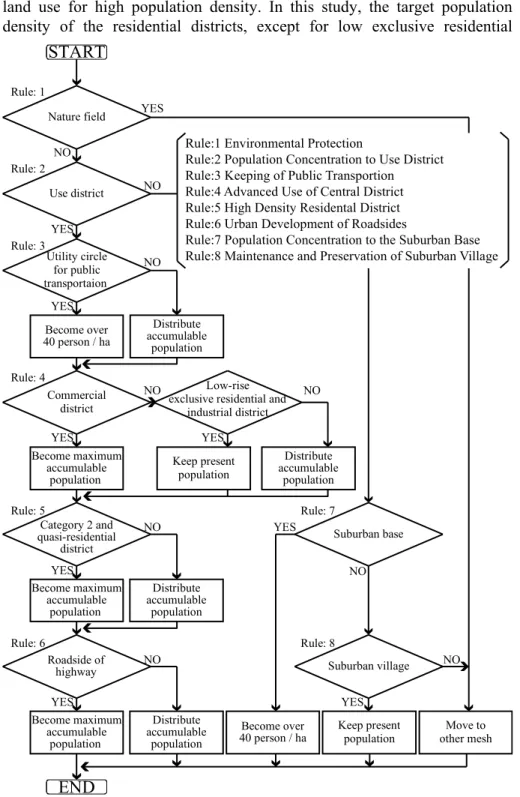
4.2 Setting of the “Rules of Population Migration”
We set the “Rules of Population Migration” based on the “Knowledge Base of Planning Policy”. In this study, we set eight rules of “Environmental Protection”, “Concentration of population to Use District”, “Keeping of Public Transportation”, “Advanced Use of Central District”, “High Density Residential District”, “Urban Development of Roadsides”, “Population Concentration to Suburban Base” and “Maintenance and Preservation for Suburban Village”. Figure 3 shows a flow chart on Rules of Population Migration. Further information on the rules is as follows.
Rule 1: Environmental Protection
This rule is important for the preservation of the natural and agricultural environment. The basic philosophy is to control the conversion from green fields such as farmland and timberland to other urban land use. If the land use of the mesh is “Rice Area”, “Growth Area”, “Mountain Area”, “Water Area” or ”Other Nature Area”, the mesh is designated as a non-inhabitable area. In this case, the population in the meshes move to the other transmigration area.
Rule 2: Concentration of Population to Use District
According to the future population in the target area, the population density is thought to expand with low density. Therefore, the population outflow to the loose regulation area might become lower in population density. Consequently, if the mesh is in the loose regulation area, except “the suburban location (Rule 7)” and “the suburban villages (Rule 8)”, the mesh is designated as a non-inhabitant area. In this case, the population in the meshes move to the other transmigration area.
Rule 3: Keeping of Public Transportation
Declining use of public transport is a serious problem in local cities. In
this study, the area within a 1 kilometer radius of a train station and a 500
meter radius of a bus stop is designated as a utility circle for public
transportation. The minimum population density of the mesh is set at 40 people/ha for the preservation of sustainable public transportation.
Rule 4: Advanced Use of Central District
Formation of a central urban area is needed for the concentration of urban functions and the increasing of the residential population. Therefore, the target population density in the commercial district should be set as the maximum accumulable population. The maximum accumulable population is calculated based on the area of vacant land, area of the site, and the legal floor area ratio. Also, if the use district is either low-rise exclusive residential districts or industrial districts, the population of the mesh does not move.
Rule 5: High Density Residential District
The residential district around the central business district is designated as land use for high population density. In this study, the target population density of the residential districts, except for low exclusive residential
Rule: 6
Distribute accumulable
population
Become over
40 person / ha Keep present population
Move to other mesh Become maximum
accumulable population
Distribute accumulable
population Rule: 5
Distribute accumulable
population Keep present
population Rule: 4
Distribute accumulable
population Rule: 3
Rule: 2 Rule: 1
Rule: 7
Rule: 8 Low-rise
exclusive residential and industrial district
Roadside of
highway Suburban village
Suburban base Nature field
Use district
Utility circle for public transportaion
Become over 40 person / ha
Commercial district
Become maximum accumulable
population
Category 2 and quasi-residential
district
Become maximum accumulable
population
END START
YES
YES
YES
YES
YES
YES
YES
YES YES
NO
NO
NO
NO NO
NO
NO
NO
NO Rule:1 Environmental Protection
Rule:2 Population Concentration to Use District Rule:3 Keeping of Public Transportion Rule:4 Advanced Use of Central District Rule:5 High Density Residental District Rule:6 Urban Development of Roadsides
Rule:7 Population Concentration to the Suburban Base Rule:8 Maintenance and Preservation of Suburban Village
Figure 3. Flow chart on Rules of Population Migration
districts, is set as the maximum accumulable population.
Rule 6: Urban Development of Roadsides
Roadside districts accommodate a concentration of urban functions.
Meshes of roadside define floor area as 200% ratio. The target population density is set as the maximum accumulable population.
Rule 7: Population Concentrated in Suburban Base
A certain population of Outside Use District is needed to keep the urban structure. In this study, the area within a 1 kilometer radius of JR Tonomi, JR Daidou, JR Azisu and the Aio government office are designated as the utility circle for the suburban base. The minimum population density of the mesh is set at 40 people/ha.
Rule 8: Maintenance and Preservation of Suburban Villages
A resident population of Outside Use District is needed to preserve and maintain the natural environment. In this rule, the mesh where the population under 55 years old is over 50% is designated as a suburban village. The mesh population becomes multiplied by the present population and the rate of change.
4.3 Creation of the concentrated urban structure models
We created the concentrated urban structure models on 2010 and 2040 population distribution based on Rules of Population Migration. In the target area, the master plan was made by assuming a 20-year destination. However, in this study, we selected by assuming a 30-year destination where the changes of the future population is largest. Figure 4 shows the 2040 urban structure and the 2040 concentrated urban structure model.
5. EVALUATION OF THE CONCENTRATED URBAN STRUCTURE MODELS
We evaluated the concentrated urban structure models using the population distribution and the distance from urban facilities.
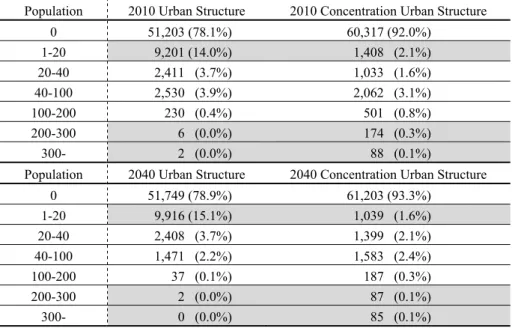
5.1 Evaluation by population distribution
Table 6 shows the concentrated urban structure models based on number of meshes of the population distribution. Table 7 shows the models based on the population by use district.
As shown in the number of meshes of the population distribution in the 2010 urban structure, “1-20 people” has 9,201 (14.0%) and the 2040 urban structure has 9,916 (15.1%). On the other hand, the 2010 concentrated urban structure model has 1,408 (2.2%) and the 2040 concentrated urban structure model has 1,039 (1.6%).
In the 2010 urban structure, over 200 people have 8 and the 2040 urban structure has 2. On the other hand, the 2010 concentrated urban structure model has 262 and the 2040 concentrated urban structure model has 172.
Next, as shown in the population by use district population, for
commercial districts, the 2010 urban structure has 14,839 (5.2%) and the
2040 urban structure has 11,646 (5.2%). On the other hand, the 2010
concentrated urban structure model has 54,794 (19.2%) and the 2040
concentrated urban structure model has 60,296 (27.0%).
Moreover, for the population of Outside Use District, the 2010 urban structure has 88,944 (28.8%) and the 2040 urban structure has 70,036 (30.7%). On the other hand, the 2010 concentrated urban structure model has 28,160 (9.8%) and the 2040 concentrated urban structure model has 20,403 (9.1%).
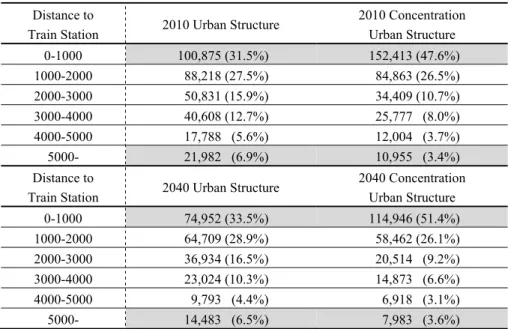
5.2 Evaluation by distance from urban facilities
The distance from urban facilities was classified into six categories “0- 1,000 meters”, “1,000–2,000 meters”, “2,000-3,000 meters”, “3,000-4,000 meters”, “4,000-5,000 meters” and “over 5,000 meters”. Table 8 shows Table 6. Number of the Mesh by Population distribution
凡例
1- 20 20 - 40 40 - 100 100 - 200 200 - 300 300 -
人口(人) 土地利用
その他 田畑 水面 山林
Figure4. 2040 Urban Structure and Concentrated Urban Structure Model 2040 Concentrated Urban Structure Model
2040 Urban Structure
Population 2010 Urban Structure 2010 Concentration Urban Structure 0 51,203 (78.1%) 60,317 (92.0%) 1-20 9,201 (14.0%) 1,408 (2.1%) 20-40 2,411 (3.7%) 1,033 (1.6%) 40-100 2,530 (3.9%) 2,062 (3.1%) 100-200 230 (0.4%) 501 (0.8%)
200-300 6 (0.0%) 174 (0.3%)
300- 2 (0.0%) 88 (0.1%)
Population 2040 Urban Structure 2040 Concentration Urban Structure 0 51,749 (78.9%) 61,203 (93.3%) 1-20 9,916 (15.1%) 1,039 (1.6%) 20-40 2,408 (3.7%) 1,399 (2.1%) 40-100 1,471 (2.2%) 1,583 (2.4%)
100-200 37 (0.1%) 187 (0.3%)
200-300 2 (0.0%) 87 (0.1%)
300- 0 (0.0%) 85 (0.1%)
Table 7. Population by Use District
Use District 2010 Urban Structure 2010 Concentration Urban Structure Residential 1 47,941 (16.8%) 30,818 (10.8%) Residential 2 780 (0.3%) 626 (0.2%) Residential 3 35,068 (12.3%) 39,911 (14.0%) Residential 4 7,775 (2.7%) 8,629 (3.0%) Residential 5 51,858 (18.2%) 61,906 (21.7%) Residential 6 10,026 (3.5%) 21,644 (7.6%) Residential 7 3,894 (1.4%) 6,986 (2.5%) Commercial 1 5,112 (1.8%) 15,911 (5.6%) Commercial 2 14,839 (5.2%) 54,794 (19.2%) Industrial 1 17,614 (6.2%) 14,548 (5.1%) Industrial 2 657 (0.2%) 381 (0.1%) Industrial 3 263 (0.1%) 457 (0.2%) Outside Use District 88,944 (31.2%) 28,160 (9.9%) Use District 2040 Urban Structure 2040 Concentration Urban Structure Residential 1 40,761 (18.2%) 28,795 (12.9%) Residential 2 660 (0.3%) 563 (0.3%) Residential 3 28,430 (12.7%) 22,882 (10.2%) Residential 4 6,209 (2.8%) 2,129 (1.0%) Residential 5 42,368 (18.9%) 36,914 (16.5%) Residential 6 7,859 (3.5%) 16,014 (7.2%) Residential 7 3,083 (1.4%) 5,604 (2.5%) Commercial 1 4,135 (1.8%) 16,479 (7.4%) Commercial 2 11,646 (5.2%) 60,296 (27.0%) Industrial 1 7,775 (3.5%) 13,208 (5.9%) Industrial 2 518 (0.2%) 306 (0.1%) Industrial 3 224 (0.1%) 111 (0.0%) Outside Use District 70,036 (31.3%) 20,403 (9.1%)
the distance to the nearest train station and Table 9 shows the distance to the nearest general hospital.
As shown in the “less than 1,000 meters” category of the distance to the
train station, the 2010 urban structure has 100,875 people (31.5%) and the
2040 urban structure has 74,952 people (33.5%). On the other hand, the
Table 8. Population by distance to a train station
Table 9. Population by distance to a general hospital
Distance to a
General Hospital 2010 Urban Structure 2010 Concentration Urban Structure
0-1000 86,935 (27.1%) 73,873 (24.0%)
1000-2000 91,766 (28.6%) 84,166 (26.3%)
2000-3000 57,230 (17.9%) 53,771 (16.8%)
3000-4000 28,343 (8.8%) 43,924 (13.7%)
4000-5000 18,529 (5.8%) 34,374 (10.7%)
5000- 37,500 (11.7%) 27,313 (8.5%)
Distance to a
General Hospital 2040 Urban Structure 2040 Concentration Urban Structure
0-1000 27,609 (12.3%) 63,321 (28.3%)
1000-2000 44,846 (20.0%) 58,637 (26.2%)
2000-3000 39,798 (17.8%) 36,940 (16.5%)
3000-4000 39,560 (17.7%) 27,795 (12.4%)
4000-5000 34,794 (15.6%) 22,285 (10.0%)
5000- 37,098 (16.6%) 14,717 (6.6%)
2010 concentrated urban structure model has 152,413 people (47.6%) and the 2040 concentrated urban structure model has 114,946 people (51.4%).
Also, for the “over 5,000m” category, the 2010 urban structure has 21,982 people (6.9%) and the 2040 urban structure has 14,483 people (6.5%). On the other hand, the 2010 concentrated urban structure model has 10,955 people (3.4%) and the 2040 concentrated urban structure model has 7,983 people (3.6%).
As shown in the “less than 1,000 meters” category, of the distance to the general hospital, the 2010 urban structure has 86,935 people (27.1%) and the 2040 urban structure has 61,229 people (27.4%). On the other hand, in 2010, the concentrated urban structure model has 145,373 people (45.4%) and the 2040 concentrated urban structure model has 113,267 people (50.6%).
Also, for the “over 5,000m” category, the 2010 urban structure has 37,500 people (11.7%) and the 2040 urban structure has 25,865 people (11.6%). On the other hand, the 2010 concentrated urban structure model has 21,463 people (6.7%) and the 2040 concentrated urban structure model has 12,401 people (5.5%).
Distance to
Train Station 2010 Urban Structure 2010 Concentration Urban Structure
0-1000 100,875 (31.5%) 152,413 (47.6%)
1000-2000 88,218 (27.5%) 84,863 (26.5%)
2000-3000 50,831 (15.9%) 34,409 (10.7%)
3000-4000 40,608 (12.7%) 25,777 (8.0%)
4000-5000 17,788 (5.6%) 12,004 (3.7%)
5000- 21,982 (6.9%) 10,955 (3.4%)
Distance to
Train Station 2040 Urban Structure 2040 Concentration Urban Structure
0-1000 74,952 (33.5%) 114,946 (51.4%)
1000-2000 64,709 (28.9%) 58,462 (26.1%)
2000-3000 36,934 (16.5%) 20,514 (9.2%)
3000-4000 23,024 (10.3%) 14,873 (6.6%)
4000-5000 9,793 (4.4%) 6,918 (3.1%)
5000- 14,483 (6.5%) 7,983 (3.6%)
As shown in the distance to both facilities, the closer population increased and the faraway population decreased.
6. CONCLUSION
In this study, we made a forecasting method of future population and built future population distribution models. Then, we made “Knowledge Base of Planning Policy” references for a government plan on our target area and made the “Rules of Population Migration”. We created the concentrated urban structure models that applied the rules and the future population models. Lastly, we evaluated the population distribution and the distance from urban facilities. This study is considered effective for planning aimed toward sustainable and compact urban structure. The results are as follows:
(1) In comparing the population from 2010 to 2060, the mesh of “1-20 people” is increasing and the mesh of “over 100 people” is decreasing.
(2) For the number of meshes according to population distribution, the mesh of “1-20 people” is decreasing and the mesh of “over 200 people”
is increasing.
(3) For the population by use district, the population in commercial districts is increasing and the population of Outside Use District is decreasing.
(4) For the distance from the train station, the population of “less than 1,000 meters” is increasing and the population of “over 5,000 meters” is decreasing.
(5) For the distance from the general hospital, the population of “less than 1,000 meters” is increasing and the population of “over 5,000 meters” is decreasing.
ENDNOTE
1)An area divided city is a city that has been established as a use district. A use district according to the City Planning Law of Japan aims to prevent mixed building use. It has been classified into 12 categories “Category 1 low-rise exclusive residential district”,
“Category 2 low-rise exclusive residential district”, “Category 1 medium-to-high- exclusive residential district”, “Category 2 medium-to-high-exclusive residential district”, “Category 1 residential district”, “Category 2 residential district”, “Quasi- residential district”, “Neighborhood commercial district”, “Commercial district”,
“Quasi-industrial district”, “Industrial district” and “Exclusive industrial district”
2)Land use has been determined from a 2005 aerial photo.
3)The present population has been distributed to each 100 meter mesh according to the number of the Tele-point from 500 meter mesh data.
4) Tele-point shows the address point that has a phone number. It has excluded company points and same location points.
5)Urban master plans such as the “Yamaguchi National Land Use Plan -The Fourth-”,
“Yamaguchi City Planning Master Plan” and “Basic Policy for City Planning in Hofu”
are legal government plans for basic urban planning.
6)“Yamaguchi Prefecture Master Plan Revised Version” is a voluntary plan for making urban master plans for basic policy based on the urban master plan.
REFERENCES
Kim, K., Kobayashi, Y., Himeno, Y., Kim, J., Kim, H., and Sato, S. (2010). “Compactness of Life Environment by Elementary School Zones in Oita City”, The 7th International Symposium on City Planning and Environmental Management in Asian Countries, 9-18.
Jung Geun, A., Hyum-Chang, J., Jae Hee, L., and Byeong Hwan, K. (2014). “A Study on the Plan Indicator for the Activation of Urban Regeneration in Small and Medium-Sized
Cities”, The 9th International Symposium on City Planning and Environmental Management in Asian Countries, 89-93.
Gao, X., Ji, J., and Wang, F. (2013). “Spatial Pattern of Transportation Carbon Emission based on Behavior Zones: Evidence from Beijing, China”, International Review for Spatial Planning and Sustainable Development, 1(2), 3-14.
Boquet, Y. (2014). “Transportation and Sustainable Development in a Mid-Size French City, Dijon”, International Review for Spatial Planning and Sustainable Development, 2(2), 52- 63.
Takahashi, M., and Deguchi, A. (2007). “Method for Cost-Benefit Evaluation System of Impact by Forming Compact City”, Journal of the City Planning Institute of Japan, 42(3), 487-492.
Uchida, G., Ujihara, T., Tanigichi, M., and Hashimoto, S. (2009). “Can we Realize the New Rural Structure with Low Environmental Load? Focus in Automobile CO-2 Emissions”, Journal of the City Planning Institute of Japan, 44(3), 361-366.
Kobayashi, T., and Ikaruga, S. (2014). “A Study on the Carbon Dioxide Emissions by Intensive Land Use at the Central District in Local City”, The 8th International Symposium on City Planning and Environmental Management in Asian Countries, 81-90.
Kobayashi, M., Kobayashi, T., and Ikaruga, S. (2010). “Evaluation of Compact City by Applying the Area Division System”, The 7th International Symposium on City Planning and Environmental Management in Asian Countries, 1-8.
Yamane, K., Zhang, J., and Fujiwara, A. (2007). “Influences of City Compactness on Travel Behavior Patterns in a Local City: Analysis Using an Aggregate-Type Discrete Choice Models Incorporating Inter-Alternative Similarities” Journal of the City Planning Institute of Japan, 42(3), 595-600.
Yamaguchi Prefecture. (2010). Yamaguchi National Land Use Plan – The Fourth –.
Yamaguchi City. (2012). Yamaguchi City Planning Master Plan.
Hofu City. (1999). Basic policy for city planning in Hofu.
Yamaguchi Civil Building Department City Planning Division. (2008). Yamaguchi Prefecture Master Plan Revised Version.