Experimental and Numerical Study on Mode II Delamination Behavior of Stitched CFRP Laminate
縫合 CFRP 複合材のモード II 層間剥離についての実験 および数値解析的研究
Jonny Herwan
Department of Aerospace Engineering Graduate School of System Design
Tokyo Metropolitan University
March 2016
Experimental and Numerical Study on Mode II Delamination Behavior of Stitched CFRP Laminate
縫合
CFRP
複合材のモードII
層間剥離についての実験 および数値解析的研究by Jonny Herwan Student ID 12991571
Submitted to the Department of Aerospace Engineering, Graduate School of System Design,
in partial fulfillment of the requirements for the degree of Doctor of Philosophy in Aerospace Engineering
at
TOKYO METROPOLITAN UNIVERSITY March 2016
Certified by advisor
Professor Naoyuki Watanabe Department of Aerospace Engineering
Graduate School of System Design Tokyo Metropolitan University
Doctoral thesis committee:
Professor Naoyuki Watanabe Tokyo Metropolitan University (Chairman) Professor Hiroshi Suemasu Sophia University
Professor Koichi Kitazono Tokyo Metropolitan University
Professor Satoshi Kobayashi Tokyo Metropolitan University
iii
Abstract
Carbon fiber reinforced plastics (CFRP) possess a superb strength and stiffness to weight ratio, thus have been used increasingly for light weight structures. However, conventional CFRP are very weak in the thickness direction and prone to be delaminated on interlaminar surfaces. To overcome this issue, stitching technique has been attracted a lot of attention. This dissertation aims to evaluate mode II (shear mode) delamination of stitched composites through experiment and finite element simulation.
Based on literature review, evaluating mode II delamination behavior of stitched composites is facing a serious problem. The testing specimens were failed before crack propagation. Considering this issue, a modified method called tabbed end notched flexure (TENF) test is proposed and the effects of stitching parameters are investigated.
It is found that the laminate with maximum stitch density and stitch thread thickness in this study have energy release rate 2.4 times of those unstitched one. To understand the crack bridging mechanism, a single stitched laminate under shear loading has also been investigated using a novel test called interlaminar shear test (IST). Based on this test, finite element simulation of TENF test has been developed. Using cohesive element (to simulate crack propagation plane) and spring connector element (to present the stitch thread), high accuracy of finite element modeling was achieved. Finally, the finite element model is extended to understand stitched laminate behavior under four point end notched flexure (4ENF) and quasi static indentation test.
Keywords: Mode II delamination, energy release rates, end notched flexure test, 3D
reinforcement, stitching, finite element modelling, cohesive zone model
iv
v
Contents
Abstract ... iii
Contents ...iv
List of Figures ... vii
List of Tables ...xi
Nomenclature ... xiii
Chapter 1 ... 1
Introduction ... 1
1.1 Background and Literature Review ... 1
1.1.1 Suppressing Delamination by Stitch Threads ... 3
1.1.2 Mode II Delamination Testing of Stitched Composites... 4
1.1.3 Numerical Study of Mode II Delamination Testing ... 6
1.1.4 Finite Element Simulation of Low Velocity Impact Induced Delamination of Stitched Composites ... 7
1.2 Objectives of Dissertation ... 8
1.3 Layout of Dissertation ... 9
Chapter 2 ... 11
Effect of stitching parameters on mode II delamination behavior of stitched composites ... 11
2.1 Overview ... 11
2.2 Experimental Work ... 11
2.2.1 Material and Specimen Preparation ... 11
2.2.2 Test Method ... 14
2.2.3 Data Reduction ... 18
2.2.4 Measurement of Local Fiber Volume Fraction ... 19
2.2.4.1 Fiber Compaction due to Stitching Process ... 19
2.2.4.2 Effect of Local Fiber Volume Fraction on Energy Release Rates ... 20
2.2.4.3 Measurement Method of Local Fiber Volume Fraction ... 21
2.3 Results and Discussion ... 22
2.3.1 Load-displacement Curves ... 22
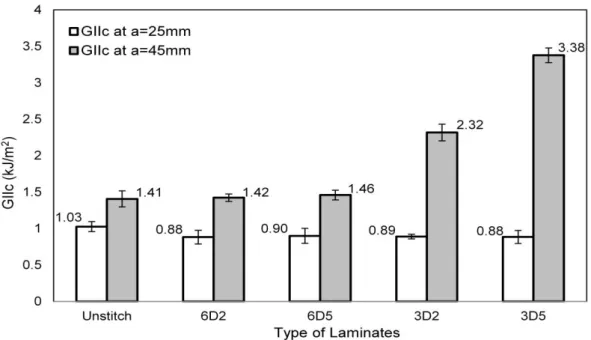
2.3.2 Energy Release Rates ... 25
2.3.3 Fiber Compaction Effects ... 33
2.4 Conclusions ... 34
Chapter 3 ... 35
Finite Element Analysis of Tabbed End Notched Flexure (TENF) Test ... 35
3.1 Overview ... 35
3.2 Interlaminar Shear Test (IST) ... 35
3.2.1 Experimental Method ... 35
3.2.2 Finite Element Simulation of Interlaminar Shear Test ... 37
3.3 Finite Element Simulation of Tabbed End Notched Flexure Test ... 39
3.4 Results and Discussion ... 43
3.5 Conclusions ... 60
Chapter 4 ... 61
Feasibility Study of Using Four Point End Notched Flexure (4ENF) Test for
vi
Stitched Laminate Application ... 61
4.1 Overview ... 61
4.2 Modeling Techniques ... 61
4.2.1 Finite Element Model ... 61
4.2.2 Investigating Laminate Failure during 4ENF Test ... 64
4.2.3 Predicting of Energy Release Rates ... 65
4.3 Results and Discussions ... 65
4.3.1 Load-displacement Curves ... 65
4.3.2 Laminate Failure Possibility during 4ENF Test ... 72
4.3.3 Energy Release Rates Prediction ... 79
4.4 Conclusions ... 80
Chapter 5 ... 83
Conclusions and Recommendations ... 83
5.1 Conclusions ... 83
5.2 Recommendations ... 83
References ... 87
Appendix A. Predicting Damage in Stitched Composites under Quasi Static Indentation Test ... 101
A.1 Overview ... 101
A.2 Modelling Techniques ... 101
A.3 Results and Discussions ... 104
A.4 Conclusions ... 113
Appendix B. User Subroutine for Matrix Crack Simulation... 114
Appendix C. Derivation of Equation 2.2 ... 115
Acknowledgements ... 117
vii
List of Figures
Figure 1.1: Composites as primary structure of Boeing 787 Dreamliner ... 1
Figure 1.2: CFRP body frame of BMW – 7 Series ... 2
Figure 1.3: (a) Stitching process by Toyota Industries. Co. Ltd. [11], (b) Cross-section of typical final product of stitched laminate ... 3
Figure 1.4: Types of delamination modes... 4
Figure 1.5: Types of mode II delamination test; (a) End notched flexure (ENF), (b) Stabilized end notched flexure (SENF), (c) End loaded split (ELS), (d) Four point end notched flexure (4ENF) ... 5
Figure 1.6: Types of impact loading [49] ... 8
Figure 2.1: Modified-lock stitching (a) Schematic pattern, (b) A 3 × 3 mm stitched composite laminate with ENF specimen cutting position ... 13
Figure 2.2: A schematic premature failure of stitched composite during ENF test (courtesy of JAXA) ... 15
Figure 2.3: Tabbed end notched flexure (TENF) specimen set-up with a specific crack tip position ... 16
Figure 2.4: Mode II delamination test set-up ... 17
Figure 2.5: Normalized maximum interface shear stress at the loaded fibers end of a pull-out test simulation (data from: Fu et al. [82]) ... 21
Figure 2.6: Schematic of the cutting method used for sample burn-off tests ... 22
Figure 2.7: Typical load‒displacement pattern for (a)Unstitched laminate (b)Stitched 6x6 200D (c)Stitched 6x6 500D (d)Stitched 3x3 200D and (e)Stitched 3x3 500D ... 23
Figure 2.8: Tested specimen of stitched 6 × 6 mm and 500 denier thread thickness ... 24
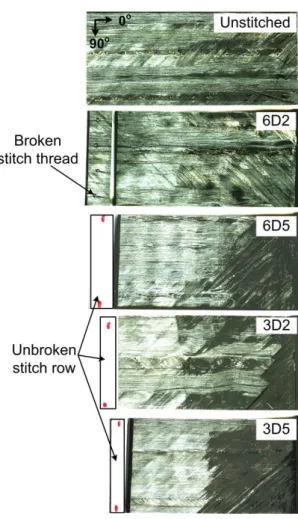
Figure 2.9: Crack propagation planes of all specimen types at pre-crack regions ... 25
Figure 2.10: Typical specimen compliance curve in terms of C/Co versus (a/L)
3... 26
Figure 2.11: R curves for (a)Unstitched laminate (b)Stitched 6x6 200D (c)Stitched 6x6 500D (d)Stitched 3x3 200D and (e)Stitched 3x3 500D ... 31
Figure 2.12: Average values of critical energy release rates (G
IIC) for crack lengths of 25 mm and 45 mm ... 32
Figure 2.13: Local fiber volume fractions (V
fl) for each specimen type obtained by burn-off tests ... 33
Figure 3.1: Interlaminar shear test specimen ... 37
viii
Figure 3.2: Interlaminar shear test set-up ... 37
Figure 3.3: Cross-sectional of stitch thread composites at the interface of middle layers ... 38
Figure 3.4: Half model (lower part) of IST specimen ... 39
Figure 3.5: Convergence check of the elements sizes ... 39
Figure 3.6: TENF experimental set up ... 41
Figure 3.7: TENF modeling geometry ... 42
Figure 3.8: Load-displacement curve obtained by IST of single stitched laminate ... 44
Figure 3.9: Fracture surface of interlaminar shear test specimen ... 44
Figure 3.10: Stitching process with Kapton film at the middle layer ... 45
Figure 3.11: Micro-CT image of IST specimen after different loading ... 45
Figure 3.12: Load displacement curve of experimental and numerical results ... 47
Figure 3.13: Global coordinate system of IST simulation ... 47
Figure 3.14: Displacement and stress distribution at delaminated surface (90° layer) of the moving part, under 10.5 N loading (a)Displacement in x-direction (b)Normal stress along fibers direction (c)In-plane shear stress (d)Normal stress perpendicular to fibers direction ... 48
Figure 3.15: Displacement and stress distribution at delaminated surface (90° layer) of moving part, under 21.3 N loading (a)Displacement in x-direction (b)Normal stress along fibers direction (c)In-plane shear stress (d)Normal stress perpendicular to fibers direction ... 49
Figure 3.16: Displacement and stress distribution at delaminated surface (90° layer) of moving part, under 180.5 N loading (a)Displacement in x-direction (b)Normal stress along fibers direction (c)In-plane shear stress (d)Normal stress perpendicular to fibers direction ... 50
Figure 3.17: Effects of critical interfacial strength ... 51
Figure 3.18: Effects of viscosity coefficient of the cohesive element ... 52
Figure 3.19: Effects of interfacial stiffness ... 53
Figure 3.20: Effects of number of stitch rows at the crack region ... 54
Figure 3.21: Load displacement curve with number of active stitch thread at crack region ... 55
Figure 3.22: Crack propagation length vs. displacement ... 56
Figure 3.23: Delamination indicator (a) At the crack length of 38 mm (b) At the crack length of 50 mm ... 56
Figure 3.24: Finite element simulation of TENF at the crack length of 50 mm
(a) Deflection-U
3(b) Normal stress along fiber direction-S
11... 57
ix
Figure 3.25: Finite element simulation of TENF at the crack length of 50 mm (a) Normal stress perpendicular to fiber direction-S
22(b) In-plane shear
stress-S
12... 58
Figure 3.26: Predicting stitch thread deformation during TENF test ... 59
Figure 4.1: Set-up of tabbed 4ENF test ... 62
Figure 4.2: Finite element model of Tabbed 4ENF test... 63
Figure 4.3: Detail modelling techniques of Tabbed 4ENF test ... 64
Figure 4.4: Predicted load-displacement curve of unstitched unidirectional laminate under 4ENF test... 66
Figure 4.5: Simulation results of unstitched unidirectional laminate under 4ENF test (a) Deformation (b) Delamination propagated till 48.5 mm length ... 66
Figure 4.6: Predicted load-displacement curve of unstitched multidirectional laminate under 4ENF test... 67
Figure 4.7: Simulation results of unstitched multidirectional laminate under 4ENF test (a) Deformation (b) Delamination propagated till 48.5 mm length ... 67
Figure 4.8: Predicted load-displacement curve of stitched laminate under 4ENF test... 69
Figure 4.9: Simulation results of stitched multidirectional laminate under 4ENF test (a) Deformation (b) Delamination propagated till 48.5 mm length ... 69
Figure 4.10: Predicting stitch thread deformation during 4ENF test ... 70
Figure 4.11: Predicted load-displacement curve of stitched laminate under Tabbed 4ENF ... 70
Figure 4.12: Simulation results of stitched multidirectional laminate under T4ENF test (a) Deformation (b) Delamination propagated till 48.5 mm length ... 71
Figure 4.13: Predicting stitch thread deformation during T4ENF test ... 72
Figure 4.14: Normal stress along fiber direction (σ
xx) of unstitched unidirectional laminate ... 73
Figure 4.15: Normal stress perpendicular to fiber direction (σ
yy) of unstitched unidirectional laminate ... 74
Figure 4.16: In plane shear stress (σ
xy) of unstitched unidirectional laminate ... 74
Figure 4.17: Normal stresses perpendicular to fibers direction-S
22(a) Stitched laminate without tabs (b) Stitched laminate with tabs ... 76
Figure 4.18: Normal stress perpendicular to fiber direction at each layer ... 76
Figure 4.19: In-plane shear stresses-S
12(a) Stitched laminate without tabs (b) Stitched laminate with tabs ... 77
Figure 4.20: In-plane shear stress at each layer ... 77
Figure 4.21: Normal stresses along fibers direction-S
11(a) Stitched laminate without
x
tabs (b) Stitched laminate with tabs ... 78
Figure 4.22: Normal stress in fiber direction ... 79
Figure 4.23: Compliance vs. crack length ... 80
Figure A.1: Finite element model of quasi static indentation ... 103
Figure A.2: Finite element model of open-hole tension test ... 104
Figure A.3: Open hole simulation of unidirectional 0° laminate (a) Normal stress along fibers direction (b) Normal stress perpendicular to fibers direction (c) Matrix crack ... 105
Figure A.4: Open hole simulation of unidirectional 90° laminate (a) Normal stress along fibers direction (b) Normal stress perpendicular to fibers direction (c) Matrix crack ... 106
Figure A.5: QSI simulation results of unstitched laminate (a) Deformation (b) Normal stress along fibers direction (c) In-plane shear stress (d) Normal stress perpendicular to fiber direction ... 108
Figure A.6: QSI simulation results of stitched laminate (a) Deformation (b) Normal stress along fibers direction (c) In-plane shear stress (d) Normal stress perpendicular to fiber direction ... 109
Figure A.7: Load-displacement of quasi static indentation results ... 110
Figure A.8: Delamination area at indentation depth of 1.8 mm (a) Experiment [61], .. 111
Figure A.9: Effect of matrix tensile strength on QSI results ... 112
Figure A.10: Effect of materials degradation rule on QSI results ... 113
xi
List of Tables
Table 2.1: Types of test specimens ... 14
Table 2.2: Parametric study of tab thickness ... 16
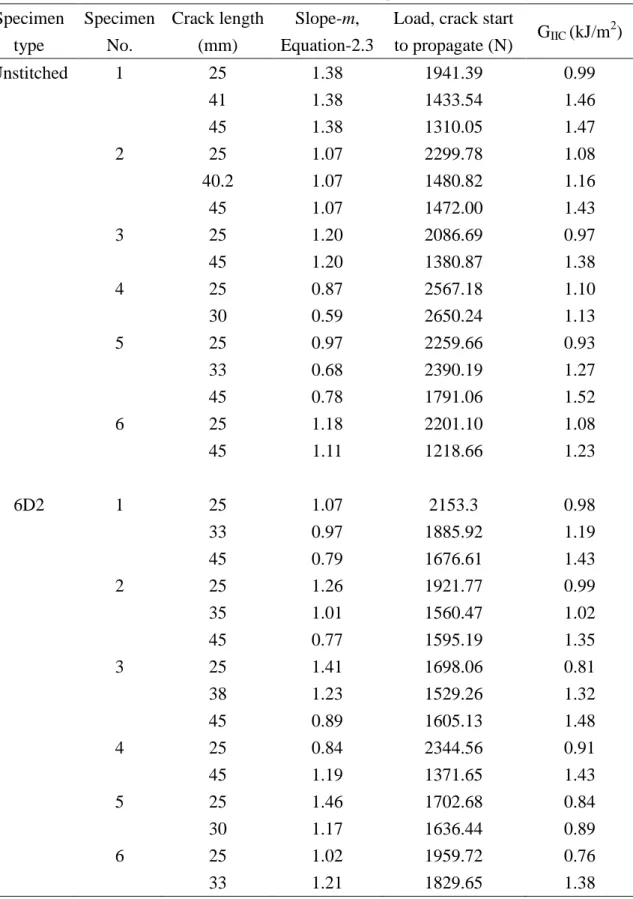
Table 2.3: Detail data of each specimens ... 28
Table 3.1: Mechanical properties of matrix and carbon fiber………. 36
Table 4.1: Mechanical properties of laminae ... 62
Table 4.2: Parametric study of matrix crack ... 78
Table 4.3: Energy release rate prediction ... 80
Table A.1: Mechanical properties of lamina [108] ... 102
Table A.2: Cohesive contact parameters [69] ... 104
xii
xiii
Nomenclature
E G ν SD Sp Ss V
fV
flG
IIP C C
0m a w L 𝜎
𝑖𝜎
𝑖𝑜G
nG
sG
t𝐺
𝑖𝑐K µ Y
TS
xyS
yzElastic modulus Shear modulus Poisson’s ratio Stitch density Stitch pitch Stitch space
Fiber volume fraction of composites Local fiber volume fraction of tow Mode II energy release rates Load
Specimen compliance at certain crack length Specimen compliance without crack
Slope of compliance vs. crack length Crack length
Specimen width
Half-length of testing span
Stress component under pure modes I, II and III
Critical interfacial strength under pure modes I, II and III Energy release rates in normal (mode I) direction
Energy release rates in shear (mode II) direction Energy release rates in tearing (mode III) direction
Critical energy release rate in i- direction (mode I, II, or III) Stiffness of cohesive element or cohesive contact
Viscosity coefficient of cohesive zone element Matrix tensile strength
Matrix in-plane shear strength
Matrix out of plane shear strength
xiv
1
Chapter 1 Introduction
1.1 Background and Literature Review
Carbon fiber reinforced plastics (CFRP) possess a superb strength and stiffness to weight ratio. These exceptional properties meet the requirement for more economic fuel consumption. Therefore, the use of CFRP for main structures is increasing tremendously, particularly in aircraft and automotive structures (Figure 1.1 and 1.2).
Figure 1.1. Composites as primary structure of Boeing 787 Dreamliner
However, CFRP laminate are very weak in the thickness direction and prone to
be delaminated at interlaminar. To overcome this issue, 3D reinforcements [1, 2] such as
2
braiding [1, 3], knitting [4], stitching [5-7] and z-pinning [8, 9] were attracted a lot of attention. Stitching is one of promising method which conducted by insertion of threads into the preforms in the thickness direction prior to resin infusion and consolidation, as shown in Figure 1.3(a). A cross section of typical final product of stitched laminate manufactured by Toyota Industries Co. Ltd. is depicted in Figure 1.3(b). Although 3D reinforcement has negative effect on in-plane properties, due to resin rich region at vicinity of 3D reinforcements, latest review by Mouritz and Cox [6] concluded that stitching has less negative effect on in-plane properties compared to z-pinning.
Furthermore, Scarponi et al. [10] evaluate compression after impact performance of composite laminate with stitching, tufting and z-pinning, and concluded that stitching performs the best damage tolerance to manufacturing cost ratio.
Figure 1.2. CFRP (the black portions) on body frame of BMW – 7 Series
(Provided by BMW)
3
Figure 1.3. (a) Stitching process by Toyota Industries. Co. Ltd. [11], (b) Cross-section of typical final product of stitched laminate
1.1.1 Suppressing Delamination by Stitch Threads
The existence of stitch threads in composite laminates increases opening mode delamination toughness by shielding the crack tip from full effect of crack opening stress, thus reduces the crack propagation zone [12-18]. Mode I (opening mode) energy release rate (G
IC) in stitched laminate could reach 15 times that of unstitched laminate, depending on the type and diameter of the stitch thread, stitch density, and stitch distribution. In case of mode II delamination, stitch threads retain the sliding displacement, thereby increase the energy release rate (G
IIC) [19-25]. Moreover, stitching is also proven to be an effective reinforcement of composite laminates subjected to mixed mode loading [26-28]. A brief description of delamination modes are depicted in Figure 1.4.
Although stitched laminate shows a slight decreasing on in-plane mechanical
properties [6, 29], the extensive improvement on delamination toughness surpasses this
minor drawback. Therefore, many researchers are interesting on further applications of
stitching, such as T-joints [30-32], and lap-joints [33-36].
4
Figure 1.4. Types of delamination modes
1.1.2 Mode II Delamination Testing of Stitched Composites
It is important to be noted that international consensus on the standard procedure of mode II delamination testing of composite laminate has not been achieved, even though collaborative work has been conducted in 1996 by ESIS (European Structural Integrity Society), JIS (Japan Industrial Standards) group, ASTM (American Society for Testing and Materials) [37]. In this international round robin, four types of shear mode delamination testing were investigated in term of results consistency, simplicity of test configuration and crack propagation stability. Those four testing methods (Figure 1.5) are end notched flexure (ENF), stabilized end notched flexure (SENF), end loaded split (ELS), and four point end notched flexure (4ENF) test. The team summarized that ENF is simple but unstable, on the other hand ELS and SENF provide stable crack but not simple. Finally 4ENF showed good stability and simplicity, but still has little experience.
Therefore, the situation in 2003 seemed clear that 4ENF test become the standard test.
However, the group (Martin and Davidson) who proposed the 4ENF test [38] continued
their work particularly on evaluating four factors; loading roller diameter, specimen
5
geometry, friction, and fixture compliance. Latest review on those prospective standard procedures has also been reported by Brunner et al. [39]. Up to now only a local standard method already existed which is Japanese Industrial Standard JIS K 7086) [40].
Meanwhile, European Structural Integrity Society has proposed a draft European Standard called EN 6034. Both of JIS K 7086 and draft EN 6034 are using ENF testing method.
Figure 1.5. Types of mode II delamination test; (a) End notched flexure (ENF), (b) Stabilized end notched flexure (SENF), (c) End loaded split (ELS), (d) Four point end
notched flexure (4ENF)
Despite of no international consensus on standard test method, a few works on evaluating mode II delamination of stitched composites have been reported. The first experimental work on stitched composites was reported by Sankar and Sharma [21].
Kevlar and glass fibers were used as stitch threads in unidirectional CFRPs, and the
existence of stitch threads increased the energy release rates (G
IIC) by between five and
eight times. Generally, G
IICvalues increased with increasing stitch density, except for
6
Glass-750 stitch thread, where optimum stitch density was probably achieved at the level 2.48 stitches/cm
2. The area method with compliance of the unloading curve was applied to calculate G
IIC. Jain et al. [22] reported that the G
IICvalues were improved by up to 3.3 times when Kevlar and Carbon T-900 were used as stitch threads. Stitch density and stitch thread thickness did not affect G
IIRi(initial energy release rate) but had considerable effects on G
IIRs(steady-state energy release rate). It was also reported that, in some specimens, compression failure occurred at the stitch lines closest to the central loading pin. To avoid premature failure, Wood et al. [24] used tabbed end notch flexural (TENF) specimens, embedding aluminum 2024 T3 sheets of 2 mm thickness at both the upper and lower surfaces of specimens. In their experiment, liquid crystal polymers (1500 denier) were stitched on satin weave carbon fibers with epoxy matrices.
They reported that the energy release rates of stitched composites were 2.25 times those of unstitched composites, and were negligibly affected by stitch distribution.
1.1.3 Numerical Study of Mode II Delamination Testing
Predicting delamination behavior of stitched composites using finite element
simulation has also attracted a lot of attention. Chen et al. [41] predicted the effective
energy release rate of stitched composites under mode II loading using a J-integral
contour. The interaction of a stitch with the surrounding laminates was idealized as an
elastic–perfectly plastic relationship and represented by very short bar elements in a
three-dimensional finite element model. It was concluded that the effective energy
release rate depends strongly on the crack length and the number of stitches in the
bridging zone. However, the predicted energy release rates were not compared with
experimental data. Another numerical study was reported by Wood et al. [24] who used
7
a method called the virtual crack closure technique (VCCT). A stitch was modelled as a spring–damper system composed of three connected rods. A numerical parametric study was conducted to obtain the force–displacement relationship for single-stitched laminates under pure shear loading. The stitch thread and matrix properties were taken as input. This parametric study considered stitch failure at the surface loop, so the frictional force of thread pull-out was taken into account. The predicted energy release rates were close to those determined experimentally (with an error less than 9%). It is important to be noted that the force-displacement relationship of single stitched proposed by Wood et al. [24] had different bridging mechanism with the one reported by Chen et al. [41].
During the last two decades, the use of the cohesive zone model (CZM) to simulate damage in composite materials has expanded rapidly. Compared with VCCT, CZM can predict both damage initiation and propagation, whereas VCCT can only be used to simulate damage propagation. Therefore, CZM has become widely used to simulate not only all the modes of delamination testing [42-44], but also composite structures (e.g. π and T joints [45, 46]), damage in open hole testing [47, 48] and many other situations. However, modeling of mode II delamination test of stitched composites using CZM has not been reported yet.
1.1.4 Finite Element Simulation of Low Velocity Impact Induced Delamination of Stitched Composites
Serge Abrate [49] classifies types of impact loading into low, intermediate, and
high velocity impact (ballistic impact) as shown in Figure 1.6. In case of low velocity
impact loading, the damage mechanisms are usually can be understood through quasi
8 static indentation test.
Figure 1.6. Types of impact loading [49]
Both quasi static indentation (QSI) and low velocity impact (LVI) of stitched composites have already investigated experimentally [50-60]. However, the numerical study of such testing for stitched laminate is very limited. In case of unstitched laminate, many approaches have been proposed to simulate QSI and LVI [61-69]. Among them, the latest report [68, 69] seems to be an effective and efficient approach which use surface based cohesive contact to predict delamination area. Cohesive contact models reduce time consuming because it omits special elements for cohesive zone, and it can be combined with friction contact simultaneously. It is worth noted that the friction force is useful to capture the influence of through thickness compressive stresses during LVI or QSI.
1.2 Objectives of Dissertation
This dissertation aims to understand the effectiveness of stitching process on improving mode II delamination behavior of composite laminate.
The detail objectives of this dissertation are listed below:
1. To establish an experimental method for mode II delamination test that can
9
overcome the problem of specimen premature failure during the test
2. To investigate the effect of stitching parameters on mode II energy release rates (G
IIC), particularly for stitch thread materials called Vectran
3. To understand crack bridging mechanism, deformation and fracture of single stitched laminate under pure shear loading
4. To provide reliable finite element model that can be used as general tools to evaluate any related testing on mode II delamination behavior of stitched laminates such as end notched flexure (ENF), four point end notched flexure (4ENF), and quasi static indentation test.
1.3 Layout of Dissertation
This dissertation is presented in five chapters as follows:
The current chapter, Chapter 1, presents an introduction including literature review, background and objectives of this dissertation. Literature study focuses on stitch bridging mechanism to increase delamination toughness, experimental and numerical study on mode II delamination test, and finite element analysis of low velocity impact induced delamination of stitched composites.
Chapter 2 describes investigation on the effects of stitching parameters (stitch density and stitch thread thickness) on mode II delamination behavior. A relatively new stitch threads material namely Vectran is used. To avoid premature failure of specimens, a modified method called tabbed end notched flexure (TENF) test is used. Furthermore, considering the strong relation between fiber volume fractions and energy release rate, burn-off test is also conducted to measure local fiber volume fraction.
Chapter 3 demonstrates a finite element simulation of tabbed end notched
10
flexure (TENF) test. In this FE model, the interaction between stitch threads and composite laminate become most important. Therefore, a novel interlaminar shear test (IST) of single stitched laminate is performed. The load displacement curve that obtained by IST is then applied to FE model using spring connector element. Moreover, cohesive zone elements are used to simulate crack propagation. A parametric study is also conducted to find suitable cohesive zone parameters. Finally, the simulation results are verified with the experimental data.
Chapter 4 presents a numerical study of using four point end notched flexure (4ENF) test for stitched laminate application. Adopting the modeling techniques in the previous chapter, the capability of using 4ENF test with and without tabs is evaluated.
The results accuracy of tabbed 4ENF is also investigated by comparing the predicted energy release rates with the results of simulation without tabs.
Chapter 5 summarizes the dissertation with conclusion and recommendation for future research.
Additionally, a numerical study on delamination behavior of stitched laminate
under quasi static indentation is also reported in appendix. This simulation is the
extension of the main topic where mode II delamination behavior plays the main rule of
damage propagation.
11
Chapter 2
Effect of stitching parameters on mode II delamination behavior of stitched composites
2.1 Overview
This chapter aims to investigate the effect of stitch thread density and stitch thread thickness for particular stitch thread material namely Vectran. In order to avoid premature failure of specimen during testing, tabbed end notched flexure (TENF) specimen is used. TENF specimens are manufactured by embedded aluminum plates Al 7075-T6 at top and bottom side of the specimen. Four types of stitched laminate are tested with two different stitch densities (3 x 3 mm and 6 x 6 mm) and two different stitched thread thicknesses (200 and 500 denier). Unstitched laminates are also fabricated for comparison. Furthermore, the effect of local fiber volume fraction on mode II delamination behavior is also investigated. The local fiber volume fractions of stitched and unstitched specimen are measured using burn-off test.
2.2 Experimental Work
2.2.1 Material and Specimen Preparation
Both unstitched and stitched composite laminates used in this test were made
with T800SC-24K (Toray Industry), and follow the same lay-up as our group’s previous
work on mode I delamination testing [15], which is 24-ply quasi-isotropic
(+45/0/-45/90)
3S. Toyota Industries Corporation fabricated the stitched composite
laminates using their patented modified lock stitching process [11], as shown in Figure
12
1.3(a). Using this technique, multi-directional (MD) laminate is preferable because it exhibits minimal fiber waviness compared with unidirectional (UD) laminate. The multi-directional preformed fibers can be stretched in many directions during the stitching process to restrain the fiber waviness. It is worth minimizing the fiber waviness in mode II delamination test specimens because it affects the results by slip-locking [70] and emerging mode I processes. Therefore, quasi-isotropic laminates were used in this experimental work.
To investigate the effect of stitch thread thickness, two fibers linear densities were used (200 denier and 500 denier, equal to 0.0158 mm
2and 0.0394 mm
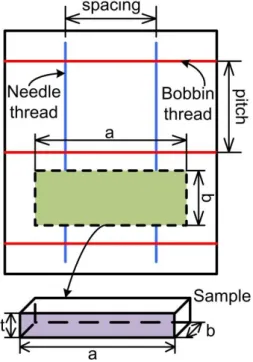
2cross-sectional areas, respectively). Meanwhile the effects of stitch density were evaluated by manufacturing different types of specimens: so-called moderately and densely stitched laminates. Both types have different stitch spacing (Ss) and stitch pitch (Sp), as illustrated in Figure 2.1(a). These moderately and densely stitched laminates had Ss × Sp values of 6 × 6 mm, and 3 × 3 mm, respectively. The stitch density (SD) of the laminates can be calculated using the following expression:
Sp SD Ss
1
(2.1) Kapton film was inserted between the middle layers of the laminates to facilitate the initial crack, and stitching did not occur in the specimen area where the film was inserted, as described in Figure 2.1(b).
After the stitching process, XNR/H6813 Denatite resin (Nagase Chemtex Corp.)
was used to consolidate the composite laminates using a vacuum-assisted resin transfer
molding technique. The same process was used to manufacture the unstitched laminates,
but a wider area was left unstitched, so that the total thickness remained similar between
the stitched and unstitched laminates (the average thickness was 5.16 mm).
13
Figure 2.1: Modified-lock stitching (a) Schematic pattern, (b) A 3 × 3 mm stitched composite laminate with ENF specimen cutting position
The specimens were cut from the plates using a water-cooled cutting machine
(AC-400CF, Maruto) and were 22.4 mm wide and 150 mm long. Five types of
specimens were prepared (Table 2.1).
14
Table 2.1: Types of test specimens
2.2.2 Test Method
Until now, international consensus on the standard procedure of mode II delamination testing has not been achieved, even though collaborative work has been conducted by ESIS (European Structural Integrity Society), JIS (Japan Industrial Standards) group, ASTM (American Society for Testing and Materials) [37]. A review on prospective standard procedures has been reported by Brunner et al. [39]. However, a local standard method already existed (Japanese Industrial Standard JIS K 7086) [40]
and a draft European Standard EN 6034 has been proposed.
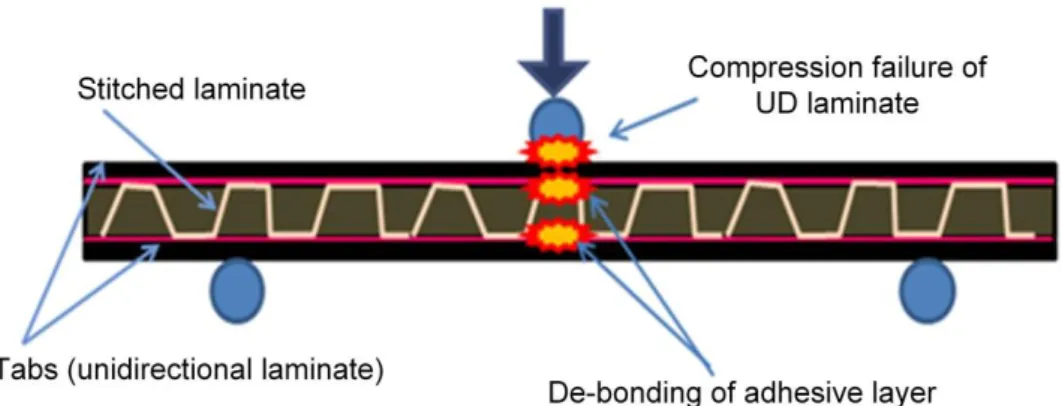
In this experimental work, the ENF test adopted refers to JIS K7086, mainly for the test fixtures and specimen sizes. Modifications have been conducted to overcome many problems on stitched composites. Based on our preliminary test and those of many other reported works [22, 24], stitched composite laminates are prone to failure before crack propagation during ENF testing. To avoid this, tab plates were embedded in top and bottom side of the specimen. However, many problems are still remained such as failure of tab plates and de-bonding between tabs and stitched composites as shown in Figure 2.2.
Specimen Type Unstitched Stitched 6 × 6 Stitched 3 × 3
200d 500d 200d 500d
Code Unstitched 6D2 6D5 3D2 3D5
Stitch pitch (mm) … 6 6 3 3
Stitch spacing (mm) 6 6 3 3
Stitch density (cm
−2) … 2.78 2.78 11.11 11.11
Stitch thread thickness (denier)
… 200 500 200 500
Fiber volume fraction (%) 53.9 53.7 54.2 54.4 54.9
Number of needle thread lines in the width direction
… 4 4 8 8
Number of specimens 6 6 6 6 6
15
Figure 2.2: A schematic premature failure of stitched composite during ENF test (courtesy of JAXA)
A comprehensive design consideration is required to decide tabs material and thickness. Modulus elasticity or flexural modulus of the tab plates should be closed to the modulus elasticity (E
x) of stitched laminate. In case of multidirectional stitched laminate with quasi isotropic orientation (E
xbetween 50 GPa and 80 GPa), aluminum alloy with highest yield strength is the best choice for tab material. Therefore Al-7075 T6 (yield strength about 500 MPa) was chosen in this study.
In order to avoid tabs de-bonding, the shear stress at the adhesive bonding area (between tab and laminate) should be much lower than the shear stress at the delamination interface (middle layer). The following equation could be used as reference to estimate the comparison of shear stress at the two critical positions. The derivation of this equation is written in Appendix B.
2 int
) 2 / (
) (
b a
b a a
mid
(2.2)
where τ
intis the shear stress at adhesive bonding between tab and composite laminate,
τ
midis interlaminar shear stress at the middle layer. Symbols a, b are the thickness of tab
plate and composite laminate, respectively.
16
A parametric study is conducted to select appropriate thickness for particular stitched composite as shown in Table 2.2. Considering the lowest stress at bonding region, aluminum tab with 1 mm thickness is selected in this experiment.
Table 2.2: Parametric study of tab thickness Thickness of
laminate (mm)
Thickness of tab (mm)
τ
int/ τ
mid5.1 1 0.48
1.5 0.60
2 0.69
4.1 1 0.55
1.5 0.67
2 0.74
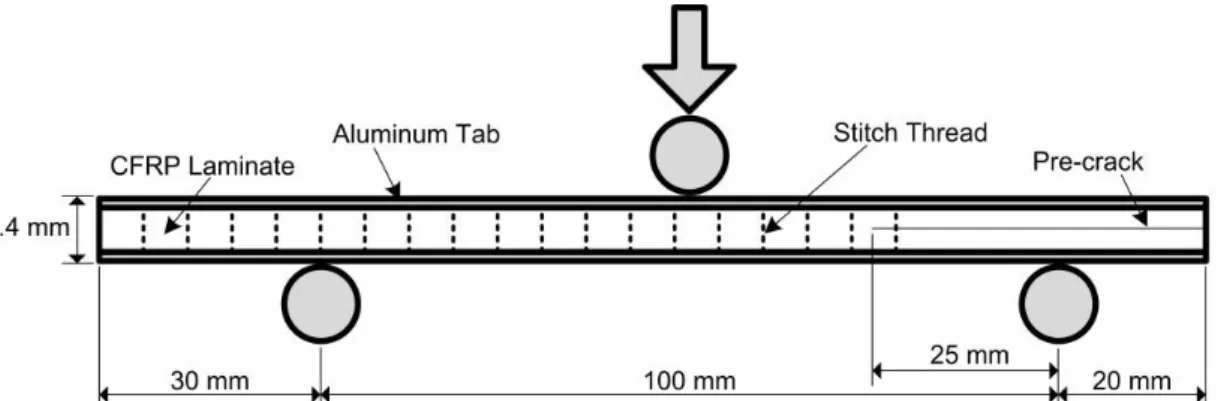
Aluminium tabs were embedded at the upper and bottom surfaces of the specimen using high-strength epoxy (Hysol EA 9309.3NA from Henkel Corporation) [71]. This type of epoxy contains 0.13 mm glass beads for bond-line thickness control, so that the total thickness of TENF specimens can be kept constant at 7.39 mm ± 0.03 mm. A detailed description of the TENF specimen set-up is given in Figure 2.3.
Figure 2.3: Tabbed end notched flexure (TENF) specimen set-up with a specific crack tip position
Additionally, the crack tip was developed using a pre-cracking process.
17
Pre-crack greatly influence the energy release rates of composite laminates [72, 73]
because it removes resin pockets at the end of the inserted film. These resin pockets create a blunt crack tip and increase the crack’s propagation resistance. Prior to ENF testing, a crack opening that was a few millimetres long was created using a sharp, thin razor blade. Then, three-point bend loading was used to propagate the crack to a position between 1 and 3 mm beyond the end of the Kapton film. This pre-ENF test was conducted with a half-span length of 40–45 mm, and the loading point was placed exactly in between the first and second stitch row. Because this pre-ENF test was conducted in the unstitched region, unstable crack propagation occurred, and stopped exactly below the loading point. The greatest advantage of using this pre-cracking process was that the crack tip position was located at the same region for all specimens (between the first and second stitch row), as shown in Figure 2.3. Furthermore, to enhance the contrast of the crack tip, brittle white paint was applied to both edges of the specimens.
Figure 2.4: Mode II delamination test set-up
Subsequently, TENF tests were conducted using a 4505 series Instron machine
with a 10 kN load cell over a total span of 100 mm (Figure 2.3). The specimens were
18
loaded at a constant crosshead speed of 0.5 mm/min until 1 kN was reached, then the crosshead speed was reduced to 0.1 mm/min to enable slow crack propagation. After unloading, the new crack length was measured using a travelling microscope at 25 × magnification and 0.01 mm reading accuracy.
2.2.3 Data Reduction
The energy release rate (G
II) was calculated using the compliance calibration method of Carlsson and Gillespie [72, 74]. This method was selected because it can accommodate tabs being on the specimen without any modifications to the basic G
IIcalculation [75]. The energy release rate can be evaluated by differentiation of compliances with respect to crack lengths when there is no plastic deformation and no damage except for interlaminar fracture. Prior to TENF testing, the specimen compliance was measured for five crack lengths (0, 10, 20, 30 and 40 mm) by applying small loadings until 600 N (0.1 mm/min crosshead speed). Similar procedures were repeated at each specific point where the energy release rate was being measured.
Placement of the specimens was adjusted to obtain a new compliance data, depending on the available space. For example, to measure G
IICat a typical crack length of 45 mm, the compliances were measured at crack tip positions of 37, 41, 45 and 49 mm from the right supporting pin. Then, compliance values were plotted in terms of C/Co versus (a/L)
3, and the slope (m) of the curve was measured.
Energy release rates were calculated as follows:
3 2 2
![Figure 1.3. (a) Stitching process by Toyota Industries. Co. Ltd. [11], (b) Cross-section of typical final product of stitched laminate](https://thumb-ap.123doks.com/thumbv2/123deta/10132355.1966243/17.892.147.767.151.411/figure-stitching-process-toyota-industries-section-stitched-laminate.webp)