GEOGRAPHICAL REPORTS
OF TOKYO METROPOLITAN UNIVERSITY 46 (2011) 43-52
- 43 -
ANALYSIS OF TEMPERATURE AND WIND DISTRIBUTION USING HIGH-RESOLUTION DATA IN KANTO PLAIN ON
AUGUST 16, 2007
Hiroaki YAMATO
Abstract The Automated Meteorological Data Acquisition System (AMeDAS) stations that observed the daily maximum temperature on August 16, 2007, to be approximately 40°C were limited to the northern Kanto Plain. However, numerical studies (Watarai et al. 2009; Shinohara et al. 2009) indicated that the high-temperature area was located at the boundary between Saitama Prefecture and the Tokyo Metropolis. To verify the existence of an area of elevated temperature that was identified by the numerical study, this study analyzed the temperature distributions in the Kanto Plain using high-density temperature data (E-METROS). A boundary between the southerly and northerly winds was located in the southern Saitama Prefecture, and the temperature was elevated just north of this boundary. According to the E-METROS network, the area where the daily maximum temperature exceeded 40 °C was located near Kumagaya and the central Kanto Plain. Thus, the spatial scale of this area was somewhat smaller than that of the area observed by the AMeDAS stations. It is thought that this elevated temperature was influenced by the sea-breeze front that merged at the boundary between the northerly and southerly winds at 14:00 Japan Standard Time (JST). The convergence also became strong near the boundary. Because the convergence strengthened, down flow in front of the sea-breeze front may also have strengthened. The high-temperature area located at the central Kanto Plain may have been caused by enhanced downward flow in front of the sea-breeze front.
Key words: high-resolution observation data, foehn phenomenon, local circulation
1. Introduction
A daily maximum temperature of 40.9 °C was recorded on August 16, 2007 at the AMeDAS station in Kumagaya, Saitama Prefecture. This was the highest temperature recorded in Japan in past 74 years. Some AMeDAS stations in the northern Kanto Plain also recorded the daily maximum temperature of about 40 °C. The AMeDAS station observations indicate that the high-temperatures in the region covering the northern part of the Kanto Plain are due to the foehn wind phenomenon.
According to AMeDAS observation, northwestern winds blew across the northwestern Kanto Plain in the afternoon on this date. These winds were foehn winds from across the Echigo Mountains, and the temperature increased in the areas over which foehn winds blew (Sakurai et al. 2009).
- 44 -
However, recent simulation studies showed a high-temperature region at the convergence zone between the southerly and northerly winds (Watarai et al. 2009; Shinohara et al. 2009). This convergence zone was located in the southern part of Saitama Prefecture. The southerly winds are thought to be caused by the sea breeze; if this is true, the convergence zone may correspond to the sea-breeze front. Previous numerical models showed that the temperature tended to be high in front of the sea-breeze front when the sea breeze passed over an urbanized area (e.g., Dandou et al. 2009). Because the convergence zone was located in the lee of Tokyo, the high-temperature area shown by simulation studies might be shaped for sea-breeze front.
The location of the high-temperature region observed by AMeDAS is different from that reproduced by the simulation. It is possible that a high-temperature region existed in an area that could not be detected by AMeDAS.
This study attempts to verify the existence of a high-temperatures region on August 16, 2007, as indicated by numerical studies. The temperature distribution on the Kanto Plain was analyzed on this date using data from high-resolution surface observations.
2. Data
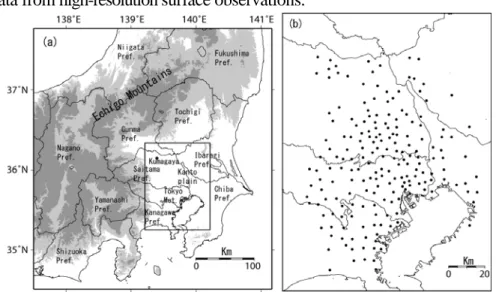
Figure 1a indicates geographical features of the study area. The primary data source is the Extended Metropolitan Environmental Temperature and Rainfall Observation System (E-METROS) that was established in August 2006 (Mikami et al. 2011). E-METROS measures observed air temperature every 10 minute at about 200 observation stations. The distribution of the E-METROS observation stations is shown in Fig.1b. Routine wind observations were conducted by AMeDAS, operated by the Japan Meteorological Agency, and the Atmospheric Environmental Regional Observation System (AEROS), operated by the Ministry of the Environment. Satellite imagery was obtained from The Moderate Resolution Imaging Spectroradiometer (MODIS) sensor. Images were also obtained from the NASA’s homepage (http://rapidfire.sci.gsfc.nasa.
gov/).
Fig. 1 Location of study area (a) and observation map of E-METROS (b). Deep and light gray in (a) represent altitude more than 200 m and 800 m, respectively.
- 45 -
3. Results and Discussion Synoptic condition
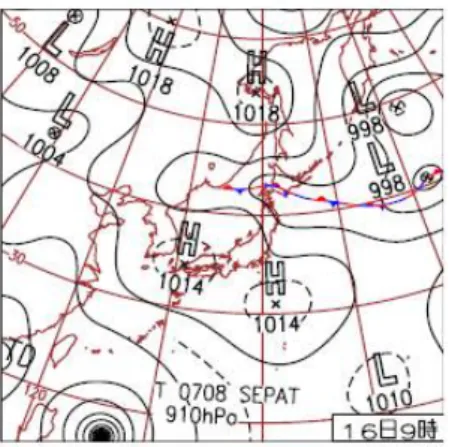
Figure 2 shows the surface weather chart at 09:00 JST on August 16, 2007. A Pacific anticyclone covered the Kanto region; however, the center of the anticyclone was divided into two. The Kanto region was located in a pressure col. This caused transmountain winds to blow over the Kanto Plain, even though the air pressure gradient was small.
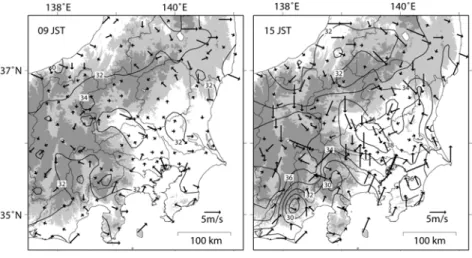
Distribution of temperature and surface winds in central Japan
Figure 3 shows the distribution of temperature and surface winds in central Japan. At 09:00 JST, sea breeze that blow perpendicular to the shoreline were observed on the coasts of Niigata Prefecture, Kanagawa Prefecture, and the Tokyo Metropolitan. Westerly winds were present and the temperature exceeded 34 °C in the northwestern Kanto Plain. At 15:00 JST, northwesterly winds were observed in the northwestern Kanto Plain. Because transmountain winds were observed in the Echigo Mountains, these northwesterly winds were thought to be foehn winds (Sakurai et al. 2009). The temperature exceeded 38 °C in the area where these foehn winds blew.
It is believed that this high temperature in the northwestern Kanto Plain was caused by a foehn phenomenon. On the other hand, southerly/southwesterly sea breezes from the Pacific Ocean were seen at Kanagawa Prefecture and the Tokyo Metropolitan. In these areas, the temperature was lower than in the northwestern Kanto Plain because sea breezes transported cold air from the sea.
Comparison of the daily maximum temperatures observed by AMeDAS and E-METROS The distributions of the daily maximum temperatures observed by E-METROS are compared to those observed by AMeDAS (Fig. 4). The general features were similar: a low daily maximum temperature near the coast and a high daily maximum temperature inland. According to the E-METROS observations, the area where the daily maximum temperature exceeded 40 °C was located around Kumagaya and the central Kanto Plain, whereas according to the AMeDAS observations, the same area was limited to the northern Kanto Plain. The highest daily maximum temperature observed by E-METROS (42.2 °C) was recorded in southern Saitama and southwestern Ibaraki Prefectures, which are located in the central Kanto Plain.
Fig. 2 Surface weather chart at 09:00 JST 16 August, 2007.
- 46 -
The fact that the highest temperature was observed in the central Kanto Plain agreed with results of the numerical study (Watarai et al. 2009; Shinohara et al. 2009). In the present study, we hypothesized that the high-temperature region in the central Kanto Plain was not observed by AMeDAS because it lacks the sampling density needed. The spatial scale of the high-temperature area was clearly smaller than that of the spatial area observed by the AMeDAS stations.
Time variations in temperature and surface winds in the Kanto Plain
During the daily maximum temperature event, the temperature distribution and the surface winds were analyzed in detail by E-METROS and AEROS. The temperature distribution and surface winds are shown in Fig. 5. Northerly winds were seen in Saitama Prefecture, and southerly winds were seen in the southern Kanto Plain. The boundary between the northerly and southerly winds was stagnant near the border of Saitama Prefecture and the Tokyo Metropolitan at from 12:00 to 14:00 JST. The temperature was elevated on the northern side of the boundary. An especially high-temperature, exceeded 40 °C, was recorded near Kumagaya. Because
Fig. 3 Distribution of temperature and winds of AMeDAS.
Fig. 4 Distribution of daily maximum temperature (contour with 2 °C interval) at 16 August, 2007.
Left and right figures are drawn by E-METROS, and AMeDAS, respectively.
- 47 -
Kumagaya is located near the mountains, it is thought that it is strongly affected by the foehn phenomenon.
A discontinuous line of wind was seen on the southern side of the boundary at 12:00 and 13:00 JST (Fig. 5). The discontinuous line corresponded approximately to the sea-breeze front, where the wind velocity of the northern side of the discontinuous line was lower than the wind velocity on the southern side. The sea-breeze front gradually moved northward. The location of the sea-breeze front at 13:00 JST was also identified by a line of cumulus clouds in a MODIS visible image (Fig. 6). This line of cumulus clouds corresponds to the upward flow at the sea-breeze front (Tsunematsu et al. 2009). The front occurred at the boundary between the northerly and Fig. 5 Distribution of temperature and wind on 16 August, 2007. Dashed lines indicate sea breeze front.
Bold lines indicate the border between northerly winds and southerly winds. Dashed and bold lines were determined by wind distribution.
- 48 -
southerly winds because a single wind system covered the southern side of the boundary at 14:00 JST. The convergence also strengthened near the boundary because of the high wind velocity in this area. After the sea-breeze front merged, the boundary started to move northward (Fig. 7). At 14:00 JST, the temperature exceeded 40 °C just north of the boundary as well as around Kumagaya. The area where the temperature exceeded 40°C was located along the boundary. It is thought that this elevated temperature was associated with the sea breeze front.
The sea-breeze front was also detected from the time variation of temperature. The arrows in figure indicate the passage of the sea-breeze front determined from the wind system.
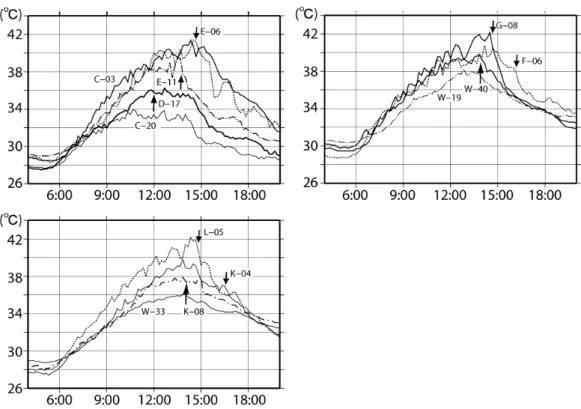
Considering a temperature change with the passage of the sea-breeze front, the time variation of temperature at the observation stations where the sea-breeze front passed was shown in Fig. 8.
The temperature stopped rising or started to drop after the sea-breeze front passed, except at C-20, W-19, and W-33. The passage of the sea-breeze front was decided by the time when the temperature stopped rising or started to drop. The passage of the sea-breeze front at C-20, W-19, and W-33 was not identified because these observation points are located near the coast. At W-19 and W-33, temperature had risen until the early afternoon. W-19 and W-33 are located near downtown Tokyo, it is thought that this temperature rise caused by heat island phenomenon.
The temperature rose rapidly just before the sea-breeze front passed at E-06, E-11, G-08, and L-05 (Fig. 8). The E-METROS stations G-08 and L-05, located just in front of the boundary, recorded a
Fig. 6 Distribution of wind (arrow) at 13 JST and observed clouds of MODIS visible image at 1254 JST on 16 August, 2007. Black circles represent temperature observation point of E-METROS.
Dashed line/bold line indicates sea breeze front/ border between northerly winds and southerly winds.
- 49 -
maximum temperature of 42.2 °C. However, this temperature surge was not seen at D-17, W-40, and K-08. It was found that temperature surge was found after the sea-breeze front merged the boundary and convergence became strong after 14:00 JST.
According to Atkins and Roger (1997), horizontal temperature gradient around the sea-breeze front is large when the convergence near the front is large. The strong down flow was existed in front of the sea-breeze front when sea breeze passed over the urban area (Ohashi and Kida 2002). When sea breeze passed over the urban area, convergence became strong near the sea-breeze front, whereas convergence was weak when the sea-breeze front passed no urban region. This down flow was enhanced when the strong convergence was existed at the sea-breeze front.
As a result, temperature tends to high in front of the sea-breeze front caused by enhanced down flow when the strong convergence was existed. The shape of the area where temperature exceeded 40 °C at just north side of the boundary at 14:00 JST was caused enhanced down flow near the boundary. Therefore, the maximum temperature of 42.2 °C observed by E-METROS was brought by enhanced down flow in front of the sea-breeze front. In this study, the high-temperature region along the sea-breeze front was not only located lee area of central Tokyo, but was located lee area of non-central Tokyo. The high temperature in front of the sea-breeze front was occurred despite the existence of urban. After 15:00 JST, temperature fall was stop or turn to rise temporarily at the area where the boundary passed (F-06 and K-04), Fig. 7 Location of sea breeze front (13:00 JST) and convergence line between northern foehn wind and
southern sea breeze (14:00 to 17:00 JST). Squares indicate temperature observation points used in Fig. 8.
- 50 -
whereas temperature was not fall at C-03, because the boundary did not pass. Temporarily stop of temperature fall was also shown the temperature become high in front of the sea-breeze front.
4. Summary
Temperature distributions on the Kanto Plain on August 16, 2007, were analyzed using high-density temperature data (E-METROS). The high-temperature region was clearly located not only in the northern Kanto Plain but also in the central part of the plain. The highest daily maximum temperature recorded by E-METROS (42.2 °C) was recorded in southern Saitama and southwestern Ibaraki Prefectures. We consider that high temperatures in the central Kanto plain were not observed by the AMeDAS stations because these stations lack sufficient observation density. The spatial scale of the high-temperature area was clearly somewhat smaller than that of the area observed by the AMeDAS stations.
A boundary between northerly and southerly winds existed at the prefectural border between Saitama Prefecture and the Tokyo Metropolitan at 12:00 to 14:00 JST. A sea-breeze front penetrated inland and merged the boundary, and convergence strengthened near the sea-breeze front around 14:00 JST. After the convergence strengthened, temperature surge was seen just before the boundary passed. Because the down flow in front of the sea-breeze front was enhanced when the convergence strengthened, the temperature increased. Therefore, the maximum temperature of 42.2 °C observed by E-METROS was brought by enhanced down flow in front of the sea-breeze front.
Fig. 8 The time series of temperature. Location of observation points are shown in Fig. 7. Arrow indicates passage of sea breeze front/convergence line.
- 51 -
Acknowledgement
My special thanks are due to Prof. T. Mikami for managing and organizing the E-METROS research group. I also express the gratitude for his guidance and encouragement. My thanks are also due to Prof. H. Takahashi for his guidance and encouragement to me.
References
Atkins, N. T. and Roger M. W. 1997. Influence of the synoptic-scale flow on sea breezes observed during CaPE. Mon. Wea. Rev., 125: 2112–2130.
Dandou, A., Tombrou, M., and Soulakellis, N. 2009. The influence of the city of Athens on the evolution of the sea-breeze front. Boundary-Layer Meteorology, 131: 35-51.
Mikami, T., Yamato, H., and E-METROS Research Group. 2011. A case study of distribution of temperature in Tokyo Metropolitan area using high-density temperature observation network (E-METROS). Journal of Geography (Chigaku Zasshi), in press. **
Ohashi, Y. and Kida, H. 2002. Numerical experiments on the weak-wind region formed ahead of the sea-breeze front. J. Meteor. Soc. Japan, 80: 519-527.
Sakurai, M., Shinohara, Y., Mashimo, K. and Sunaga, T. 2009. High temperature exceeding 40 °C of daily maximum temperature in Kanto region in 2007 summer part 1 -A case study on August 15 and 16-. Tenki 56:248-253. *
Shinohara, Y., Mashimo, K., Sakurai, M. and Sunaga, T. 2009. High temperature exceeding 40 °C of daily maximum temperature in Kanto region in 2007 summer part 2 -A reproduction experiment of the daily maximum temperature by JMANHM and the consideration of the high temperature -. Tenki 56:543-548. *
Tsunematsu, N., Iwai, H., Ishii, S., Murayama, Y., Yasui, M., and Mizutani, K. 2009. The formation of sharp multi-layered wind structure over Tokyo associated with sea-breeze circulation. SOLA 5:1-4.
Watarai, Y., Nakagawa, K. and Fukuoka, Y. 2009. Numerical Experiments of the Intense Heat over the Central Kanto Plain in August 2007 Using the Regional Meteorological Model.
Earth Environment Research 11:71-80. **
(*: in Japanese, **: in Japanese with English abstract)