Regional Inequality in Fiscal Capacity and Allocation of Tax Sources: Do Local Allocation Taxes Correct the Inequality?
Takeshi Miyazaki
Associate Professor, Graduate School of Economics, Kyushu University
Abstract
This study examines regional inequality in general revenues and in local taxes, including local income tax, the two types of local corporate tax and local consumption tax, and also discusses the reform of local tax and local allocation tax (which is intended to correct regional inequality). Specifically, the study tabulates figures for such items as the amounts of general revenues per person, intergovernmental transfers (ordinary local allocation tax and local transfer tax), and local taxes at the prefectural and municipal levels with regard to each of the 47 prefectures and analyzes the scale of the inequality using graphs and Gini coefficients. As a result of the analysis, the following findings were obtained. First, local allocation taxes expand the inequality in general revenues per person. Second, the expansion of local corporate taxation widens the inequality in general revenues per person. Third, the reform of the local consumption tax will hardly reduce the fiscal inequality between regions or may even aggravate it. Fourth, reducing local allocation taxes universally will correct the inequality in general revenues per person. These findings suggest that local allocation taxes are expanding the fiscal inequality between regions and that in order to correct the inequality, the reform of local allocation taxes, rather than the expansion of local corporate taxation or the reform of the local consumption tax, should be implemented.
Keywords: General revenues, local allocation tax, local corporate taxes, regional inequality
JEL Classification: H7, H71, H73
I. Introduction
There has been growing awareness of the disparity in fiscal capabilities, more specifically
the undeniable link between inter-regional fiscal disparity and the ensuing disparate levels of
government services experienced. There has been particular attention paid to the skewed tax
bases yielded from regional corporate taxation, leading to major revisions to Japan’s taxation
systems, including the implementation of a special local corporate tax/transfer tax (Chiho
houjin tokubetsuzei/joyozei, in Japanese) in 2008 and establishment of a local corporation tax
in 2014. We may infer that this is closely related to disproportional distributions of tax bases,
from the statement “need to quickly redress inequity in local corporate taxation given that
inequity’s further expansion is likely to arise from increasing current local tax revenue
1” and
“the need to discuss measures for revising tax base disparity through fundamental local consumption tax reform and determining best practices for local corporate taxation.
2”
Disproportional distributions in fiscal capability are considered a problem that must be revised in order to ensure necessary fiscal resources for general revenue resources, as evidenced by the statements that “in order to support fully-functional government services in keeping with each region’s conditions, stable levels of necessary general revenue resources must be secured for those regions
3” and “through FY2018, the basic general revenue levels necessary for operations of local governments including the ones not receiving local allocation tax should be prevented from falling substantially below the levels prescribed by the FY2015 local government fiscal plan, whilst these regional expenditures continue to trend with national general expenditure.”
4This paper, against the backdrop of these conditions, attempts to clarify inter-regional fiscal resource disparities, elucidate disparities in regional tax systems̶including local taxes, double corporate taxations and local consumption taxes, as well as discuss reforms in local tax and local allocation tax systems in order to correct these inter-regional disparities.
Let us begin by observing the kinds of tax reforms that have been recently enacted in attempts to fix inter-regional fiscal disparities. Since 2007, discussions in the Diet, the Council on Economic and Fiscal Policy, the Cabinet Office’s Tax Commission and other forums have raised the issue of needing to minimize skew in local taxes in order to support decentralization of government authority, leading to increased recognition of the need for measures to tackle inter-regional fiscal disproportional distributions. On the 1
stof October, 2008, a special local corporate tax / special local corporate transfer tax was established in the interests of offsetting skew in tax resources and as a preliminary measure until fundamental tax system reform realizes a low-skew regional taxation structure. However, this new taxation scheme was well- understood to be a temporary one that would be abolished in the future. Further, the decision was made in 2008 to offset the disparity between local governments receiving local allocation taxes (receiving governments) and not receiving them (non-receiving governments)̶
incurred by significant growth in non-subsidized governments’ tax resources from the consumption tax rate hike to 8%̶by converting a portion of the corporate residential tax to local allocation tax resources, nationalizing 4.4% of the former (total: 17.3%) as a local corporate tax to be redistributed as the latter. This change in the tax structure reduced total special local corporation taxes by one-third, easing the local enterprise tax. As described in the “2015 Ruling Party Tax Reform Proposal,” for a 10% consumption tax scenario, it was determined that more of the corporate residential tax would be converted for local allocation tax resources and that the special local corporation tax / transfer tax would be abolished.
However, there has also been a long-debated proposal of exchanging consumption taxes
1
Fiscal System Council materials (30-Oct-2015) – unofficial translation
2
FY2016 Budget / Tax Systems, National Governors’ Association, Nov. 2015 – unofficial translation
3
National Governors’ Association (see above)
4
Fiscal System Council materials (see above)
and double local corporate taxation̶or, nationalizing double corporate taxation and enhancing local consumption taxes̶in securing stable fiscal resources necessary for providing a certain level of local government services. Note that as of 2008, when the enterprise tax was redistributed, there was opposition against tax nationalization in the National Governors’ Association on the grounds of decentralized government authority.
However, since redistribution would have led to increased revenue for most regions, there was a sharp contrast in opinions between regions like Tokyo and Aichi, which had abundant fiscal resources, and others. Proposals made by the National Governors’ Association note that it is critical to take corrective action against skewed tax resources.
As more and more kinds of systematic changes have been implemented in attempting to correct inter-regional disparities through redistribution of local taxes, so too has a significant body of research built up regarding these implementations. Jinno (2004) analyzes the effect of tax transfers and tax exchanges between the consumption tax and corporate residential tax rate in pre-trinity reforms on inter-regional tax revenue disparity. Miyazaki (2008) conducts a simulation analysis of consumption and dual corporate taxation tax exchanges, indicating that tax base exchanges do lead to reduced disparity in inter-governmental tax revenues and general receipts. Akai’s (2008) work moves away from tax base exchange-based research and focuses on the implementation of the special local corporation tax / transfer tax, pursuing the potential of reducing inter-regional disparity by revising distribution criteria for the dual corporation tax (corporate residential tax and (local) enterprise tax). However, Tajika and Miyazaki (2011a, 2011b) add considerations of the balance of national and local taxes and the burden on the public, analyzing how tax transfers and allocations change inter-regional disparity. Analysis revealed an increase in public burden yielded from tax transfers from national to local levels due to the existence of receiving bodies, and that in times of poor tax allocation, local allocation taxes must be reduced in order to limit the public burden, further clarifying that uniform local allocation tax cuts would decrease inter-prefectural disparity.
There is also a trove of research analyzing inter-regional disparities in local tax and general fiscal resources from a long-term perspective. Sugahara (2006) utilizes prefectural data from 1972 onward to reveal excess regressivity in local allocation taxes and skewed redistribution effects. Doi (2010) utilizes municipal and prefectural fiscal data between 1955 and 2005 to indicate that while the Gini coefficient for local tax trended down since 1960, the Gini coefficients of general revenue resources and national treasury disbursements increased.
This analysis indicates that although the Gini coefficient has been around 0.1 for general revenue resources in recent years, that figure is lower than the Gini coefficient for local taxes, revealing corrective effects by local allocation taxes on disparity. However, Kobayashi and Okabe (2011) look into prefectural tax skew for the years between 1958 and 2008, indicating that this skew is shrinking as of the 2000s, and that dual corporate taxation and individual residence tax contribute greatly to the skew.
This research aggregates figures on prefectural and municipal levels for all of Japan’s 47
prefectures on the following items: local taxes, intergovernmental transfers (ordinary local
allocation taxes + local transfer taxes), and general revenue resources per person. These
figures will be graphed and analyzed for inter-regional disparities. Disparity magnitude will also be analyzed via use of Gini coefficients. This paper will begin by analyzing local taxation in FY2017 given an unchanging trajectory in corporate tax rates from 2013 and 2015. Fiscal settlement data from prefectures and municipalities will be used to this end, mostly from FY2013, the most recent year from which data is easily obtainable. This analysis accounts for changes in FY2015 and FY2017; for 2015, that includes the local consumption tax rising to 1.7%, its changes in revenue-sharing criteria, reduction in the special local corporation tax / transfer tax by one-third, and establishment of the local corporation tax. For 2017, we take into account the increase in local consumption taxes to 2.2% and abolishment of the special local corporation tax / transfer tax. Note that because the 2016 Ruling Party Tax Reform Proposal had not been distributed at the time of this paper’s analysis, we assume no change in the local corporation tax from its 2015 levels
5.
This paper will continue by positing a number of alternative scenarios for local taxation systems, analyzing tax resource redistribution and inter-regional disparity. The following six scenarios are presented for consideration̶Scenario 1 (50% nationalization of the corporate tax-based tax), Scenario 2 (100% nationalization of the corporate tax-based tax), Scenario 3 (100% distribution of local consumption tax on a population basis), Scenario 4 (increased local consumption taxes & zero dual corporate taxation), Scenario 5 (increased local consumption taxes & decreased intergovernmental transfers) and Scenario 6 (5% reduction in intergovernmental transfers). We establish a FY2017 baseline given unchanged corporate tax-based taxes from FY2015, observing the impact from the above changes. In Scenarios 1 and 2, we analyze local corporation tax expansion given the planned consumption tax increase to 10% and local corporation tax expansion in 2017. In Scenario 3, we consider the potential for correcting inter-regional disparity and presuppose a case whereby local consumption taxes distributed to prefectures are fully distributed on a population basis̶given that distribution to municipalities is already population-based. In Scenario 4, we take a similar case to one discussed by Jinno (2004), one where tax resource allocation is maximized, and analyze a case of setting the dual corporate taxation to zero and increasing local consumption taxes by the exact same amount. In Scenario 5, although we see the same increase in local consumption taxes as in Scenario 4, we instead analyze a case whereby intergovernmental transfers are reduced by the same amount. Scenario 6 analyzes redistributive effects on general revenue resources yielded from across-the-board cuts in intergovernmental transfers.
As mentioned later in this paper, present analysis of inter-regional disparity shows increases in that disparity due to intergovernmental transfers, and local allocation taxes have been reduced previously (during the trinity reforms in the latter half of the 2000s); we establish this scenario with particular attention paid to local allocation tax reform’s impact on redistribution given these facts.
5
The 2016 Ruling Party Tax Reform Proposal, distributed on 16 December 2015, allocates 1.0% of
the corporate residential tax rate to the prefecture and 6.0% to the municipality; a 5.9% local corporation
tax is provided as a revenue source for local allocation taxes. It follows by abolishing the special local
corporation tax / transfer tax, fully replaced by an increase in the enterprise tax rate.
Our analysis reveals the following points. First, we demonstrate that per-capita general revenue disparity increases by intergovernmental transfers. In our analyses of taxation in 2013, 2015 and 2017, we find that Gini coefficients are greater for general revenue resources than for local taxes. Even when we analyze our supposedly-corrective scenarios, all scenarios other than Scenario 5̶where we drastically reduce intergovernmental transfers̶show increasing Gini coefficients due to local allocation taxes. In Doi’s (2010) analysis, he uses data up to 2005 in revealing that Gini coefficients for per-capita local taxes are greater than those for per-capita general revenues and that local allocation taxes served to shrink inter- regional disparity; therefore, we may infer that the relationship between Gini coefficients for local taxes and general revenues has begun to reverse in recent years. To our knowledge, this paper is the first piece of research to find recent expanded inter-regional disparity caused by local allocation taxes.
Second, we find that increased local corporation taxes expand disparity in general revenue resources per person. As indicated in Scenarios 1 and 2, comparison with 2017 levels reveals that nationalization of corporate tax-based taxes increases the Gini coefficient of general revenues. This is because local corporation taxes are used as resources for local allocation taxes and distributed to various regions.
Third, we find that revisions to local consumption tax systems either do very little to reduce fiscal disparity between regions, or in fact make disparity worse. As indicated in Scenarios 3 and 4, disparity fixes through local consumption taxes either have very little effect on or slightly worsen Gini coefficients for general revenues. We particularly note that exchanging dual corporate taxation for local consumption taxes increases inter-regional disparity.
Fourth, we find clear evidence that uniform cuts in intergovernmental transfers do have corrective effects on general revenue disparity per capita. Due to an excessively large regressivity of local allocation taxes, they rather expand per-capita general revenue disparity;
therefore, we realize that across-the-board local allocation tax cuts will reduce disparity.
Our results make it clear that the most effective way to shrink per-capita fiscal disparity
is to conduct across-the-board cuts in local allocation taxes, and that expanding local
corporation taxes and reforming local consumption taxes will have nearly no corrective
effects on inter-regional disparity. Naturally, as local (ordinary) allocation taxes are granted
to fill fiscal resource gaps as calculated by the difference between basic fiscal demands and
basic fiscal revenues, and as these taxes function to ensure fiscal resources to help governing
bodies maintain a certain level of service, these cannot be cut so easily. On the other hand,
our analysis reveals that excessive corrective effects in local allocation taxes expand per-
capita fiscal disparity. Therefore, if the present local allocation tax system is to be maintained,
then it would be more expedient to cut local allocation taxes in the interest of correcting inter-
regional disparity. Looking ahead, there will likely be further discussions on redistribution of
local taxes̶if any sincere effort is to be made in correcting inter-regional fiscal disparities,
it should be understood that efforts should be made in reforming local allocation taxes and
reconsidering distribution methods, rather than in expanding local corporation taxes and
changing local consumption taxes as has been commonly debated so far.
The paper is structured as follows. Section 2 lays out this paper’s methods of analysis.
Section 3 presents and observes results of the analysis. The paper’s conclusions are provided in Section 4.
II. Methods
Let us begin by taking a look at total general fiscal resources. We review disparity in general revenue resources owing to a strong interest prefectural governors’ body
6has in these revenues, which is critical to stable budgetary operations. Note that we consider local taxes, local transfer taxes and ordinary local allocation taxes, which are the major components to make up general revenue resources. We will also review disparity in local taxes since they too are of high interest for local governments as far as securing local tax revenue goes. Further, we will study local consumption taxes and dual corporate taxation under the current discussion of local tax redistribution, as well as their relation to inter-regional disparities. These two items have seen a great deal of discussion lately regarding local tax redistribution. We similarly review other local taxes than those two. Though this paper does analyze effects on disparity by local allocation taxes, we do not refer to local allocation taxes per se, but instead effects yielded by an amalgamation of ordinary local allocation taxes and local transfer taxes that we call “intergovernmental transfers” for the purposes of this paper. The reasons for doing so are because local transfer taxes are nearly proportionally distributed with population and because corrective / distorting effects in disparity largely come from ordinary local allocation taxes.
7In this paper, we generally utilize data from 2013 for regional budget-related data, using 2013 or other nearby years’ data for other data as necessary. For local tax, local transfer tax, and ordinary local allocation tax for each prefecture, we use the Prefectural Financial Survey from 2013. For local tax, corporate residence tax (per capita-based, corporate tax-based), local transfer tax, and ordinary local allocation tax for each municipality, we use the Municipal Financial Survey from 2013. Further, for prefectural corporate residence tax (per capita- based, corporate tax-based), enterprise tax, and consumption tax (post-revenue sharing income), we use the Local Fiscal Statistics Report from 2013. Note that our population figures are derived from the Basic Resident Register as of January 1
stin 2014. Yearly retail sales necessary for local consumption tax calculations come from the 2014 Commerce Statistical Survey, with service industry vs. sole proprietorship income obtained from the 2012 Economic Census for Business Activity
8and employee numbers obtained from the 2014 Economic
6
See the National Governors’ Association (previous footnote).
7
If we presume the same scheme from 2017, we get a Gini coefficient for local transfer taxes per capita of 0.054, with 0.296 for ordinary local allocation tax per capita, which shows ordinary local allocation tax distributed and skewed strongly.
8
This excludes transactions whereby the area of supply, not consumption, is used for booking (e.g.
online purchases).
Census for Business Frame.
Note also that per-capita figures for local consumption taxes, dual corporate taxation, other local taxes, and intergovernmental transfers are calculated for each year and scenario.
We also calculate per-capita figures for local taxes (total of local consumption taxes, dual corporate taxation and other local taxes) and the overarching total general revenue resources, which are a total of all items. We use a cumulative bar graph to express the first four including local taxes and its constituent items per prefecture, and we calculate Gini coefficients of per- capita figures for local consumption taxes, dual corporate taxation, local taxes, other local taxes and general resources.
More specifically, we have made calculations assuming an unchanged corporate tax rate from 2013 and 2015 into 2017. Table 1 tracks changes in each year for local consumption taxes and local corporate taxation. As seen in Table 1, the local consumption tax rate is at 1%
in 2013, with the special local corporation tax / transfer tax established at their initially- planned levels and without the local corporation tax, which would be implemented later. As we have publicly-available figures for the 2013 fiscal year, we use those to make our calculations. In 2015, we see that local consumption tax rates are raised to 1.7%, local consumption tax revenue-sharing more closely considers population, and proportionality is reduced for employee numbers. Further, we can see that the special local corporation tax / transfer tax has decreased by one-third in line with the establishment of the local corporation tax, with 4.4% of corporate tax rates (1.8% from prefectural and 2.6% from municipal) set as
Table 1. Changes in Local Consumption Taxation and Corporate Taxation
2013 2015 2017
Local Consumption Tax
Tax Rate 1% 1.7% 2.2%
Other Notes ・Revenuesharing criteria
changed Local Special Corporation
Tax / Transfer Tax
Approx. 2.6 trillion yen in
2008 Reduced by onethird Repealed
・Distribution: 1/2 population, 1/2 employees Local Corporation Tax
Tax Rate
Total 4.4%
Prefectural 1.8%
Municipal 2.6%
・Corporate tax redistributed as local allocation tax resources Note: Data current as of November 2015, drafted by author.
Further increases
Note: Data current as of November 2015, drafted by author.
the local corporation tax and redistributed as local allocation tax resources
9. For local tax, this paper uses expected income values given existing laws as of 2015, and, for special local corporation tax / transfer tax, uses a value reduced by one-third from 2013 data, with that reduction distributed to prefectures through increases in the enterprise tax. Further, we calculate 2015 local corporate taxes for prefectures and municipalities from 2013 corporate taxes, assuming that the total of them will be distributed as prefectural intergovernmental transfers in 2013. For 2017, we assume an increase in local consumption taxes to 2.2% and abolishment of the special local corporation tax / transfer tax
10. However, according to comments in the 2015 Tax Reform Proposal on local corporation taxes, “the corporate residential tax rate is to become an even greater resource for local allocation taxes”; therefore, though this expansion has a consumption tax hike to 10% as a given, there has been no specifically quantitative decision as yet, so this paper will presume a status quo scenario̶
that is, that the 2015 system will continue to be maintained.
11On local consumption tax rates, we calculate tax revenues based on a 2.2% increase versus expected 2015 revenues. We also assume abolishment of the special local corporation tax / transfer tax and for that tax’s 2013 values to be distributed to prefectures as local enterprise tax. Our calculations for 2013, 2015 and 2017 are based on these presumptions.
Next, we make a series of observations about potential tax system changes in order to potentially contribute to future discussions on policy change with regard to local tax redistribution. Our analysis is based on 2015 corporate taxation̶or, in other words, the 2017 tax system given that the local corporate tax is maintained.
Scenario 1: 50% Nationalization of Corporate Tax-Based Tax
In this scenario, half of the corporate tax-based residential tax (from prefectural and municipal) is moved to the local corporation tax and distributed based on existing local allocation tax share. Since, as previously stated, there is intent to implement policy expanding local corporation taxes along with the 2017 consumption rate tax hike to 10%; this scenario thereby presumes a 50% level moved to local corporation taxes.
9
Receiving government’s general revenues do not normally change under constant basic fiscal demand even if resources of local allocation tax increase. Yet this paper supposes that local allocation taxes increase with the resources of local allocation tax. We do this because it is stipulated that “the local corporation tax is redistributed as allocation tax resources,” and because as many local governments have issued emergency revenue support debt recently, they wish to shrink that debt. For example, in the “Provisional Calculations on Prefectural Revenue/Expense Variation due to Local Consumption Rate Increases” (Prefectural Governors’ Association), the difference between the increase in local consumption taxes and social security-related expenses is supposed to reduce the same amount of emergency revenue support debt.
10
Although it is possible that the increase in local consumption taxes could decrease local allocation taxes, we presuppose (as in footnote 9) that local allocation tax remains constant. In actuality, there was an increase in local consumption taxes in 2015, leading to a slight decrease in emergency revenue support debt and a nearly unchanged level of local allocation taxes (down by approx. 100 billion yen).
11
See footnote 6 for more on the 2015 Ruling Party Tax Reform Proposal’s policy for expansion of
local corporation tax.
Scenario 2: 100% Nationalization of Corporate Tax-Based Tax
This case takes Scenario 1 and pushes it to 100% levels, shifting all of the corporate tax- based tax to local corporation taxes and distributing them as local allocation taxes.
Scenario 3: Full Proportional Distribution of Local Consumption Taxes on a Population Basis In this scenario, we assume a case whereby a proportional distribution of local consumption taxes is based entirely on prefectural population. In this instance, per-capita local consumption tax is equal in all prefectures. At present, local consumption tax distribution to municipalities is already based on population; some have pointed out that there is a problem with cities receiving large distributions under the current system. Changing to a tiered distribution system based on population could address regional inequality. This scenario was devised with this in mind.
Scenario 4: Increased Local Consumption Tax & Zero Dual Corporate Taxation
This scenario sets the dual corporate taxes at zero, replacing it with an equal increase in local consumption taxes. This increases local consumption taxes relative to the prefecture’s existing share of the taxes. As per the Prefectural Governors’ Association’s assertion that
“there must be discussion on fundamental tax system reform and how to correctively adjust tax resource skew, including expanded local consumption taxes and revised local corporate taxation,
12” there have been requests by local governments to increase local distribution of local consumption taxes, a stable fiscal resource, and proceed with nationalization of local corporate tax revenues. Jinno (2004) and others have also proposed reforms called “tax exchanges, ” whereby there is more nationalization of the dual corporate taxes in exchange for expanded local consumption taxes. In this paper, we consider the maximum limit of this tax exchange, whereby this dual corporate taxation is fully nationalized. In this particular scenario, approximately ¥6.6 trillion in dual corporate taxation is nationalized, with local consumption taxes increased commensurately to 4.49%.
Scenario 5: Increased Local Consumption Tax & Reduced Intergovernmental Transfers In this scenario, we increase local consumption taxes by the same amount as in Scenario 4 (approx. ¥6.6 trillion) and instead reduce intergovernmental transfers by the same amount.
All prefectures would see equal percentage cuts in their transfers. Analysis results have made it clear that intergovernmental transfers serve to aggravate inter-regional disparity. Therefore, we established this scenario to analyze what kind of changes would occur in regional inequality by increasing local consumption taxes by the same amount as in Scenario 4 and then reducing intergovernmental transfers by that amount. In this scenario, we are able to reduce local allocation taxes by approximately 38%.
12
National Governors’ Association (see previous footnotes)
Scenario 6: 5% Reduction in Intergovernmental Transfers
In this scenario, we cut all intergovernmental transfers (ordinary local allocation tax + local transfer tax) by 5% uniformly for all prefectures. In the other scenarios, total general revenue resources had been constant; in this one, that amount decreases equally with intergovernmental transfers. I propose this scenario to analyze the corrective effects of reduction in intergovernmental transfers on regional inequality in general revenue resources.
III. Analysis Results
III-1. Inter-Regional Fiscal Disparity in 2013, 2015 and 2017
Next, let us take a look at graphs representing distribution of local taxes and local allocation taxes in 2013, 2015 and 2017, further examining Gini coefficients as indicators of disparity. Figure 1 shows the per-capita values for local allocation taxes and items under local taxes for 2013. In Figure 1, general revenue resource is expressed as the total of local consumption taxes, dual corporate taxation, local allocation taxes and local transfer taxes, and other local taxes. General revenues are low in areas like Saitama, Chiba and Kanagawa Prefectures, with high levels seen in Shimane, Tottori and Kochi Prefectures. Tokyo is noticeable for its significant local tax revenue, though its per capita general revenue is only ranked 15
thand somewhat above the national average. In other local taxes (not including dual corporate tax and local consumption tax), Tokyo is overwhelmingly ahead, and even the
Figure 1. Inequality in Per Capita General Revenue Resources, FY2013
Figure 1. Inequality in Per Capita General Revenue Resources, FY2013 (thousand yen)
Figure 2. Inequality in Per Capita General Revenue Resources, FY2015 (thousand yen)
0 100 200 300 400 500 600 700 800
Hokkaido Aomori Iwate Miyagi Akita Yamagata Fukushima Ibaraki Tochigi Gunma Saitama Chiba Tokyo Kanagawa Niigata Toyama Ishikawa Fukui Yamanashi Nagano Gifu Shizuoka Aichi Mie Shiga Kyoto Osaka Hyogo Nara Wakayama Tottori Shimane Okayama Hiroshima Yamaguchi Tokushima Kagawa Ehime Kochi Fukuoka Saga Nagasaki Kumamoto Oita Miyazaki Kagoshima Okinawa Local allocation tax and local transfer tax Dual corporate tax Local consumption tax The other local taxes
Average
general revenue-poor Kanagawa and Aichi Prefectures have high amounts; however, we see that the general revenue-rich Shimane, Tottori and Kochi Prefectures have extremely low levels of other local taxes. On local consumption taxes, though Tokyo and Osaka have relatively high distributions, they are nearly equivalent, and Tokyo has a markedly higher level of dual corporate taxation, which is also significant in metropolitan areas such as Aichi and Osaka Prefectures. For intergovernmental transfers, we see that this is high in such areas as Shimane, Tottori and Kochi where per-capita local tax is low, and that the effect of these transfers is significant such that the lowest-ranking areas in terms of per-capita local tax amount can be in the top tier of areas in terms of general revenue. Table 2 shows the Gini coefficients for general revenues and the constituent items that comprise local taxes in 2013.
As can be inferred by graph analysis, Gini coefficients are relatively low for local consumption tax, while these coefficients are extremely high for the dual corporate taxation, above 0.15.
The Gini coefficient for total local taxes is therefore 0.092. However, the Gini coefficient for general revenues is 0.095, greater than that of local taxes and showing increasing disparity between prefectures. The surprising discovery here is that local allocation taxes lead to general revenue disparity per capita expanding beyond that of local taxes.
Figure 2 shows the state of distribution of local taxes and intergovernmental transfers per prefecture in 2015. Though an increase in local consumption taxes has increased revenue, primarily for cities, the establishment of the local corporation tax has increased intergovernmental transfers to receiving governments, leading to a mostly even increase in general revenue across all prefectures. As seen in the 2015 Gini coefficients found in Table 2, changes in the distribution methods have shrunk disparity in local consumption taxes; also, given the reduced special local corporation tax / transfer tax, there is significant reduction in Gini coefficients for local taxes. However, there is no change in the Gini coefficient for total
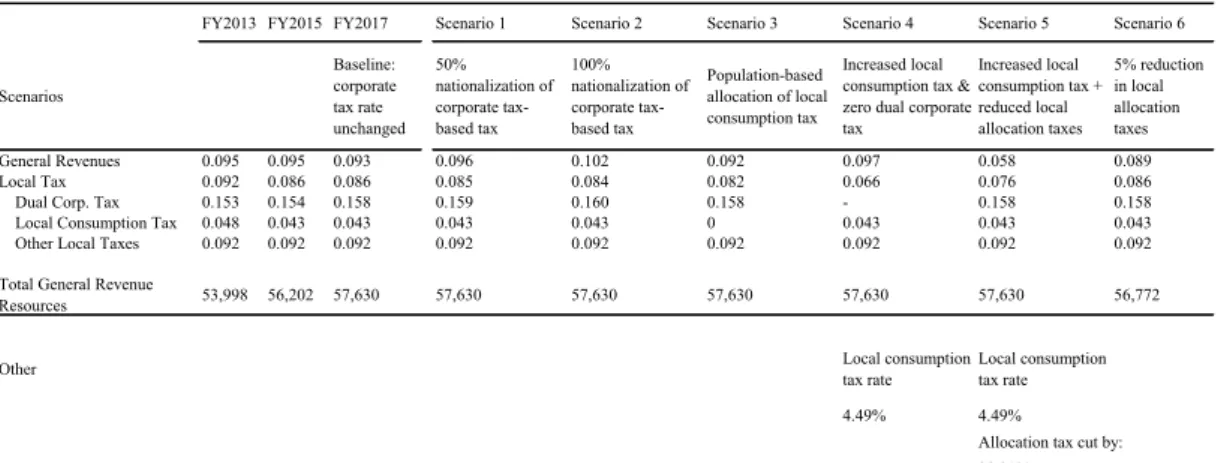
Table 2: Gini Coefficients Per Capita-General Revenues, Local Taxes, Dual Corporate Tax, and Local Consumption Tax
FY2013 FY2015 FY2017 Scenario 1 Scenario 2 Scenario 3 Scenario 4 Scenario 5 Scenario 6
Scenarios
Baseline:
corporate tax rate unchanged
50%nationalization of corporate tax
based tax
100%nationalization of corporate tax
based tax
Populationbased allocation of local consumption tax
Increased local consumption tax &
zero dual corporate tax
Increased local consumption tax + reduced local allocation taxes
5% reduction in local allocation taxes
General Revenues 0.095 0.095 0.093 0.096 0.102 0.092 0.097 0.058 0.089
Local Tax 0.092 0.086 0.086 0.085 0.084 0.082 0.066 0.076 0.086
Dual Corp. Tax 0.153 0.154 0.158 0.159 0.160 0.158 0.158 0.158
Local Consumption Tax 0.048 0.043 0.043 0.043 0.043 0 0.043 0.043 0.043
Other Local Taxes 0.092 0.092 0.092 0.092 0.092 0.092 0.092 0.092 0.092 Total General Revenue
Resources 53,998 56,202 57,630 57,630 57,630 57,630 57,630 57,630 56,772
Other Local consumption
tax rate Local consumption tax rate
4.49% 4.49%
Allocation tax cut by:
38.21%
Note: Gini coefficient calculated on percapita basis. Unit for Total General Revenue Resources is billions of yen. Baseline model for Scenarios 16 is the FY2017 model.
Note: Gini coefficient calculated on per-capita basis. Unit for Total General Revenue Resources is billions of yen. Baseline model for Scenarios 1-6 is the FY2017 model.
Figure 3. Inequality in Per Capita General Revenues, FY2017;
Corporate Tax-Based Tax of FY2015
�����������������������������������������������������������;�����������������������������������
���������������
�
��������������������������������������������������������������������������������������������������������������������
���������������
�
� �
0 100 200 300 400 500 600 700 800
Hokkaido Aomori Iwate Miyagi Akita Yamagata Fukushima Ibaraki Tochigi Gunma Saitama Chiba Tokyo Kanagawa Niigata Toyama Ishikawa Fukui Yamanashi Nagano Gifu Shizuoka Aichi Mie Shiga Kyoto Osaka Hyogo Nara Wakayama Tottori Shimane Okayama Hiroshima Yamaguchi Tokushima Kagawa Ehime Kochi Fukuoka Saga Nagasaki Kumamoto Oita Miyazaki Kagoshima Okinawa Local allocation tax and local transfer tax Dual corporate tax Local consumption tax The other local taxes
Average
Figure 2. Inequality in Per Capita General Revenue Resources, FY2015
(thousand yen)
Figure 2. Inequality in Per Capita General Revenue Resources, FY2015 (thousand yen)
0 100 200 300 400 500 600 700 800
Hokkaido Aomori Iwate Miyagi Akita Yamagata Fukushima Ibaraki Tochigi Gunma Saitama Chiba Tokyo Kanagawa Niigata Toyama Ishikawa Fukui Yamanashi Nagano Gifu Shizuoka Aichi Mie Shiga Kyoto Osaka Hyogo Nara Wakayama Tottori Shimane Okayama Hiroshima Yamaguchi Tokushima Kagawa Ehime Kochi Fukuoka Saga Nagasaki Kumamoto Oita Miyazaki Kagoshima Okinawa Local allocation tax and local transfer tax Dual corporate tax Local consumption tax The other local taxes
Average
0 100 200 300 400 500 600 700 800
Hokkaido Aomori Iwate Miyagi Akita Yamagata Fukushima Ibaraki Tochigi Gunma Saitama Chiba Tokyo Kanagawa Niigata Toyama Ishikawa Fukui Yamanashi Nagano Gifu Shizuoka Aichi Mie Shiga Kyoto Osaka Hyogo Nara Wakayama Tottori Shimane Okayama Hiroshima Yamaguchi Tokushima Kagawa Ehime Kochi Fukuoka Saga Nagasaki Kumamoto Oita Miyazaki Kagoshima Okinawa Local allocation tax and local transfer tax Dual corporate tax Local consumption tax The other local taxes
Average
358 T Miyazaki / Public Policy Review
general revenue resources, which we may infer is from the strongly inequitable impact of local allocation taxes. The increase in local consumption tax rates leads to greater general revenue resources.
Figure 3 shows the state of local taxes and intergovernmental transfers in 2017. Though the increase in local consumption tax rates to 2.2% increases its national average and raises general revenue overall, there is no significant difference to the distribution in 2015. Turning to Gini coefficients, while we can observe slightly increasing Gini coefficients in the dual corporate taxation due to changes in the enterprise tax and corporate tax rates, we do not find any major changes in local taxes and general revenue relative to that seen in 2015.
III-2. Inter-Regional Fiscal Disparity in Scenarios 1-6
We next examine per-prefecture inequality and distribution of taxes and total general revenue resources in 2017, after changes in taxation systems̶including local consumption taxes, dual corporate taxation, local allocation taxes and so on̶using the same system of corporate tax-based tax and local corporate taxes as in 2015 as a baseline. In Scenario 1 and 2, local corporate taxes increased to certain levels of corporate tax-based taxation: 50% for Scenario 1 and 100% for Scenario 2. As seen in Figure 4, having 50% of the tax as local corporate taxes (nationalized) does increase local allocation taxes and total general revenue resources slightly for prefectures with high local corporate tax amounts, compared with the existing system as seen in Figure 3, but we do not observe any major change. Figure 5 shows that full nationalization of corporate tax-based taxes increases total general revenue resources for regions with significant corporate taxes more than does the half nationalization case. Note that because dual corporate taxation is decreasing, we can see decreasing general revenue for Tokyo, which has a great deal of revenue from the dual corporate taxation. Regarding changes in Gini coefficients, we see, as in Table 2, that while there is very little change in local taxes (including the dual corporate taxation) in Scenario 1, there is a slight increase in the Gini coefficient for general revenues. In Scenario 2, though Gini coefficients do decrease for local taxes, we see a considerable 0.006-point rise for general revenues relative to that of Scenario 1, showing serious expansion of disparity. Therefore, since local corporate taxes are distributed to those regions with high local allocation taxes, an expansion in local corporate taxes could in fact serve to aggravate inter-regional inequity.
Figure 6 shows the results of fully distributing local consumption taxes based on population (Scenario 3) given our 2017 baseline model. These results do not reveal any particularly significant change in total general revenue resources in areas with relatively high local consumption taxes like Tokyo, though there are some slight decreases. However, if we look at Scenario 3 in Table 2, we note a 0 Gini coefficient for local consumption taxes and decreased Gini coefficients for local taxes. We also note a 0.001 drop in the Gini coefficient for general revenue, which, while not extremely considerable, does reveal reduced disparity due to this population-proportional policy.
Let us consider Scenario 4, whereby we set the dual corporate taxes at zero and increased
Figure 5. Inequality in Per Capita General Revenues, Scenario 2: Nationalization of All Corporate Tax-Based Tax
Figure 5. Inequality in Per Capita General Revenues, Scenario 2: Nationalization of All Corporate TaxBased Tax (thousand yen)
Figure 6. Inequality in Per Capita General Revenues, Scenario 3: PopulationBased Allocation of Local Consumption Tax (thousand yen)
0 100 200 300 400 500 600 700 800
Hokkaido Aomori Iwate Miyagi Akita Yamagata Fukushima Ibaraki Tochigi Gunma Saitama Chiba Tokyo Kanagawa Niigata Toyama Ishikawa Fukui Yamanashi Nagano Gifu Shizuoka Aichi Mie Shiga Kyoto Osaka Hyogo Nara Wakayama Tottori Shimane Okayama Hiroshima Yamaguchi Tokushima Kagawa Ehime Kochi Fukuoka Saga Nagasaki Kumamoto Oita Miyazaki Kagoshima Okinawa Local allocation tax and local transfer tax Dual corporate tax Local consumption tax The other local taxes
Average
Figure 4. Inequality in Per Capita General Revenues, Scenario 1: Nationalization of Half of Corporate Tax-Based Tax
���������������
�
��������������������������������������������������������������������������������������������������������������������
���������������
�
� �
0 100 200 300 400 500 600 700 800
Hokkaido Aomori Iwate Miyagi Akita Yamagata Fukushima Ibaraki Tochigi Gunma Saitama Chiba Tokyo Kanagawa Niigata Toyama Ishikawa Fukui Yamanashi Nagano Gifu Shizuoka Aichi Mie Shiga Kyoto Osaka Hyogo Nara Wakayama Tottori Shimane Okayama Hiroshima Yamaguchi Tokushima Kagawa Ehime Kochi Fukuoka Saga Nagasaki Kumamoto Oita Miyazaki Kagoshima Okinawa Local allocation tax and local transfer tax Dual corporate tax Local consumption tax The other local taxes
Average
0 100 200 300 400 500 600 700 800
Hokkaido Aomori Iwate Miyagi Akita Yamagata Fukushima Ibaraki Tochigi Gunma Saitama Chiba Tokyo Kanagawa Niigata Toyama Ishikawa Fukui Yamanashi Nagano Gifu Shizuoka Aichi Mie Shiga Kyoto Osaka Hyogo Nara Wakayama Tottori Shimane Okayama Hiroshima Yamaguchi Tokushima Kagawa Ehime Kochi Fukuoka Saga Nagasaki Kumamoto Oita Miyazaki Kagoshima Okinawa Local allocation tax and local transfer tax Dual corporate tax Local consumption tax The other local taxes
Average
360 T Miyazaki / Public Policy Review