( 1 )
連絡先:〒610-0321京都府京田辺市多々羅都谷1-3 同志社大学生命医科学部 アンチエイジングリサーチセンター 教授 米井嘉一(日本語翻訳版)
歩数計使用によるウォーキングのQOL・加齢に関連する諸症状への影響
米井嘉一
1)
、高橋洋子
1)
、日比野佐和子
1)
、渡邊美和子
2)
、吉川敏一
3)
1)同志社大学 アンチエイジングリサーチセンター
2)マリーシアガーデンクリニック
3)京都府立医科大学内科
KEY WORDS:
抗加齢医学、歩数計、心拍数、運動、運動強度
目的:本試験は腕時計型歩数計を使ったウォーキングの身体に及ぼす効果について検討し、運動強度を適度に保つ
補助となる心拍数計測器付きのものと計測器無しのものとで比較した。
方法:健常者31人(平均年齢59.1±5.0、男性17例、女性14例)を試験群15例(男性8例、女性7例)と対照群16例(男
性9例、女性7例)の2群に分けた。試験群は心拍数測機器付腕時計型歩数計を用い、対照群は心拍数測機器の無い
腕時計型歩数計を用いた。すべての参加者は運動強度を40∼60%に保つ口頭指導を受け、1回45分のウォーキング
を週5回、8週間行った。試験前後で身長、体重、体脂肪、血圧、血液生化学を行った。また試験前後で抗加齢
QOL共通問診票による自覚症状の評価をおこなった。
結果:両群合計でウォーキングにより収縮期血圧(前値140.23 ±23.16mmHg)の3.7%低下、女性ではエストロゲ
ン分泌の上昇(37%)を認めた。試験群と対照群の群間比較では、試験群では対照群に比べて、身体症状「だるい」
「耳鳴り」「胃が張る」「便秘」「関節痛」と、心の症状「寝つきが悪い」「くよくよする」の改善効果が有意に
高かった。
結語:心拍数測機器付腕時計型歩数計を用いて運動強度を40∼60%に保つウォーキングの方が口頭指導のみの自己
ペースのウォーキングよりもが望ましいと考えられた。
抄録
Anti-Aging Medicine 5 (1) : 22-29, 2008 本論文を引用する際はこちらを引用してください。 (c) Japanese Society of Anti-Aging MedicineAnti-Aging Medicine 5 (1) : 22-29, 2008
Original Article
The effects of walking with pedometers on quality of life and various symptoms
and issues relating to aging
Yoshikazu Yonei
1), Yoko Takahashi
1), Sawako Hibino
1), Miwako Watanabe
2), Toshikazu Yoshikawa
3) 1) Anti-Aging Medical Research Center, Doshisha University2) Mareesia Garden Clinic
加齢医学(アンチエイジング)の目的は健康長寿の達成に
ある。単に寿命を延ばすのではなく、老化による心身の衰
えを防ぎ、生活の質(QOL; Quality of Life)を高く保ちな
がら、健康で幸せで、美しい人生をまっとうすることを目
的とした医療である
1,2)
。医学的には予防医学に属し、診断
としての老化度判定ドックがあり、治療として食事・運動
などの生活療法や、サプリメント療法、ホルモン補充療法
などの薬物療法がある。このような医学は開業医・勤務医・
産業医など様々な立場の医療従事者に有用となる。近年、
ライフスタイルの中でも肥満という現象が、高血圧・糖尿病・
高脂血症といった生活習慣病の根源になっており、QOLや
健康長寿に好ましくない影響を及ぼしている。
従来からの運動療法、食事療法に加え、近年では統合医療、
代替医療、漢方医療、鍼灸療法、抗加齢医療などという言
葉がしばしば聞かれるようになった。それぞれの療法の有
効性に関する報告は多いにもかかわらず、検討に用いられ
ているパラメーターに共通性がないために、一般医師にとっ
て「どのような症状・疾患に対して、どの程度良いのか」
という基本的疑問が残っているのが現状であろう。
これまで著者らは、人間ドックの評価やサプリメント・
健康食品・医療機器・運動機器・化粧品などの心身に及ぼ
す影響と安全性に肥満に関して、共通のパラメーターを用
いて調査検討を行ってきた
3-5)
。これによって、それらの
製品の有効性に関する程度と限界、そしてスペクトラムが
明確になりつつある。今回は、運動療法の中でも基本的な
ウォーキングに注目し、その身体に及ぼす影響について検
討した。ウォーキングは最も手軽で効果的な方法であり、
疫学的研究からも「1日1万歩」の歩数を確保することが
理想と考えられている。日本人の1日当たりの平均歩数は、
男性7,532歩、女性6,446歩(2004年国民健康栄養調査
6)
)で
ある。ウォーキング時の運動強度は健康増進のために重要
であり、歩行中の心拍数を最大心拍数の40∼60%に保つの
歩行(運動強度40∼60%)がよいとされる
7)
。今回、40∼
60%の運動強度を保つために、ウォーキング中の歩数計測
と脈拍計測が可能な脈拍測定装置付腕時計型歩数計を使用
した群と脈拍測定装置の無い腕時計型歩数計を用い口頭指
導で運動強度40-60%を目指した群に差異について比較検
討を行い、新たな知見を得たので報告する。
歩数計使用によるウォーキングのQOL・加齢に関連する諸症状への影響
はじめに
・対象
TBSラジオ&コミュニケーション「遊学舎」事務局が募
集し、本試験の参加同意を本人から文書により得た者で、
50代から60代の健常者、本試験への参加について同意能力
がある者とした。ホルモン剤、骨粗しょう症剤等の医薬品
を服用している者、糖尿病、著名な肝機能障害等の慢性疾
患のある者、重篤な肝臓、腎臓、心臓、血液疾患及び他の
合併症のある者、その他医師が不適当と判断した者は除外
した。
本試験はマリーシアガーデンクリニック倫理委員会の承
認を得て、ヘルシンキ宣言(200年エジンバラにて改変)な
ら び に 厚 生 労 働 省 に よ る 疫 学 研 究 に 関 す る 倫 理 指 針
(http://www.niph.go.jp/wadai/ekigakurinri/ekigak
urinrih170401/rinrishishinh170401.htm)に従って実施
した。
本試験を開始するにあたり、試験対象者を選定する者は、
試験期間、場所、試験内容、試験方法のみならず、本試験
に参加することにより、期待される利益および起こりうる
不利益についても十分説明した。試験対象者は本試験に参加、
不参加を自由意志で決定でき、また、一度は参加を決意し
たものの、都合により途中で中止しても一切の不利益をこ
うむらないものとした。同意は文書によって取得した。
症例は31例(平均年齢59.1±5.0、男性17例、女性14例)
とし、男女比が均等になるように体重差に従って、試験群
15例(男性8例、女性7例)、対照群16例(男性9例、女性7例)
の2群に分けた。背景因子については2群間で有意差はなかっ
た(
Table 1
)。試験前の測定値についても2群間で有意差は
なかった。
対象と方法
Table 1 The background profiles of participants
Study group Number of subjects Age (y.o.) Men / Women Weight (kg) Height (cm) Body mass index Systolic BP (mmHg) Diastolic BP (mmHg) Total cholesterol (mg/dl) HDL-cholesterol (mg/dl) LDL-cholesterol (mg/dl) Triglyceride (mg/dl) Blood sugar (mg/dl) HbA1c (%) Number of smokers (tabaco/day) Number of drinkers Amount of alcohol(g/day) Exercise(day/week) Compliance Mean ± SD, by t test 58.9 62.2 161.9 23.5 144.5 92.3 205.3 62.7 116.3 141.3 102.9 5.3 1.9 21.0 3.3 85 15 ± 8/7 ± ± ± ± ± ± ± ± ± ± ± 3 ± 7 ± ± ~ 4.7 14.0 9.9 3.5 25.2 16.4 35.9 19.4 31.0 107.7 34.0 1.3 5.2 25.2 2.8 100% Control group 59.3 66.1 162.5 24.9 135.9 88.7 214.0 56.6 130.4 126.1 96.5 5.1 2.0 18.9 2.4 80 15 ± 9/6 ± ± ± ± ± ± ± ± ± ± ± 2 ± 9 ± ± ~ 5.4 13.0 9.0 3.5 20.9 14.2 27.6 13.0 23.4 63.7 11.8 0.4 5.3 18.9 1.8 100% p value 0.831 0.433 0.854 0.289 0.318 0.525 0.392 0.232 0.116 0.734 0.626 0.617 0.945 0.924 0.383試験群では、脈拍測定装置付腕時計型歩数計(Pullusse;
セイコーエスヤード社、東京)
(以下本製品とする)を着用
した上で運動強度40∼60%の範囲の心拍数となるよう運動
負荷を与えた。心拍数がカルボーネンの式
7)
(
Table 2
)によ
り設定された範囲を超えると警告音とともに「ペースを上
げよ」あるいは「ペースを下げよ」の指示を表示するよう
に設定した。対照群では、脈拍測定装置のない腕時計型歩
数計(Pedessa;セイコーエスヤード社、東京)着用し、運
動強度40-60%を保つための口頭指導のみで運動負荷を与
えた。心拍数はウォーキング中適時、橈骨動脈触診による
自己測定により測定した。試験期間は2004年9月26日より
2004年11月21日の8週間とした。本製品の着用及び使用方
法はセイコーエスヤード社が文書もしくは説明会の開催によっ
て、すべての試験参加者に説明した。
・統計解析
それぞれの群で試験前の値(A)と8週間後の値(B)の比較
解析にはpaired t-test, t tetst, Wilcoxon’s signed rank
test を用いた。群間差については、試験前後の比率(B÷A)
をWilcoxon’s signed rank testにて解析した。各測定値
の相関解析にはPearson’s相関係数を求めた。p値<0.05を
もって有意とみなした。
すべての参加者は、本製品の使用方法の説明を受けた後、
その使用方法に従って8週間の間、週5日、1日あたり45分
のウォーキングをコーチなしの単独で行った。ウォーキン
グコースは住居の近隣で自由に選択した。参加者は試験前
後で身長、体重、体脂肪、血圧、血液性化学検査を行った。
これらの検査はマリーシアガーデンクリニックにて医師の
監視下で行った。またすべての参加者は試験前後で抗加齢
QOL共通問診票
3-5)
による評価を行った。体組成はインピー
ダンス法による体組成計(InBody520;BIOSPACE、ソウ
ル、韓国)を用いて測定した。
重篤な他疾患が認められた場合、既往症状
(合併症を含む)
が悪化した場合、その他試験の継続が困難と判断された場合、
試験担当医師の判断により速やかに試験を中止するととも
に適切な処置をとるものとした。
・試験成績
試験群で2名、対照群で1名の脱落者があった。いずれの
場合も個人的理由であり、有害事象はみられなかった。
身体計測値について
Table 3A, 3B
に示した。試験群・対
照群ともに運動後に体水分量
(それぞれ−1.61%、−1.49%)、
筋肉量
(−1.61%、−1.47%)
、除脂肪量
(−1.61%、−1.48%)、
骨格筋量(−1.95%、−2.30%)に有意な減少がみられたが、
その程度は2.3%以内とごくわずかであった(p<0.05)。両
群ともに体脂肪量(3.13%、3.18%)については3%以上の有
意な増加がみられた(p<0.01)。体脂肪率は試験群3.28%
Table 2 Karvonen’s formula
Target heart rate = (Maximum heart rate – Resting heart rate) × Exercise intensity + Resting heart rate
·
Maximum heart rate: [220 – actual age]·
Resting heart rate: pulse rate (heart rate) per minute at rest.·
Exercise intensity: 40% to 60% (0.4 to 0.6)Table 3 Clinical laboratory test data for (A) study group
with watch-type pedometer and (B) control group
after 8 weeks of aerobic walking exercises
(A)
Study groupWeight (kg) Total body water (l) Muscle volume (kg) Lean body weight (kg) Skeletal muscle volume (kg) Body fat amount (kg) Body mass index Body fat percentage (%) Waist-hip ratio Basal metabolism (kcal) Systolic blood pressure(mmHg) Diastolic blood pressure (mmHg) Leukocyte count (/µl) Erythrocyte count (104/µl)
Hemoglobin content (g/dl) Hematocrit (%)
Mean corpuscular volume (fl) Mean corpuscular hemoglobin (pg) Mean corpuscular hemoglobin concentration (%) Platelet count(104/µl) Total protein (g/dl) GOT (IU/l) GPT (IU/l) LDH (IU/L)
Alkaline phosphatase (IU/l) γ-GTP (IU/l) Total bilirubin (mg/dl) Blood creatinine (mg/dl) BUN (mg/dl) Uric acid (mg/dl) Creatine phosphokinase (mg/dl) Total cholesterol (mg/dl) HDL-cholesterol (mg/dl) LDL-cholesterol (mg/dl) Triglyceride (mg/dl) Na (mEq/l) K (mEq/L) Cl (mEq/l) Ca (mg/dl) IP (mg/dl)
Fasting blood sugar (mg/dl) Glycohemoglobin (%) IGF-I (ng/ml) DHEA-s (ng/ml) Cortisol (µg/dl) Estradiol (pg/ml) Total testosterone (pg/ml)
Mean ± SD, *p<0.05, **p<0.01, by paired-t test 62.2 31. 9 43.5 46.1 25.4 16.2 23.5 25.9 0.89 1226.3 144.5 92.3 5561.5 476.5 14.4 44.6 93.8 30.4 32.4 22.7 7.63 25.4 26.5 196.5 271.2 89.5 0.65 0.72 14.8 5.58 139.5 205.3 62.7 116.3 141.3 143.7 4.17 103.5 9.20 3.76 102.9 5.3 161.2 964.3 8.9 303.3 ± ± ± ± ± ± ± ± ± ± ± ± ± ± ± ± ± ± ± ± ± ± ± ± ± ± ± ± ± ± ± ± ± ± ± ± ± ± ± ± ± ± ± ± ± ± 14.0 7.6 10.4 10.9 7.1 5.4 3.5 6.5 0.04 205.6 25.2 16.4 1724.5 59.2 1.7 4.8 5.6 2.0 0.6 6.0 0.65 9.5 15.8 16.7 110.2 123.4 0.18 0.17 2.8 1.72 129.3 35.9 19.4 31.0 107.7 1.9 0.24 3.5 0.30 0.37 34.0 1.3 38.9 512.1 1.7 158.6 62.0 31.4 42.8 45.4 24.9 16.7 23.5 26.69 0.90 1212.7 137.7 90.1 4626.9 466.9 14.4 44.2 95.0 31.0 32.6 23.5 7.65 29.6 27.2 199.0 260.2 80.6 0.65 0.7 13.918 5.51 139.2 209.2 62.6 121.0 126.2 143.5 4.25 103.2 9.05 3.73 103.3 5.3 161.8 939.9 14.1 10.8 293.7 ± ± ± ± ± ± ± ± ± ± ± ± ± ± ± ± ± ± ± ± ± ± ± ± ± ± ± ± ± ± ± ± ± ± ± ± ± ± ± ± ± ± ± ± ± ± ± 62.0 31.4 42.8 45.4 24.9 16.7 23.5 26.69 0.90 1212.7 137.7 90.1 4626.9 466.9 14.4 44.2 95.0 31.0 32.6 23.5 7.65 29.6 27.2 199.0 260.2 80.6 0.65 0.7 13.918 5.51 139.2 209.2 62.6 121.0 126.2 143.5 4.25 103.2 9.05 3.73 103.3 5.3 161.8 939.9 14.1 10.8 293.7 8 week after Before p value 0.215 0.009** 0.009** 0.009** 0.002** 0.025* 0.370 0.005** 0.005** 0.010** 0.028* 0.094 0.011* 0.063 0.480 0.271 0.001** 0.002** 0.125 0.063 0.379 0.062 0.253 0.172 0.121 0.165 0.443 0.054 0.082 0.299 0.499 0.230 0.486 0.134 0.309 0.311 0.138 0.387 0.016* 0.363 0.377 0.318 0.462 0.219 0.042* 0.404
歩数計使用によるウォーキングのQOL・加齢に関連する諸症状への影響
(p<0.01)と3%以上の有意な増加がみられたが、対照群で
は1.25%と有意差はなかった。ウェスト・ヒップ比(0.83%、
0.88%)、基礎代謝量(−1.12%、−1.02%)は両群ともに有
意な変化がみられたが、1.1%以内のわずかな変動であった。
血 圧 に 関 し て は 、 試 験 群 の 収 縮 期 血 圧 の み が 1 4 4 . 5 3 ±
25.16mmHg から137.67±25.22mmHg
(−4.75%、p<0.05)
と有意に低下したが、対照群では有意差はなかった。
血液検査では、試験群の白血球数が−16.8%(p<0.05)、
対照群のクレアチニン−6.19%(p<0.01)の有意変動がみら
れたが、臨床的意義は不明であった。その他、MCV、MCH、
Na、Caに有意ではあるが2%以内のわずかな変動がみられた。
ホルモン検査ではIGF-I、DHEA-s、総テストステロン(男
性のみ)には変動がなかったが、エストロゲン(女性のみ)
は試験群21.58 %、対照群49.15%と、両群ともに有意に上
昇していた(p<0.05)。
Control group Weight (kg) Total body water (l) Muscle volume (kg) Lean body weight (kg) Skeletal muscle volume (kg) Body fat amount (kg) Body mass index Body fat percentage (%) Waist-hip ratio Basal metabolism (kcal) Systolic blood pressure (mmHg) Diastolic blood pressure (mmHg) Leukocyte count (/µl) Erythrocyte count (104/µl)Hemoglobin content (g/dl) Hematocrit (%)
Mean corpuscular volume (fl) Mean corpuscular hemoglobin (pg) Mean corpuscular hemoglobin concentration (%) Platelet count (104/µl) Total protein (g/dl) GOT (IU/l) GPT (IU/l) LDH (IU/l)
Alkaline phosphatase (IU/l) γ-GTP (IU/l) Total bilirubin (mg/dl) Blood creatinine (mg/dl) BUN (mg/dl) Uric acid (mg/dl) Creatine phosphokinase (mg/dl) Total cholesterol (mg/dl) HDL-cholesterol (mg/dl) LDL-cholesterol (mg/dl) Triglyceride (mg/dl) Na (mEq/l) K (mEq/l) Cl (mEq/l) Ca (mg/dl) IP (mg/dl)
Fasting blood sugar (mg/dl) Glycohemoglobin (%) IGF-I (ng/ml) DHEA-s (ng/ml) Cortisol (µg/dl) Estradiol (pg/ml) Total testosterone (pg/ml)
Mean ± SD, *p<0.05, **p<0.01, by paired-t test 66.1 33.2 45.2 47.9 26.1 18.2 24.9 27.3 0.91 1261.8 135.9 88.7 5602.7 449.6 13.9 42.2 94.0 31.0 32.9 22.4 7.35 24.9 25.1 190.9 206.8 50.1 0.73 0.76 15.4 6.03 248.2 214.0 56.6 130.4 126.1 144.6 4.23 104.7 9.01 3.59 96.5 5.1 190.2 1340.7 18.6 407.7 ± ± ± ± ± ± ± ± ± ± ± ± ± ± ± ± ± ± ± ± ± ± ± ± ± ± ± ± ± ± ± ± ± ± ± ± ± ± ± ± ± ± ± ± ± ± 13.0 6.5 8.9 9.3 5.9 6.0 3.5 6.1 0.06 172.6 20.9 14.2 2038.8 47.6 1.4 3.9 3.6 1.4 0.8 6.4 0.44 7.9 13.5 24.6 70.0 35.8 0.35 0.17 3.0 1.46 331.3 27.6 13.0 23.4 63.7 1.3 0.34 1.9 0.28 0.38 11.8 0.4 42.6 763.6 24.8 136.7 65.9 32.7 44.6 47.2 25.5 18.8 24.9 27.6 0.92 1248.9 130.8 86.7 6029.3 445.5 14.1 42.6 95.9 31.6 33.0 23.7 7.44 24.3 26.6 189.4 201.5 49.9 0.73 0.72 14.9 6.04 140.4 215.4 57.4 132.3 136.3 143.1 4.23 103.7 8.93 3.53 99.5 5.1 206.8 1328.5 11.3 27.7 388.8 ± ± ± ± ± ± ± ± ± ± ± ± ± ± ± ± ± ± ± ± ± ± ± ± ± ± ± ± ± ± ± ± ± ± ± ± ± ± ± ± ± ± ± ± ± ± ± 12.5 6.1 8.3 8.7 5.6 6.1 3.5 6.8 0.05 163.4 16.2 13.4 1709.4 43.6 1.3 3.7 3.6 1.4 0.6 5.4 0.32 6.4 14.2 25.2 58.3 48.8 0.38 0.15 3.3 1.69 86.6 23.7 10.9 19.8 82.3 1.4 0.30 1.2 0.29 0.42 10.5 0.5 76.6 779.8 3.9 30.5 121.9 8 week after Before p value 0.297 0.041* 0.041* 0.039* 0.027* 0.049* 0.487 0.240 0.004** 0.040* 0.075 0.248 0.115 0.177 0.114 0.165 0.001** 0.001** 0.318 0.092 0.098 0.302 0.162 0.341 0.212 0.486 0.454 0.001** 0.199 0.474 0.093 0.389 0.282 0.339 0.232 0.002** 0.467 0.037* 0.126 0.307 0.077 0.360 0.081 0.379 0.013* 0.224
(B)
Table 4 Physical symptoms (derived from survey questions)
for (A) study group with watch-type pedometer
and (B) control group after 8 weeks of aerobic
walking exercises
(A)
Study group Tired eyes Blurry eyes Eye pain Stiff shoulders Muscular pain/stiffness Palpitations DyspneaTendency to gain weight Weight loss; thin Lethargy
No feeling of good health Thirst
Skin problems Anorexia Early satiety Epigastralgia Liable to catch colds Coughing and sputum Diarrhea Constipation Headache Dizziness Tinnitus Lumbago Arthralgia Edematous
Easily breaking into a sweat Frequent urination Hot flash Cold skin 2.53 ± 0.83 2.40 ± 1.06 1.60 ± 0.74 2.27 ± 1.22 2.13 ± 0.92 2.00 ± 0.93 2.07 ± 0.88 3.00 ± 1.13 1.53 ± 0.74 2.40 ± 0.91 1.93 ± 0.59 2.00 ± 0.93 1.93 ± 0.73 1.47 ± 0.52 2.00 ± 0.65 1.87 ± 0.52 2.07 ± 0.80 2.20 ± 0.68 1.80 ± 0.77 2.00 ± 0.76 2.00 ± 0.85 1.60 ± 0.74 1.87 ± 0.92 2.07 ± 0.70 2.07 ± 0.88 2.27 ± 0.59 2.73 ± 0.80 2.67 ± 0.72 2.20 ± 0.86 1.93 ± 0.80 2.40 ± 0.99 2.27 ± 0.96 1.60 ± 0.91 2.27 ± 1.10 2.47 ± 1.06 1.87 ± 0.74 1.93 ± 0.80 2.87 ± 1.25 1.53 ± 0.83 1.93 ± 0.70 1.87 ± 0.83 2.00 ± 0.85 2.21 ± 0.7 1.67 ± 0.62 1.80 ± 0.77 1.67 ± 0.72 2.13 ± 0.83 2.27 ± 0.70 1.67 ± 0.72 1.80 ± 0.94 1.93 ± 0.80 1.87 ± 0.92 1.73 ± 0.88 2.20 ± 0.94 2.00 ± 1.13 2.13 ± 0.92 2.40 ± 0.91 2.67 ± 1.05 2.20 ± 0.86 1.87 ± 0.74 Mean ± SD, *p<0.05, **p<0.01, by paired-t test
8 week after Before p value 0.167 0.249 0.104 0.217 0.217 0.273 0.034* 0.387 0.020* 0.094 0.212 0.094 0.396 0.291 0.167 0.094 0.360 0.131 0.291 0.249 0.335 0.273 0.068 0.360
(B)
Control group Tired eyes Blurry eyes Eye pain Stiff shoulders Muscular pain/stiffness Palpitations DyspneaTendency to gain weight Weight loss; thin Lethargy
No feeling of good health Thirst
Skin problems Anorexia Early satiety Epigastralgia Liable to catch colds Coughing and sputum Diarrhea Constipation Headache Dizziness Tinnitus Lumbago Arthralgia Edematous
Easily breaking into a sweat Frequent urination Hot flash Cold skin 2.67 ± 1.11 2.40 ± 0.91 1.53 ± 0.92 2.80 ± 1.42 2.47 ± 1.25 1.47 ± 0.52 1.40 ± 0.51 3.33 ± 1.05 1.27 ± 0.46 2.00 ± 0.85 2.20 ± 1.01 2.00 ± 0.76 2.13 ± 1.06 1.47 ± 0.52 1.87 ± 1.06 1.53 ± 0.52 1.80 ± 0.86 2.20 ± 0.77 1.87 ± 0.92 1.87 ± 1.30 1.87 ± 0.74 2.13 ± 1.06 1.36 ± 0.50 2.53 ± 1.19 1.67 ± 0.72 2.07 ± 0.88 3.27 ± 1.03 2.33 ± 1.05 1.73 ± 0.70 2.13 ± 0.83 2.40 ± 0.99 2.33 ± 0.90 1.67 ± 0.98 2.60 ± 1.30 2.53 ± 0.83 1.60 ± 0.51 1.60 ± 0.63 3.27 ± 1.16 1.27 ± 0.46 2.13 ± 0.74 1.87 ± 0.74 2.07 ± 0.70 2.33 ± 0.90 1.40 ± 0.51 1.73 ± 0.70 1.47 ± 0.52 2.27 ± 0.88 2.33 ± 0.90 1.73 ± 0.88 1.87 ± 1.13 01.8 ± 0.86 1.93 ± 0.80 1.71 ± 0.83 2.53 ± 1.06 2.27 ± 1.22 02.2 ± 0.94 2.93 ± 1.03 2.40 ± 0.83 1.80 ± 0.77 2.33 ± 0.72 Mean ± SD, *p<0.05, **p<0.01, by paired-t test
8 week after Before p value 0.108 0.396 0.167 0.255 0.409 0.167 0.136 0.387 0.273 0.028* 0.291 0.167 0.291 0.273 0.291 0.045* 0.291 0.249 0.387 0.212 0.027* 0.017* 0.217 0.028* 0.335 0.335 0.094
Table 4A, 4B
に示した。試験群では、身体の症状30項目
中1項目「だるい」で有意な改善がみられた。対照群では2
項目「健康感がない」「汗をかきやすい」で有意な改善が
みられた。一方、有意に増悪した項目は、試験群は「肌の
不調」1項目のみであったが、対照群では「風邪をひきや
すい」「耳鳴り」「関節痛」の3項目であった。
Table 5A, 5B
に示した。試験群では、心の症状21項目中2
項目「意欲がわかない」「問題を解決できない」で有意な
改善がみられた。対照群では1項目「いらいらする」で有
意な改善がみられた。一方、有意に増悪した項目は両群と
もみられなかった。
Table 5 Mental symptoms (derived from survey questions)
for (A) study group with watch-type pedometer
and (B) control group after 8 weeks of aerobic
walking exercises
(A)
Study group Irritability Easily angered Loss of motivation No feeling of happiness Nothing to look forward to in life Daily life is not enjoyable Lose confidenceReluctance to talk with others Depressed
Feeling of uselessness Shallow sleep
Difficulty in falling asleep Pessimism
Lapse of memory Inability to concentrate Inability to solve problems Inability to make judgments readily Inability to sleep because of worries A sense of tension
Feeling of anxiety for no special reason Vague feeling of fear
2.27 ± 0.59 2.27 ± 0.59 2.40 ± 0.91 2.07 ± 0.70 1.93 ± 0.80 2.07 ± 0.80 2.13 ± 0.64 2.07 ± 0.59 2.07 ± 0.80 2.07 ± 0.83 2.27 ± 1.03 1.87 ± 0.64 2.47 ± 0.99 3.00 ± 0.65 2.47 ± 0.52 2.27 ± 0.59 2.13 ± 0.64 1.87 ± 0.52 2.33 ± 0.72 2.20 ± 0.68 1.73 ± 0.59 2.13 ± 1.06 2.20 ± 1.01 1.93 ± 0.80 1.93 ± 0.70 1.93 ± 1.03 1.93 ± 0.80 1.93 ± 0.59 2.00 ± 0.76 1.87 ± 0.64 1.79 ± 0.58 2.07 ± 0.80 1.67 ± 0.72 2.20 ± 0.94 02.8 ± 0.68 2.33 ± 0.49 1.87 ± 0.52 1.87 ± 0.52 1.80 ± 0.77 2.13 ± 0.52 1.73 ± 0.59 1.53 ± 0.52 Mean ± SD, *p<0.05, **p<0.01, by paired-t test
8 week after Before p value 0.249 0.360 0.034* 0.217 0.317 0.167 0.396 0.212 0.132 0.136 0.094 0.108 0.167 0.217 0.014* 0.108 0.376 0.167 0.055 0.136
(B)
Control group Irritability Easily angered Loss of motivation No feeling of happiness Nothing to look forward to in life Daily life is not enjoyable Lose confidenceReluctance to talk with others Depressed
Feeling of uselessness Shallow sleep
Difficulty in falling asleep Pessimism
Lapse of memory Inability to concentrate Inability to solve problems Inability to make judgments readily Inability to sleep because of worries A sense of tension
Feeling of anxiety for no special reason Vague feeling of fear
2.13 ± 0.74 2.13 ± 0.74 1.93 ± 0.70 2.07 ± 1.03 2.27 ± 1.10 1.93 ± 0.83 2.13 ± 0.83 1.67 ± 0.72 1.80 ± 0.68 1.93 ± 0.80 2.27 ± 0.96 1.87 ± 0.99 2.13 ± 0.74 2.40 ± 0.83 2.33 ± 0.90 2.13 ± 0.92 1.93 ± 0.59 1.93 ± 0.88 2.53 ± 0.99 1.93 ± 1.93 1.47 ± 0.52 1.67 ± 0.49 1.93 ± 0.46 1.87 ± 0.99 2.40 ± 1.45 2.13 ± 1.30 2.36 ± 1.39 2.00 ± 0.93 1.73 ± 0.70 1.80 ± 0.77 1.67 ± 0.62 2.27 ± 0.96 2.33 ± 1.35 2.20 ± 0.86 2.13 ± 0.83 2.13 ± 0.74 1.93 ± 0.70 1.93 ± 0.70 1.67 ± 0.62 2.33 ± 0.82 1.87 ± 1.87 1.53 ± 0.52 Mean ± SD, *p<0.05, **p<0.01, by paired-t test
8 week after Before p value 0.007** 0.094 0.387 0.194 0.249 0.161 0.317 0.335 0.131 0.084 0.376 0.150 0.167 0.212 0.082 0.255 0.387 0.291
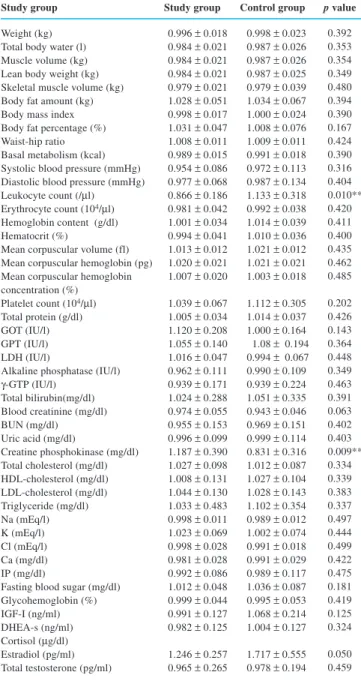
・試験群 vs. 対照群
試験群と対照群との比較を、比率の検定により解析した
(
Table 6A, 6B, 6C
)。すなわち、各項目の「後値÷前値」
Table 6 Comparison of study group with watch-type
pedometer and control group for (A) findings
of clinical laboratory tests, (B) physical
symptoms, and (C) mental symptoms after
8 weeks of aerobic walking exercises
(A) (Clinical laboratory tests)
Study groupWeight (kg) Total body water (l) Muscle volume (kg) Lean body weight (kg) Skeletal muscle volume (kg) Body fat amount (kg) Body mass index Body fat percentage (%) Waist-hip ratio Basal metabolism (kcal) Systolic blood pressure (mmHg) Diastolic blood pressure (mmHg) Leukocyte count (/µl) Erythrocyte count (104/µl)
Hemoglobin content (g/dl) Hematocrit (%)
Mean corpuscular volume (fl) Mean corpuscular hemoglobin (pg) Mean corpuscular hemoglobin concentration (%) Platelet count (104/µl) Total protein (g/dl) GOT (IU/l) GPT (IU/l) LDH (IU/l)
Alkaline phosphatase (IU/l) γ-GTP (IU/l) Total bilirubin(mg/dl) Blood creatinine (mg/dl) BUN (mg/dl) Uric acid (mg/dl) Creatine phosphokinase (mg/dl) Total cholesterol (mg/dl) HDL-cholesterol (mg/dl) LDL-cholesterol (mg/dl) Triglyceride (mg/dl) Na (mEq/l) K (mEq/l) Cl (mEq/l) Ca (mg/dl) IP (mg/dl)
Fasting blood sugar (mg/dl) Glycohemoglobin (%) IGF-I (ng/ml) DHEA-s (ng/ml) Cortisol (µg/dl) Estradiol (pg/ml) Total testosterone (pg/ml) 0.996 ± 0.018 0.984 ± 0.021 0.984 ± 0.021 0.984 ± 0.021 0.979 ± 0.021 1.028 ± 0.051 0.998 ± 0.017 1.031 ± 0.047 1.008 ± 0.011 0.989 ± 0.015 0.954 ± 0.086 0.977 ± 0.068 0.866 ± 0.186 0.981 ± 0.042 1.001 ± 0.034 0.994 ± 0.041 1.013 ± 0.012 1.020 ± 0.021 1.007 ± 0.020 1.039 ± 0.067 1.005 ± 0.034 1.120 ± 0.208 1.055 ± 0.140 1.016 ± 0.047 0.962 ± 0.111 0.939 ± 0.171 1.024 ± 0.288 0.974 ± 0.055 0.955 ± 0.153 0.996 ± 0.099 1.187 ± 0.390 1.027 ± 0.098 1.008 ± 0.131 1.044 ± 0.130 1.033 ± 0.483 0.998 ± 0.011 1.023 ± 0.069 0.998 ± 0.028 0.981 ± 0.028 0.992 ± 0.086 1.012 ± 0.048 0.999 ± 0.044 0.991 ± 0.127 0.982 ± 0.125 1.246 ± 0.257 0.965 ± 0.265 0.998 ± 0.023 0.987 ± 0.026 0.987 ± 0.026 0.987 ± 0.025 0.979 ± 0.039 1.034 ± 0.067 1.000 ± 0.024 1.008 ± 0.076 1.009 ± 0.011 0.991 ± 0.018 0.972 ± 0.113 0.987 ± 0.134 1.133 ± 0.318 0.992 ± 0.038 1.014 ± 0.039 1.010 ± 0.036 1.021 ± 0.012 1.021 ± 0.021 1.003 ± 0.018 1.112 ± 0.305 1.014 ± 0.037 1.000 ± 0.164 01.08 ± 0.194 0.994 ± 0.067 0.990 ± 0.109 0.939 ± 0.224 1.051 ± 0.335 0.943 ± 0.046 0.969 ± 0.151 0.999 ± 0.114 0.831 ± 0.316 1.012 ± 0.087 1.027 ± 0.104 1.028 ± 0.143 1.102 ± 0.354 0.989 ± 0.012 1.002 ± 0.074 0.991 ± 0.018 0.991 ± 0.029 0.989 ± 0.117 1.036 ± 0.087 0.995 ± 0.053 1.068 ± 0.214 1.004 ± 0.127 1.717 ± 0.555 0.978 ± 0.194 Mean ± SD, *p<0.05, **p<0.01, by Wilcoxon’s signed rank test
Control group
Study group p value 0.392 0.353 0.354 0.349 0.480 0.394 0.390 0.167 0.424 0.390 0.316 0.404 0.010** 0.420 0.411 0.400 0.435 0.462 0.485 0.202 0.426 0.143 0.364 0.448 0.349 0.463 0.391 0.063 0.402 0.403 0.009** 0.334 0.339 0.383 0.337 0.497 0.444 0.499 0.422 0.475 0.181 0.419 0.125 0.324 0.050 0.459
歩数計使用によるウォーキングのQOL・加齢に関連する諸症状への影響
についてノンパラメトリク解析を施行した。試験前後で有
意差のみられた体水分量、筋肉量、除脂肪量、骨格筋量、
体脂肪量、体脂肪率、ウェスト・ヒップ比、基礎代謝量の「後
値÷前値」値は、試験群・対照群との間で有意差は認めら
れなかった。試験群のみで有意差のみられた収縮期血圧は、
両群間で有意差はみられなかった。
血液検査では、白血球数、クレアチニン、MCV、MCH、
Na、Caの「後値÷前値」値には両群間に有意差は無かった。
(B) (physical symptoms)
Control group Tired eyes Blurry eyes Eye pain Stiff shoulders Muscle pain/stiffness Palpitations DyspneaTendency to gain weight Weight loss; thin Lethargy
No feeling of good health Thirst
Skin problems Anorexia Early satiety Epigastralgia Liable to catch colds Cough and sputum Diarrhea Constipation Headache Dizziness Tinnitus Lumbago Arthralgia Edematous
Easily breaking into sweat Frequent urination Hot flashes Cold skin 0.936 ± 0.210 0.969 ± 0.269 1.026 ± 0.224 1.068 ± 0.339 1.314 ± 0.861 0.955 ± 0.371 0.942 ± 0.384 0.936 ± 0.266 1.000 ± 0.136 0.788 ± 0.227 0.936 ± 0.330 0.955 ± 0.232 1.083 ± 0.195 1.077 ± 0.277 0.808 ± 0.303 0.846 ± 0.240 1.064 ± 0.640 1.038 ± 0.320 0.910 ± 0.175 0.846 ± 0.240 0.904 ± 0.192 1.282 ± 0.795 0.936 ± 0.417 1.077 ± 0.423 0.949 ± 0.258 0.936 ± 0.459 0.872 ± 0.326 0.962 ± 0.282 1.038 ± 0.348 1.096 ± 0.474 0.976 ± 0.383 1.083 ± 0.613 1.133 ± 0.399 1.118 ± 0.802 1.246 ± 0.758 1.167 ± 0.450 1.233 ± 0.623 1.067 ± 0.574 1.100 ± 0.507 1.200 ± 0.611 0.894 ± 0.190 1.078 ± 0.301 1.198 ± 0.555 1.000 ± 0.327 1.083 ± 0.515 1.000 ± 0.327 1.478 ± 0.923 1.156 ± 0.619 0.994 ± 0.416 1.094 ± 0.382 1.033 ± 0.446 0.971 ± 0.294 1.286 ± 0.469 1.100 ± 0.439 1.400 ± 0.660 1.111 ± 0.371 0.944 ± 0.330 1.128 ± 0.394 1.078 ± 0.356 1.178 ± 0.391 Mean ± SD, *p<0.05, **p<0.01, by Wilcoxon’s signed rank test
Control group Study group p value
0.367 0.261 0.190 0.414 0.413 0.092 0.072 0.219 0.236 0.013* 0.347 0.118 0.233 0.253 0.046* 0.085 0.088 0.264 0.241 0.024* 0.163 0.101 0.025* 0.444 0.012* 0.141 0.282 0.104 0.385 0.314
(C) (mental symptoms)
Control group Irritability Easily angered Loss of motivation No feeling of happiness Nothing to look forward to in life Daily life is not enjoyable Lose confidenceReluctance to talk with others Depressed
Feeling of uselessness Shallow sleep
Difficulty in falling asleep Pessimism
Lapse of memory Inability to concentrate Inability to solve problems Inability to make judgments readily Inability to sleep because of worries A sense of tension
Feeling of anxiety for no special reason Vague feeling of fear
0.910 ± 0.316 0.949 ± 0.292 0.795 ± 0.258 0.949 ± 0.239 1.103 ± 0.587 1.026 ± 0.556 0.897 ± 0.293 0.923 ± 0.351 0.910 ± 0.423 0.769 ± 0.376 0.892 ± 0.206 0.846 ± 0.240 0.869 ± 0.265 0.891 ± 0.199 0.936 ± 0.231 0.821 ± 0.209 0.910 ± 0.400 1.026 ± 0.346 1.051 ± 0.492 0.910 ± 0.689 0.910 ± 0.222 0.833 ± 0.227 0.978 ± 0.320 0.989 ± 0.420 1.361 ± 1.128 0.944 ± 0.265 1.333 ± 1.200 1.078 ± 0.850 1.111 ± 0.416 1.056 ± 0.416 0.989 ± 0.502 1.117 ± 0.510 1.378 ± 0.869 1.089 ± 0.408 0.967 ± 0.424 0.989 ± 0.375 1.033 ± 0.485 1.056 ± 0.392 0.944 ± 0.360 1.100 ± 0.700 1.089 ± 0.660 1.100 ± 0.387 Mean ± SD, *p<0.05, **p<0.01, by Wilcoxon’s signed rank test
Control group Study group p value
0.237 0.402 0.074 0.094 0.192 0.192 0.225 0.103 0.185 0.099 0.067 0.019* 0.050* 0.272 0.326 0.069 0.171 0.274 0.416 0.246 0.060