Vol." pp. 27-32
Copyright@2002 by Chugokugakuen
Original Article
CHUGOKUGAKUEN Journal
http://www.cjc.ac.jp/
Mineral Intake from Sum of Standard Food
Composition Table and That from Our Analytical Data
Masumi Moritsugu*, Michihiro Itano and Yoshie Manabe
Department of Human Nutrition, Faculty of Contemporary Life Science, Chugokugakuen University, Okayama 701-0197, Japan
Daily intakes of some mineral nutrients were calculated from the data in the standard table of food composition in Japan (2000) on trial menus of our students. On the other hand, all of the cooked foods prepared for each trial menu by the students were well mixed and ground down into uniform sludge. The contents of some mineral elements were determined by the atomic absorption spectrophotometry by use of acid sample solutions dissolving ashes of each of the sludgy food samples. Students' menus were of four different styles; Japanese food which was westernized and fatty at present; convenience store food which was composed of daily box lunches, boiled rice-balls, prepared dishes and side dishes from a convenience store; precooked food which was composed mainly of instant noodles or prepared food; and high zinc food which was cooked including a considerable number of high zinc foods except oysters, because they has a long off-season in Japan.
Except for zinc and sodium (chloride), our analysis showed results which were a little lower results than the sum provided by the standard food composition table. The high zinc food provided much zinc, especially in the summed data. The precooked food showed a low zinc level, however, the zinc intake displayed by the analysis of the convenience store food showed a level of the zinc intake second to the analytical result of high zinc food. Eventually, the analytical zinc intake of the convenience store food, 9.1 mg/day, was within the recommended daily zinc intake of Japanese young women from 18 to 29 years old. On the other hand, the precooked food showed a low level of zinc intake, 3.1 and 3.9 mg/day, in the summed intake from the food composition table and our analytical result, respectively. In the present study, renewing the standard table of food composi- tion in Japan, we attempted to clarify the difference between the old and the new standard food composition tables by use of nearly the same menus. Although intakes of calcium, phosphorus and iron seemed to decrease, those of magnesium, zinc and manganese looked like to increase in the summed data from the new table. However, this difference between the new and old tables was indistinct and not consistent but partially unavoidable, because insufficient data of the old standard food table had inevitably induced us to use a local food composition table.
Key Words: Ca, K, Mg, Zn
Introduction
*Corresponding author. Masumi Moritsugu, PhD.
Department of Human Nutrition, Faculty of Contemporary Life Science, Chugokugakuen University, 83-Banchi, Niwase, Okayama 701-0197, Japan
Tel. &FAX; +81 86 293 0247
In the past study, we had suggested that the intake of zinc for Japanese adults was insufficient [5, 8, 9] to the former nutrient requirement which was just the same to
the American requirement level. Prior to the 21st cen- tury, the standard table of food composition in Japan was expanded and revised [7J. At nearly the same time, the nutrient requirements in Japan had been revised as appli- cable to every age group or both sexes [IJ. In this study, we have reinvestigated the intake of several minerals by two means; the sum of mineral data in the students' four menus based on the data of the new standard table of food composition [7
J,
and the analytical data of the sludgy cooked food from nearly the same menus.At present, potassium, calcium, magnesium, zinc and sodium were analyzed. Adding to these minerals, phosphorus, iron, copper and manganese were also compared based on the old [6, 10J and the new [7J food composition tables. From the above list of minerals, zinc is thought to be difficult to make sure their personal adequacy, since zinc deficiency symptoms have many variations, and the symptoms are different with each type of case. Such conditions together with its homeostasis in body fluid [2J make it difficult to diagnose deficiencies.
This suggests that enough intake of zinc like the recom- mended daily level is essential to experience the useful effects of zinc for the promotion of health.
Materials and methods
The daily intake of sodium, potassium, calcium, magnesium and zinc were determined by the atomic absorption spectrophotometry. The sample was a dilute hydrocWoric acid solution which was prepared after an overnight ignition at480 °C in an automatic temperature regulated electric furnace. This ignition temperature was decided by that of rice samples, where the samples could oxidize to get nearly white ash without cadmium loss [3, 4
J.
In the case of rice samples, at a temperature of less than 500aC, substantial cadmium loss did not occur [3, 4J. In the past experiment, the recovery during the drying or ashing procedure had been checked by an automatic temperature regulation system of the electric oven or the electric furnace with a continuous temperature recording system in the furnace and in the ashing samples[3].
The melting temperature and the boiling temperature of metallic cadmium are320.9 °Cand767 °Crespectively.
In the case of zinc, the melting and boiling temperatures are 419.5 °C and 907°C respectively. Therefore, the physically supported dominance can be assured in the ashing course of zinc as like that of cadmium case. At any
rate, our present ignition condition seems to bepracti~ally
enough for zinc, even though several mineral losses have been reported in the course of drying or ashing [2J.
In addition to the seven minerals mentioned, some other minerals such as phosphorus, iron, copper and manganese have been studied in regard to the daily sum according to the data in the old [6, 10
J
or the current standard food composition table [7J.
The sums of newly enriched minerals into the new composition table [7J
is naturally compared on the daily intake level to those of the old table [6J
including another food composition table [10J
consisting of magnesium and micronutrients those were excluded in the old food composition table [6J
onthe daily intake level.
Table 1 indicates the students' menus for used in this investigation. First, the typical Japanese food menu is given. This was cooked mainly by western manner, however, some strange food materials, hardly under- standable to western people, seem to be present. Total foodstuffs used were 55. Next, the convenience store . food menu is shown. Items that can be easily bought at a convenience store an original box lunch and some specially prepared daily dishes from the store are included.
Food materials used were thought to be 32. The third menu is of processed food which includes instant food or precooked food, for example, instant noodles, beef- burger, fried potatoes and potato chips. Easily separable food items were12. The fourth menu is of high zinc food which is composed by several zinc rich food items;
although each one is eaten by our students' own choice.
Therefore, crude cereals, food having a long off-season like oysters, and expensive foods are excluded. Total food items used were 39 exactly.
Results and Discussion
Data based on students' menu have been obtained through the daily sum of respective minerals according to the content of each in the current standard table of food composition in Japan [7
J.
The other kind of data is prepared by the analysis of mixing sludge of the cooked food for each menu. They are the Japanese food in Table 1; the convenience store food which consists of the box lunch, the rice-balls, the prepared dishes and the side dishes from the store; the processed food, consisted of instant foods; and the high zinc food which is composed of many high zinc food items with the exception of oysters which are the highest zinc food. Oysters are not an allTable I Four types of students' menu
I. Japanese food (composed of 55different food items)
Breakfast: Cooked rice (well polished), Seasoned and toasted laver (seaweed, Porphyra yezoensis), Omelet, Grated radish, Lotus rhizome slices, okra and flesh of Japanese plums salad, Fermented salty soy bean paste soup withsake lees.
Lunch: Spaghetti Napolitan, Potage soup of squash, Fruit and yogurt salad.
Supper: Steamed waxy rice with chicken and vegetables locally flavored atHiruzen area, Fermented salty soy bean paste soup with tofu and seaweed(Undaria pinnatifida), Spinach, sesame salad with soy sauce dressing, Silver pomfret slices broiled with yuzu sauce, Sliced lotus rhizome pickles in vinegar.
2.Convenience store food (composed of about32items) Breakfast: Melon bun, Aloe yogurt.
Lunch: Cooked rice balls (with katsuo, with konbu), Salad of Japanese radish.
Supper: A special box lunch for an interval at a theater, Grean tea.
Snack: Baked pudding.
3. Precooked food (composed of about 12items) Breakfast: Instant noodles.
Lunch: Beef-burger sandwich, Soda.
Supper: Instant noodles.
Snack: Potato chips, Soda.
4. High zinc food (composed of net39 items)
Breakfast: Saute of ground meat and mushroom, Fermented salty soy bean paste soup with corbs (a small fresh water shellfish), Salad of immature corn and potato, Grean tea.
Lunch: Pasta with broccoli and shrimp, Rolled spinach and beaf flavored with tomato, Black tea.
Supper: Western style cooked rice with mushrooms, Fermented salty soy bean paste soup with wakame (seaweed, Undaria pinnatifida), Corn sauce gratin with scallopes and broccoli, Herbal roasted shiitake mushroom (Lentinus edodes), Grean tea.
* Italicized word, e.g., P. yezoensis or sake is a scientific or a Japanese name.
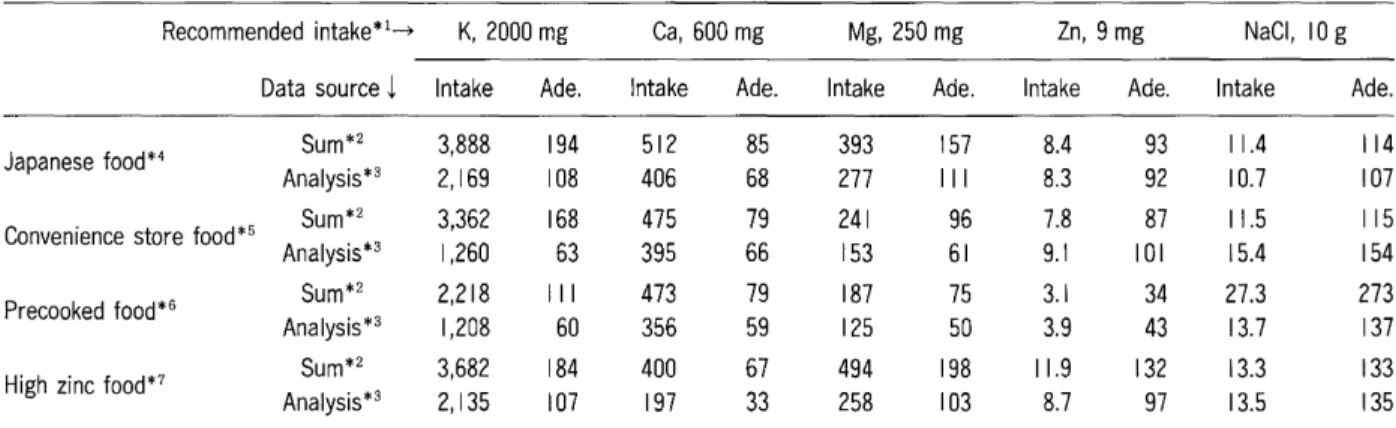
Table 2 Intake of several minerals from sum or analysis, and their rates of adequacy
Recommended intake*l~ K, 2000mg Ca, 600mg Mg,250mg Zn,9mg NaCI, 10g
Data source~ Intake Ade. Intake Ade. Intake Ade. Intake Ade. Intake Ade.
Japanese food*4 Sum*2 3,888 194 512 85 393 157 8.4 93 11.4 114
Analysis*3 2,169 108 406 68 277 III 8.3 92 10.7 107
Convenience store food*5 Sum*2 3,362 168 475 79 241 96 7.8 87 11.5 115
Analysis*3 1,260 63 395 66 153 61 9.1 101 15.4 154
Precooked food*6 Sum*2 2,218 III 473 79 187 75 3.1 34 27.3 273
Analysis*3 1,208 60 356 59 125 50 3.9 43 13.7 137
High zinc food*? Sum*2 3,682 184 400 67 494 198 11.9 132 13.3 133
Analysis*3 2,135 107 197 33 258 103 8.7 97 13.5 135
*lln Japan, the above recommended intakes are available to young adult women from 18to29years. Those are used for the calculation of adequacy, percentage of each intake to the upper recommendation.
*2 Sum shows total intake during a day of each mineral counted from the standard table of food composition in Japan (2,000).
*3 Analysis shows each intake per day based on our analysis using an atomic absorption spectrophotometer.
HJapanese food contains breakfast, lunch and supper those are eaten by our students' own accord as shown in Table I.
*5Convenience food means that the menu is mainly composed by merchandises in a convenient store.
*6 Precooked food mean the case of save time to prepare meals. Precooked or instant food is used.
*7 High zinc food show the case of menu which is composed mainly by high zinc food which is eaten by our students' own accord.
season food. All people do not always like oysters. After all, people who eats oysters can easily get enough zinc during the winter, but not during warm seasons (from
April to the end of October in western Japan). Excluding oysters, there are no food that includes a sufficient amount of zinc to meet the daily requirement easily.
Table 1 includes the daily taken foodstuff numbers composed of each menu, respectively. The foodstuff numbers are as follows: 55 in Japanese food, 32 in convenience store food, 12 in precooked food and 39 in high zinc food. It is common sense that consuming a variety of foods in a day results in a good balanced mineral intake. The relationship between the number of different foodstuffs consumed and adequate mineral intake is clear in the case of Japanese food, convenience store food and precooked food although some exceptions are present as in the case of sodium and
in
high zinc foods (Table 1 and Table 2).Table 2 shows two kinds of intake and adequacy. The upper one is calculated from the sum of intake of potas- sium, calcium, magnesium, zinc and sodium based on the standard table of food composition in Japan [7J. The lower one is calculated from the analytical data. The concentration of each mineral of the fmal sample solution was determined by the comparison between the sample and the standard output of the atomic absorption spectro- photometer. The checked weight before the drying of the sludgy sample and the weight of the whole sludgy sample
were used as the base for the calculation.
Low intake of calcium and high intake of sodium were characterized in table 2. Those seemed to be peculiar to Japanese food. Too many restrictions, such as limited protein intake, about 55 g per ·day, the necessity of animal protein to maintain a certain zinc intake level, control of fat or energy to prevent adult diseases and so on are existent as the problems to solve at once. Such complexity might caused a reduction of a cup ofmilkper day in the diet.
In table 2, it is likely that the analytical data is lower than the sum of the food table data, except two cases of zinc and sodium. There is no comment on the lower values provided from the analysis, because we have no data on the recovery of related minerals from this analyti- cal procedure, and there are many mineral losses during the dryness or ignition process [2J.
About zinc, we think there is no problem in the recovery, because we had had the 'recovery data of cadmium [3Jwhich was similar but somewhat unreliable in physical properties to zinc. Although the method of fmal analysis was different from the present atomic
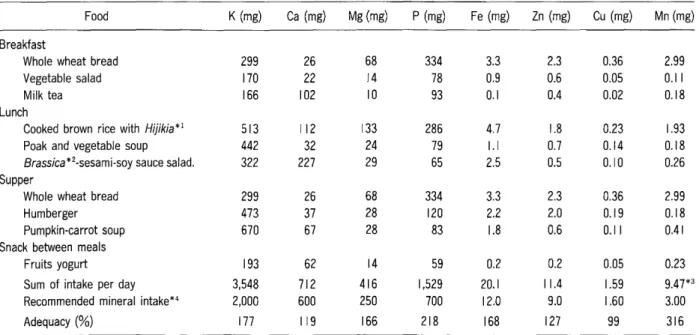
Table 3 Mineral intake from an improved menu for much zinc intake per day (by old table).
Food K (mg) Ca (mg) Mg(mg) P (mg) Fe (mg) Zn (mg) Cu (mg) Mn (mg)
Breakfast
Whole wheat bread 299 26 68 334 3.3 2.3 0.36 2.99
Vegetable salad 170 22 /4 78 0.9 0.6 0.05 0.11
Milk tea 166 102 10 93 0.1 0.4 0.02 0.18
Lunch
Cooked brown rice with Hijikia*l 513 112 133 286 4.7 1.8 0.23 1.93
Poak and vegetable soup 442 32 24 79 1.1 0.7 0.14 0.18
Brassica*2-sesami-soysauce salad. 322 227 29 65 2.5 0.5 0.10 0.26
Supper
Whole wheat bread 299 26 68 334 3.3 2.3 0.36 2.99
Humberger 473 37 28 120 2.2 2.0 0.19 0.18
Pumpkin-carrot soup 670 67 28 83 1.8 0.6 0.11 0.41
Snack between meals
Fruits yogurt 193 62 14 59 0.2 0.2 0.05 0.23
Sum of intake per day 3,548 712 416 1,529 20.1 11.4 1.59 9.47*3
Recommended mineral intake*4 2,000 600 250 700 12.0 9.0 1.60 3.00
Adequacy(%) 177 119 166 2/8 168 127 99 316
*1 Hijikia fujiforme, called "Hijiki" in Japan, is a seaweed, brown algae, including much K, Ca, Mg, Fe and dietary fiber, although availability of each mineral is low.
*2 Brassica campestris, called "Komatsuna" in Japan, is a leafy vegetable, containinng as much vitamins as spinach.
*3 Mn intake is much, it is nearly 10 mg/day, the upper limit intake.
*4 Recommended mineral intakes are for women from 18 - 29 years old. They are used for adequacy calculation.
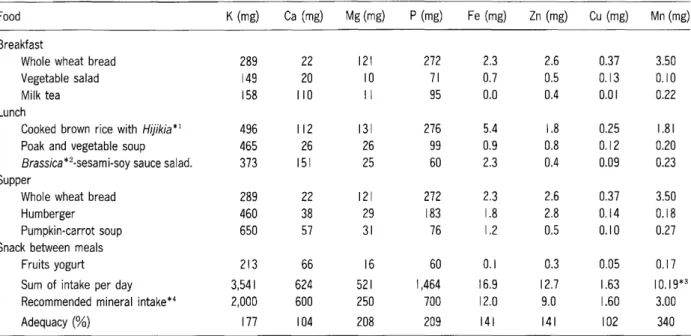
Table 4 Mineral intake from an improved menu for much zinc intake per day (by new table).
Food K (mg) Ca (mg) Mg(mg) P (mg) Fe (mg) Zn (mg) Cu (mg) Mn (mg)
Breakfast
Whole wheat bread 289 22 121 272 2.3 2.6 0.37 3.50
Vegetable salad 149 20 10 71 0.7 0.5 0.13 0.10
Milk tea 158 110 II 95 0.0 0.4 0.01 0.22
Lunch
Cooked brown rice with Hijikia *I 496 112 131 276 5.4 1.8 0.25 1.81
Poak and vegetable soup 465 26 26 99 0.9 0.8 0.12 0.20
Brassica*2-sesami-soy sauce salad. 373 151 25 60 2.3 0.4 0.09 0.23
Supper
Whole wheat bread 289 22 121 272 2.3 2.6 0.37 3.50
Humberger 460 38 29 183 1.8 2.8 0.14 0.18
Pumpkin-carrot soup 650 57 31 76 1.2 0.5 0.10 0.27
Snack between meals
Fruits yogurt 213 66 16 60 0.1 OJ 0.05 0.17
Sum of intake per day 3,541 624 521 1,464 16.9 12.7 1.63 10.19*3
Recommended mineral intake*4 2,000 600 250 700 12.0 9.0 1.60 3.00
Adequacy(%) 177 104 208 209 141 141 102 340
*3 Mn intake is too much, it exceeds 10 mg/day, the upper intake limit. The other * marks are the same to the cases in Table 3.
absorption spectrophotometry, it seems that the present results are sure, even though, a considerable loss seems to be found during drying or ignition in many mineral elements [2]. In any event, when the ignition tempera- ture was lower than 500°C [3
J,
we have no uncertainty about zinc loss during the drying and ashing processes.Although the zinc case shows a low adequacy rates compared with the other minerals except calcium, the analytical data are not always lower than the summed data.
One reason for this is caused by a negligible loss of zinc compounds during the analytical process; that is lucky for us.
In order to know well the new standard table of food composition [7J, we had tried to clarify the difference in quality between the new and the old tables. The menu which was composed of 37 different food items was analyzed by use of both food composition tables. In the old table [6
J,
there were no data about zinc, copper or magnesium basically. Therefore, we used, due to need, another local food composition table [10Jwhich includes magnesium and many other micronutrients. The results are given in Table 3 and 4, respectively. From standpoint of mineral nutrition, it seems that the difference between these tables is insignifIcant, although certain differences are present in the case of each mineral. A common signifIcant point was high intake of manganese. Thecountermeasures to manganese excess seem to be impor- tant, because the low insulin diet depending on food requiring a low blood insulin level is fashionable at the present time.
The commercially prepared box lunches and daily dishes have been analyzed and their low zinc content has been pointed out [IIJ. This experiment showed the same tendency in regard to processed food which was com- posed by not many foodstuffs. Conversely, the study of convenience store food indicated that sufficient amounts of zinc were found, particularly in our analytical data, while the summed data from the current food composition table [7J did not show so much zinc. This result suggest some interesting problems to us. For example, the food menu including boxed lunches points to a low zinc content but in our data shows enough zinc is present, while processed foods exhibit a low level of zinc.
Acknowledgment The authors thank to Mr. Richard J. Lemmer, a lecturer at the Chugokugakuen who has read this manuscript carefully, and to Misses Hirakawa, A., Masuda, A., akita, H. and Ono, Y. who have cooperatedinthis study for a year up to March 2002, at the Department of Human Nutrition of the Chugoku Junior College.
References
I. Council of Public Health, Section of Health Promotional Nutrition,
Ministry of Health, Labor and Welfare: Nutrient Requirement in Japan. - Standard of Food Intake -,6th revised, Government Printing Office, Ministry of Finance. Tokyo (1999).
2. Mills CF et ai, Sandstrom AB et al. and Iyengar BS et al:
Bioavailability and interactions, Zinc, and analytical methodology in
"Trace Elements in Human Nutrition and Health". World Health Organization, Geneva, Switzerland. Macmillan/Ceuterick, Belgium (1996) pp. 22-46, 72-104 and 233-264.
3. Moritsugu M: An applied method for cadmium analysis of rice by colorimetric microdetermination with dithizone. Nogaku Kenkyu. The Ohara Institutes for Agricultural Biology, Okayama University (1964) 50, 67-77. (in Japanese)
4. Moritsugu M: A Study on combination of glutelin with cadmium in rice grain. Berichte des Ohara Instituts fUr landwirtschaftliche Biologie, Okayama Universitat (1964) 12: 252-260. (in English)
5. Moritsugu M, Yokoyama J, Sasaki A, Suga Y, Itano M, Ko Sand Shimada Y: A study of mineral intake of students of our college, especially in regards to the intake of zinc. J Chugoku Jr Coli (1998) 29, 21-30. (in Japanese)
6. Resources Council, Ministry of Education, Culture, Sports, Science and Technology, Japan: Standard Table of Food Composition in Japan, Fourth Revised Edition. Government Printing Office, Ministry
of Finance. Tokyo (1998).
7. Resources Council, Ministry of Education Culture, Sports, Science and Technology, Japan: Standard Table of Food Composition in Japan, 5th Revised Edition, Government Printing Office, Ministry of Finance.
Tokyo (2000).
8. Sasaki A, Itano M and Moritsugu M: Insufficient intake of inorganic micronutrients in our junior college students. J Chugoku Jr Coli (1999) 30, 89-97. (in Japanese)
9. Sasaki A, Ko S, Itano M and Moritsugu M: Studies on vitamin and dietary fiber intake in our junior college students, - combined with intake of inorganic nutrients -. J Chugoku Jr Coli (2000)31, 63-74.
(in Japanese)
10. Suzuki Y and Tanushi S: Table of trace element contents in Japanese foodstuffs. Daiichi Shuppan, Tokyo (1993).
II. Takamura H, Kondo S, Okano E, Ogino M, Matsuzawa K, Yamanaka Sand Matoba T: Problems on mineral contents of commercially prepared box lunches (Bentou) and daily dishes (Souzai). J Home Ec Jap (1999)50, 377-387. (in Japanese with English summary) Accepted March 29, 2002.