INVITED SURVEY PAPER
Special Section on Medical ImagingMachine Learning in Computer-Aided Diagnosis of the Thorax and Colon in CT: A Survey
Kenji SUZUKI
†a), Member
SUMMARY Computer-aided detection (CADe) and diagnosis (CAD) has been a rapidly growing, active area of research in medical imaging. Ma- chine leaning (ML) plays an essential role in CAD, because objects such as lesions and organs may not be represented accurately by a simple equation;
thus, medical pattern recognition essentially require “learning from exam- ples.” One of the most popular uses of ML is the classification of objects such as lesion candidates into certain classes (e.g., abnormal or normal, and lesions or non-lesions) based on input features (e.g., contrast and area) ob- tained from segmented lesion candidates. The task of ML is to determine
“optimal” boundaries for separating classes in the multi-dimensional fea- ture space which is formed by the input features. ML algorithms for clas- sification include linear discriminant analysis (LDA), quadratic discrimi- nant analysis (QDA), multilayer perceptrons, and support vector machines (SVM). Recently, pixel/voxel-based ML (PML) emerged in medical image processing/analysis, which uses pixel/voxel values in images directly, in- stead of features calculated from segmented lesions, as input information;
thus, feature calculation or segmentation is not required. In this paper, ML techniques used in CAD schemes for detection and diagnosis of lung nod- ules in thoracic CT and for detection of polyps in CT colonography (CTC) are surveyed and reviewed.
key words: machine learning in medical imaging, computer-aided diag- nosis, classification, pixel-based machine learning, lung nodule, colorectal polyp, CT colonography
1. Introduction
CAD [1], [2] has been a rapidly growing, active area of research in medical imaging. CAD is defined as detec- tion and/or diagnosis made by a radiologist/physician who takes into account the computer output as a “second opin- ion” [2]. Evidence suggests that CAD can help improve the diagnostic performance of radiologists/physicians in their image interpretations [3]–[6]. Consequently, many in- vestigators have participated and developed CAD schemes such as those for detection of lung nodules in chest radio- graphs (also known as chest x-rays; CXRs) [7]–[10] and in thoracic CT [11]–[14], those for detection of microcal- cifications/masses in mammography [15], breast MRI [16], and breast US [17], and those for detection of polyps in CTC [18]–[21].
A CADe scheme of lesions in medical images gener- ally consists of two major components: (1) identification of lesion candidates and (2) classification of the identified candidates into lesions or non-lesions. Segmentation of the organ of interest is the first necessary step before the
Manuscript received June 10, 2012.
Manuscript revised December 4, 2012.
†The author is with the Department of Radiology, The Univer- sity of Chicago, Chicago, IL 60637, USA.
a) E-mail: [email protected] DOI: 10.1587/transinf.E96.D.772
identification of lesion candidates. The development of the first component, the identification of lesion candidates, gen- erally aims at obtaining a high sensitivity level, because the sensitivity lost in this step cannot be recovered in the later step. The second component, the classification of the iden- tified candidates, is very important, because it determines the final performance of a CAD scheme. The development of the second component aims at removing as many non- lesions (i.e., false-positive (FP) detections in the first step) as possible while minimizing the removal of lesions (i.e., true- positive detections in the first step). Minimizing FPs is very important, because a large number of FPs could adversely affect the clinical application of CADe. A large number of FPs is likely to confound the radiologist’s task of image interpretation and thus lower radiologist efficiency. In ad- dition, radiologists may lose their confidence in CADe as a useful tool. The evaluation of the standalone performance of a developed CAD scheme is the last step of CAD de- velopment, and the evaluation of radiologists’ performance with the use of the developed CAD scheme is the important last step in CAD research.
ML plays a very important role in a CAD scheme, be- cause tasks on medical images in a CAD scheme require
“learning from examples (or data).” Objects in medical im- ages such as lesions and organs may be too complex to be represented accurately by a simple equation. Modeling of such complex objects often requires a number of parameters that have to be determined by examples or data. For exam- ple, a lung nodule is generally modeled as a solid sphere, but there are nodules of various shapes and nodules with internal inhomogeneities, such as spiculated nodules and ground-glass nodules. A polyp in the colon is modeled as a bulbous object, but there are also polyps which have a flat shape [22], [23]. Thus, CAD schemes need “learning from examples or data” to determine a number of parameters in a complex model. ML has been used in the second major step of a CAD scheme, i.e., classification of identified le- sion candidates into certain classes (e.g., abnormal or nor- mal, lesions or non-lesions, and malignant or benign) based on input features (e.g., contrast, area, and circularity) ob- tained from segmented lesion candidates (This class of ML is referred to as feature-based ML, or simply as a classifier).
The task of ML here is to determine “optimal” boundaries for separating classes in the multi-dimensional feature space which is formed by the input features.
ML algorithms for classification include LDA, QDA,
multilayer perceptron (one of the most popular artificial
Copyright c 2013 The Institute of Electronics, Information and Communication Engineers
neural network (ANN) models) [24], and support vector machines [25]. Such ML algorithms have been applied to lung nodule detection in CXR [26] and thoracic CT [12], [27], classification of lung nodules into benign or malig- nant in CXR [28] and thoracic CT [29], and polyp detec- tion in CTC [18], [30]. Recently, as available computational power has increased dramatically, PML emerged in medi- cal image processing/analysis which uses pixel/voxel values in images directly, instead of features calculated from seg- mented regions, as input information; thus, feature calcu- lation or segmentation is not required. PML has also been used in the classification of the identified lesion candidates in CAD schemes.
In this paper, ML techniques used in CAD schemes for detection and diagnosis of lung nodules in CT and for de- tection of polyps in CTC are surveyed and reviewed. Sur- vey papers for CAD in thoracic CT have been published, including one for lung image analysis in CT with empha- sis on a comprehensive survey for computer analysis of the lungs [31], one for CAD in thin-section CT [32], one for CAD in CT with emphasis on CAD performance [33], one for CAD in CT with emphasis on performance comparisons with clinical aspects [34], and one for CAD in both thoracic CT and CTC with emphasis on a methodological overview of major steps in CAD schemes [35]. This present paper focuses on surveys and comparisons of ML techniques in CADe and CADx schemes in thoracic CT and CTC.
2. Classes of Classification Techniques in CAD
There are three classes of classification techniques that have been developed and used in CAD schemes: feature-based classifiers (or feature-based ML), PML, and non-ML-based methods that are defined as methods that do not use ML techniques, such as a procedure that uses a geometrical re- lationship in a non-learning way. Non-ML methods are not surveyed in this paper.
2.1 Feature-based Classifiers
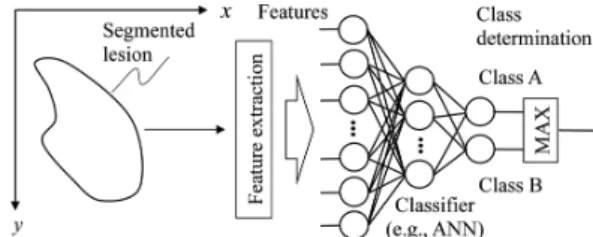
When an ML algorithm is used for classification, it is gen- erally called a classifier. A standard classification approach based on a classifier such as a multilayer perceptron is illus- trated in Fig. 1. First, target lesions are segmented by using a segmentation method. Next, features are extracted from the segmented lesions. Features may include morphologic (or shape-based), gray-level-based (including histogram- based), and texture features. Then, extracted features are entered as input to an ML model such as a multilayer per- ceptron [24]. The ML model is trained with sets of input fea- tures and correct class labels. A class label of 1 is assigned to the corresponding output unit when a training sample be- longs to a certain class (e.g., class A), and 0 is assigned to the other output units (e.g., classes B, C, etc.). In the case of two-class classification, one output unit instead of two out- put units is often used with the output value 0 being class A, and 1 being class B. After training, the class of the unit with
Fig. 1 Feature-based ML (feature-based classifier) for classification of a detected and segmented lesion.
the maximum value is determined to be the corresponding class to which an unknown sample belongs. For details of feature-based classifiers, refer to one of many textbooks in pattern recognition such as [24], [25], [36], [37].
There are several important issues to be considered in the design of ML techniques: generalization, over-fitting, curse of dimensionality, training data annotation, and fea- ture selection.
Generalization in ML is the ability of a trained ML model to perform on unseen cases. The generalization per- formance of the ML model is estimated by using cases in a test database, which is often lower than the performance for training cases. How to design an ML model with a high generalization performance is an important topic, which is closely related to the over-fitting issue. If an ML model is trained with only a small number of cases, the generaliza- tion ability will be lower, because the ML model may fit only the training cases. This is known as “over-training”
(or “over-fitting”) [38]. Over-fitting occurs when the num- ber of training cases is too small to determine parameters in the ML model sufficiently. For achieving a high general- ization performance, a large number of training cases, e.g., 400–800 cases, is generally required for an ANN in a CADs scheme [39]. For detailed information, please refer to the literature such as [37], [40].
How to estimate the generalization performance with a finite number of testing cases is an important topic as well.
To estimate the generalization performance better, resam- pling schemes such as leave-one-out cross validation, N-fold cross validation, and bootstrapping are often employed [40].
The curse of dimensionality [41] is referred to as the follow- ing phenomenon: As the dimensionality of the input feature space for a ML model increases subject to the number of input features, the number of training samples required for the ML model increases exponentially. For detailed infor- mation, please refer to the literature such as [40]. To avoid the curse of dimensionality, feature selection and/or dimen- sionality reduction techniques are often utilized.
Annotating training cases is also an important topic,
because the annotation is expensive or time-consuming
when the number of training cases is large. There are meth-
ods for reducing the annotation labor or annotation itself in
the general ML field, but the quality of annotation (or de-
termining “gold standard”) is more important in the CAD
research area. In order for the study to be clinically mean-
ingful, “gold standard” annotations (or labels) have to be
determined by using more reliable / accurate examinations, e.g., the “gold standard” for lung nodule presence in screen- ing CT should be established by using their confirmation in upper-level follow-up examinations such as diagnostic CT or high-resolution CT (HRCT).
Feature selection has long been an active research topic in ML, because it is one of the main factors that determine the performance of a classifier. It avoids the curse of di- mensionality by reducing the input dimension to the clas- sifier. In general, many features are extracted from seg- mented lesions as the classifier input. Not all of the fea- tures, however, would be useful for a classifier to distin- guish between lesions and non-lesions, because some of them might be highly correlated with each other or redun- dant; some of them may not be strongly associated with the given classification task. For designing a classifier with high performance, it is crucial to select “effective” features.
In the field of CADe research, one of the most popular feature selection methods is a stepwise feature selection based on Wilks’ lambda. The method has been applied in various CADe schemes because of its simplicity [12], [29], [42]. The Wilks’ lambda criterion is good for LDA, but not necessarily for nonlinear classifiers. One of the most widely used deterministic feature selection methods is se- quential forward or backward floating selection (SFFS or SBFS) [43]. SBFS was used for selection of input fea- tures for ANNs [44], [45]. SFFS was used for feature selec- tion combined with various classifiers such as Na¨ıve Bayes, SVMs, and AdaBoost [46] in di ff erent CADe schemes. Re- cently, Xu and Suzuki proposed SFFS coupled with an SVM for selection of the most relevant features that maximize the area under the receiver-operating-characteristic (ROC) curve (AUC) [47].
2.2 Pixel/voxel/patch-Based Machine Learning (PML) Recently, as available computational power has increased dramatically, pixel / voxel / patch-based ML (PML) [35] emerged in medical image processing/analysis, which uses pixel/voxel values in images directly instead of features calculated from segmented regions as input information; thus, feature cal- culation or segmentation is not required. Because PML can avoid errors caused by inaccurate feature calculation and segmentation, the performance of PML can potentially be better for subtle/complex lesions than that of common feature-based classifiers.
There are three classes of PMLs: neural fil- ters [48]–[50] (including neural edge enhancers [51], [52]), convolution neural networks (NNs) [53]–[57] (including shift-invariant NNs [58], [59]), and massive-training artifi- cial neural networks (MTANNs) [19], [60]–[63] (including multiple MTANNs [12], [49], [50], [60], [64], [65], a mix- ture of expert MTANNs [20], [66], a multi-resolution MTANN [61], a Laplacian eigenfunction MTANN (LAP- MTANN) [67], a massive-training support vector regression (MTSVR), and a massive-training Gaussian process regres- sion [68]). For details of the architectures and applications
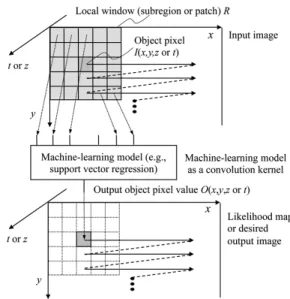
Fig. 2 Architecture of an MTANN (a class of PML) consisting of an ML regression model (e.g., linear-output ANN regression and support-vector regression) with sub-region (local window or patch) input and single-pixel output.
of PMLs in medical imaging, refer to a survey paper on PMLs [35].
By extending the neural filter and the neural edge en- hancer, two-dimensional (2D) MTANNs [11], which are a class of a PML based on an ANN regression model, have been developed for accommodating the task of dis- tinguishing a specific opacity from other opacities in med- ical images. The MTANN learns the relationship between input images and corresponding “teaching” images (i.e., ideal or desired images) to distinguish lesions from non- lesions (i.e., FPs). The MTANN is trained with a massive number of subregions/subvolumes extracted from input im- ages together with teaching pixels; hence the term “mas- sive training”. The architecture of an MTANN is shown in Fig. 2. A 2D MTANN consists of a linear-output mul- tilayer ANN regression model, which is capable of operat- ing on voxel data directly [51], [52]. The MTANN is trained with input images / volumes and the corresponding “teach- ing” images/volumes for enhancement of a specific pattern and suppression of other patterns. The input to the MTANN consists of voxel values in a sub-region/volume (local win- dow or patch) extracted from an input image/volume. The class of MTANNs has been used for classification, such as FP reduction in CAD schemes for detection of lung nod- ules in CXR [7] and CT [5], [11], [12], distinction between benign and malignant lung nodules in CT [65], and FP re- duction in a CAD scheme for polyp detection in CTC [19], [20], [66]–[68]. The MTANNs have also been applied to pattern enhancement and suppression such as separation of bones from soft tissue in CXR [61], [62], and enhancement of lung nodules in CT [63].
3. Classification in CAD of the Thorax
Lung cancer continues to rank as the leading cause of cancer
deaths in America and other nations such as Japan. The number of lung cancer deaths in each year is greater than the combined number of breast, colon, and prostate can- cer deaths in the United States [69]. Because CT is more sensitive than CXR in the detection of small nodules and of lung carcinoma at an early stage [70]–[72], lung can- cer screening programs are being investigated in the United States [73], Japan [70], [71], and other countries with low- dose (LD) helical CT as the screening modality. Evi- dence suggests that early detection of lung cancer may allow more timely therapeutic intervention and thus a more fa- vorable prognosis for the patient [71], [74]. Helical CT, however, generates a large number of images that must be read by radiologists / physicians. This may lead to “in- formation overload” for the radiologists/physicians. Fur- thermore, radiologists / physicians may miss some cancers during interpretation of CT images. Therefore, a CAD scheme for detection of lung nodules in LDCT images has been investigated as a useful tool for lung cancer screening.
Classification is a major component in CAD schemes for detection and diagnosis of lung nodules in CT. CAD schemes for detection of lung nodules in thoracic CT (i.e., CADe) generally consists of two major steps: (1) identifica- tion of nodule candidates, followed by (2) classification of the identified nodule candidates into nodules or non-nodules (i.e., normal anatomic structures). The second major step in a CADe scheme aims at classification of the nodule candi- dates identified in the first step into nodules or non-nodules, whereas a CAD scheme for diagnosis (often abbreviated as CADx) aims at classification of the detected nodules (either by a computer or by a radiologist) into benign or malignant nodules.
3.1 Detection of Lung Nodules
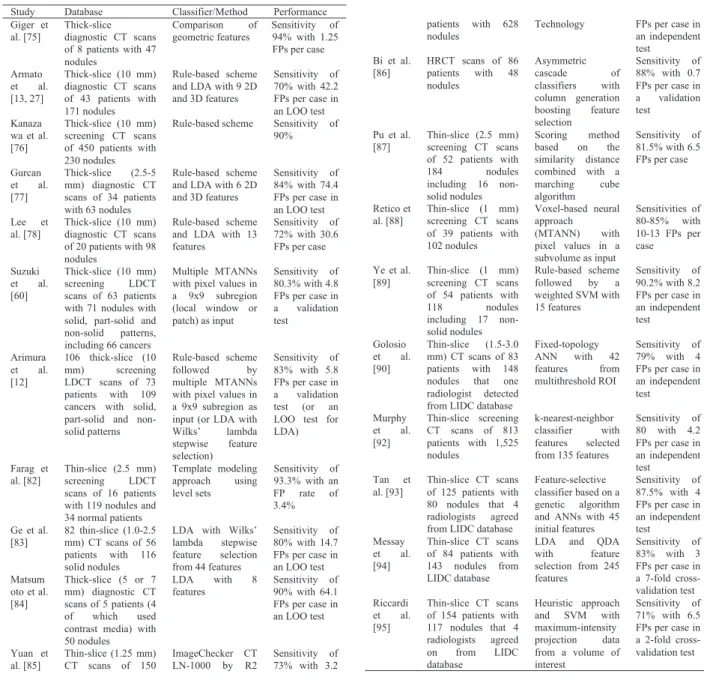
Technical developments of the classification step in CADe schemes for detection of lung nodules in CT are summarized in Table 1. In 1994, Giger et al. [75] developed a CADe scheme for detection of lung nodules in CT. In 1999, Armato et al. [13], [27] extended the method to include 3D feature analysis, a rule-based scheme, and LDA for clas- sification. They evaluated the performance of their scheme with a leave-one-out cross-validation (LOO) test. Kanazawa et al. [76] employed a rule-based scheme with features for classification in their CADe scheme. Gurcan et al. [77] em- ployed a rule-based scheme based on 2D and 3D features, followed by LDA for classification. Lee et al. [78] employed a simpler approach which is a rule-based scheme based on 13 features for classification. Suzuki et al. [60] developed a PML technique called an MTANN for reduction of a sin- gle source of FPs and a multiple MTANN scheme for reduc- tion of multiple sources of FPs that had not been removed by LDA. This MTANN approach did not require a large num- ber of training cases: the MTANN was able to be trained with 10 positive and 10 negative cases [79]–[81], whereas feature-based classifiers generally require 400–800 train- ing cases [79]–[81]. Arimura et al. [12] employed a rule-
based scheme followed by LDA or by the MTANN [60]
for classification. Farag et al. [82] developed a template- modeling approach that uses level sets for classification. Ge et al. [83] incorporated 3D gradient field descriptors and ellipsoid features in LDA for classification. Matsumoto et al. [84] employed LDA with 8 features for classification.
Yuan et al. [85] tested a commercially available CADe sys- tem (ImageChecker CT, R2 Technology, CA). Bi et al. [86]
developed an asymmetric cascade of classifiers for classifi- cation. Pu et al. [87] developed a scoring method based on the similarity distance of medial axis-like shapes for clas- sification. Retico et al. [88] used the MTANN approach (i.e., a PML technique) for classification. Ye et al. [89] used a rule-based scheme followed by a weighted SVM for clas- sification. Golosio et al. [90] used a fixed-topology ANN for classification, and they evaluated their CADe scheme with a publicly available database from the Lung Image Database Consortium (LIDC) [91]. Murphy et al. [92] used a k- nearest-neighbor classifier for classification. Tan et al. [93]
developed a feature-selective classifier based on a genetic al- gorithm and ANNs for classification. Messay et al. [94] de- veloped a sequential forward selection process for selecting the optimum features for LDA and QDA. Riccard et al. [95]
used a heuristic approach based on geometric features, fol- lowed by an SVM for classification. Other than the de- velopment of CADe schemes, Rao et al. [96] performed an observer performance study with a CADe scheme. Thus, various approaches have been proposed for the classifica- tion component in CADe schemes. There are large vari- ations in the performance of CADe schemes: sensitivities ranged from 70–94% with 0.7–64.1 FPs per case. It is di ffi - cult to say which CADe scheme performs better because of different databases and testing methods used, without a di- rect comparison. Some studies used thick-slice CT, and oth- ers used thin-slice CT. Some studies used nodules missed by radiologists, and some used nodules detected by radi- ologists. Evaluation of a CAD scheme with missed cases would be desirable, because the CAD scheme is likely to help radiologists more with such cases. Some studies used screening CT, some used diagnostic CT, and some used HRCT. Testing with screening CT cases would be more appropriate, given the purpose of CADe schemes. Some studies used an LOO test, some used an independent test, and some used N-fold cross-validation. Each testing method has its own advantages and limitations. For detailed infor- mation, please refer to the literature [39], [40], [97]. Since the current sensitivity and FP rate of CADe schemes are not high enough compared to radiologists’ performance, further developments of techniques to improve the performance would be necessary. In addition, more studies on the proof of the usefulness of CADe such as observer performance studies and clinical trials would be beneficial in the field.
3.2 Diagnosis of Lung Nodules
Although CT has been shown to be sensitive to the de-
tection lung nodules, it may be difficult for radiologists
Table 1 Classification components in CADe schemes for detection of lung nodules in CT.
to distinguish between benign and malignant nodules on LDCT images. In a screening program with LDCT in New York, 88% (206/233) of suspicious lesions were found to be benign on follow-up examinations [72]. In a screening pro- gram in Japan, only 83 (10%) among 819 scans with sus- picious lesions were diagnosed to be cancer cases [98]. Ac- cording to recent findings at the Mayo Clinic, 2,792 (98.6%) of 2,832 nodules detected by a multidetetor CT were benign, and 40 (1.4%) nodules were malignant [99]. Thus, a large number of benign nodules were found with CT; follow-up examinations such as HRCT and/or biopsy were performed on these patients. Therefore, CADx schemes for distinction between benign and malignant nodules in LDCT would be useful for reducing the number of “unnecessary” follow-up examinations.
A number of researchers developed CADx schemes
for this task, which distinguish malignant nodules from be- nign nodules automatically and/or determine the likelihood of malignancy for the detected nodules. The performance of the schemes was generally evaluated by means of ROC analysis [100], because this task is a two-class classifica- tion. The AUC [101] was often used as a performance index.
Studies on the development of CADx schemes for distinc-
tion between malignant and benign lung nodules in CT are
summarized in Table 2. In 1998, Kawata et al. [102] de-
scribed the calculation of nodule features for the purpose of
distinction between malignant and benign nodules. In 1999,
McNitt-Gray et al. [103] developed a classification scheme
based on LDA for distinction between malignant and be-
nign nodules in HRCT. They achieved a correct classifi-
cation rate of 90.3% for a database of 17 malignant and
14 benign nodules. Matsuki et al. [104] used an ANN with
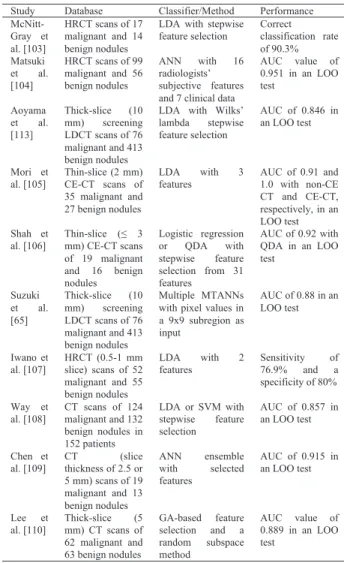
Table 2 Classification between malignant and benign nodules (CADx) for thoracic CT.
subjective features determined by radiologists for classifica- tion between 99 malignant and 56 benign nodules in HRCT and achieved an AUC value of 0.951. Aoyama et al. [42]
used LDA for distinction between malignant and benign nodules in thick-slice screening LDCT. They achieved an AUC value of 0.846 for a database of 73 patients with 76 pri- mary cancers and 342 patients with 413 benign nodules.
Mori et al. [105] developed a classification scheme for dis- tinction between malignant and benign nodules in contrast- enhanced (CE) CT by using LDA with 3 features (i.e., atten- uation, shape index, and curvedness value). Shah et al. [106]
employed different classifiers such as logistic regression and QDA with features selected from a group of 31 by using stepwise feature selection based on the Akaike information criterion. Their scheme with logistic regression achieved an AUC value of 0.92 in the distinction between 19 malig- nant and 16 benign nodules in thin-slice CE-CT. Suzuki et al. [65] developed a PML technique called a multiple MTANN scheme for the classification task. They achieved an AUC value of 0.88 for thick-slice screening LDCT scans of 73 patients with 76 primary cancers and 342 patients with
413 benign nodules. Iwano et al. [107] achieved a sensitivity of 76.9% and a specificity of 80% with their scheme based on LDA with 2 features in their evaluation of HRCT images of 52 malignant and 55 benign nodules. Way et al. [108]
incorporated nodule surface features into their classification based on LDA or an SVM, and they achieved an AUC value of 0.857 in the classification of 124 malignant and 132 be- nign nodules in 152 patients. Chen et al. [109] employed an ANN ensemble to classify 19 malignant and 13 be- nign nodules, and they achieved an AUC value of 0.915.
Lee et al. [110] developed a two-step supervised learning scheme combining a genetic algorithm with a random sub- space method, and they achieved an AUC value of 0.889 in the classification between 62 malignant and 63 benign nod- ules. Other than CADx approaches, Kawata et al. [111] de- veloped a content-based image retrieval approach to provide radiologists with similar images for improving their diag- nostic performance in distinction between benign and ma- lignant nodules. Kawata et al. [112] also developed quanti- tative classification measures that correlate with pathologic characteristics of lung cancer and patients’ prognosis. Thus, various approaches to CADx schemes have been proposed.
The database size varied in different studies, from 31–489.
Generally achieving high performance for a large database is challenging, because it is likely to contain more varia- tions of nodules. CT scans in the databases included screen- ing LDCT, standard diagnostic CT, and HRCT. Diagnosis of lung nodules on LDCT images would be the most chal- lenging due to a low image quality. Most studies used an LOO test. There are variations in the performance of CADx schemes: AUC values ranged from 0.846–0.951. Once again, it is difficult to say which CADx scheme performs better without a direct comparison. Since the current perfor- mance of CADx schemes would be close to or comparable to radiologists’ performance, more studies on the proof of the usefulness of CADx such as observer performance stud- ies and clinical trials would be beneficial in the field.
4. Classification in CADe of the Colon
4.1 CADe for Detection of Polyps in CTC
Colorectal cancer is the second leading cause of cancer deaths in the United States [114]. Evidence suggests that early detection and removal of polyps (i.e., precursors of colorectal cancer) can reduce the incidence of colorectal cancer [115]. CTC, also known as virtual colonoscopy, is a technique for detecting colorectal neoplasms by use of CT scans of the colon. The diagnostic performance of CTC in detecting polyps, however, remains uncertain due to a propensity for perceptual errors in detection of polyps.
CADe of polyps has been investigated to address that issue with CTC [116]. CADe has the potential to improve radiol- ogists’ diagnostic performance in the detection of polyps.
A number of investigators have developed automated or
semi-automated CADe schemes for the detection of polyps
in CTC [117]–[120].
Table 3 Classification components in CADe schemes for detection of polyps in CT colonography.
4.2 Classification Component in CADe Schemes
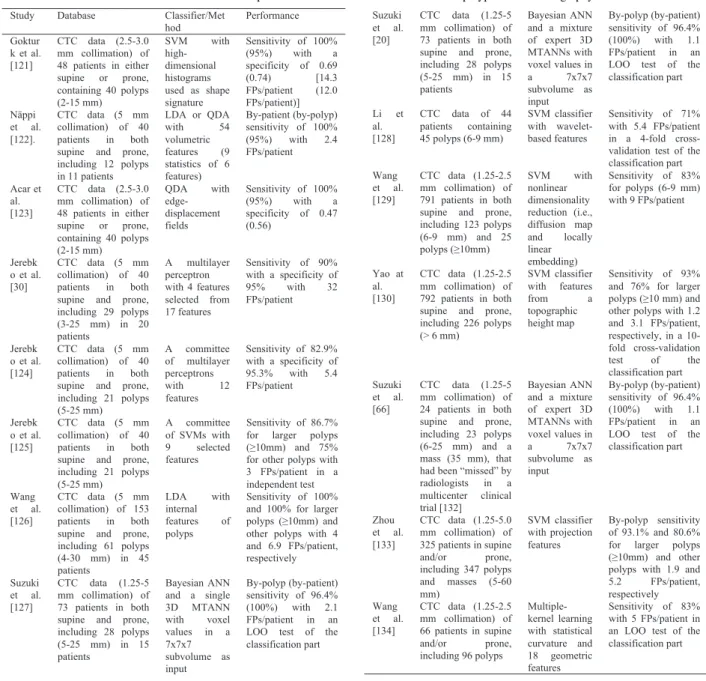
Major sources of non-polyps (i.e., FPs) remaining after the first step in CADe schemes include haustral folds, resid- ual stool, rectal tubes, the ileocecal valve, and extra-colonic structures such as the small bowel and stomach. Technical developments of the classification step in CADe schemes for detection of polyps in CTC are summarized in Ta- ble 3. Many investigators employed feature-based classi- fiers in the second component of CADe schemes. Gokturk et al. [121] employed an SVM with histogram input that is used as a shape signature for classification. N¨appi et al.
developed a classification method based on volumetric fea- tures [122]. Acar et al. [123] used edge-displacement fields to model the changes in consecutive cross-sectional views
of CTC data and QDA for classifcation. Jerebko et al. [30]
used a multilayer perceptron to classify polyp candidates in their CADe scheme and improved the performance by incorporating a committee of multilayer perceptrons [124]
and a committee of SVMs [125]. Wang et al. [126] devel- oped a classification method based on LDA with internal features (geometric, morphologic, and textural) of polyps.
Suzuki et al. [127] developed a PML technique called a 3D MTANN by extending the structure of a 2D MTANN [11]
to process 3D volume data in CTC. They removed FPs due
to rectal tubes by using a single 3D MTANN [127] and mul-
tiple sources of FPs by developing and using a mixture of
expert 3D MTANNs [20]. Li et al. [128] developed a classi-
fication method based on an SVM classifier with wavelet-
based features. Wang et al. [129] improved the SVM
performance by using nonlinear dimensionality reduction
(i.e., a di ff usion map and locally linear embedding). Yao at al. [130] employed a topographic height map for calculat- ing features for an SVM classifier. Suzuki et al. [66] tested a CADe scheme with MTANNs (i.e., a PML technique) on polyps that had been “missed” by radiologists [131] in a multicenter clinical trial [132]. Suzuki et al. [67] also im- proved the efficiency of the MTANN approach by incor- porating principal-component analysis-based and Laplacian eigenmap-based dimension reduction techniques. Xu and Suzuki [68] showed that other nonlinear regression models such as support vector and nonlinear Gaussian process re- gression models instead of the ANN regression model could be used as the core model in the MTANN framework. Zhou et al. [133] developed projection features for an SVM classi- fier. Wang et al. [134] improved the performance of a CAD scheme by adding statistical curvature features in multiple- kernel learning. Multiple kernel learning is a recent topic in SVM research.
5. Conclusion
In this paper, ML techniques used in CAD schemes for the thorax and colon have been surveyed. These CAD schemes included CADe and CADx of lung nodules in thoracic CT and CADe of polyps in CTC. The second of the two major components of most CAD schemes, i.e., the classification of lesion candidates, used ML techniques. There are three classes of classification techniques used in CAD schemes:
feature-based ML, PML, and non-ML methods. Feature- based ML is the most popular technique in the classifica- tion step. Various ML models have been used in this class, including LDA, a multilayer perceptron, an SVM, an ML ensemble, and multiple-kernel learning. Feature selection is an important step for maximizing the performance of a feature-based ML technique, and thus it was often used.
The most popular feature selection method in CAD is step- wise feature selection with Wilks’ lambda for linear classi- fiers such as LDA. Recently, feature selection for nonlin- ear classifiers has been studied. The most recent develop- ment is SFFS under the maximum AUC criterion coupled with an SVM. Recently, PML emerged and used for re- moval of FPs that had not been removed by feature-based ML. An MTANN is a representative PML model, and there are variations of the MTANNs, including a mixture of expert MTANNs, MTSVR, and Lap-MTANNs. Thus, many inves- tigators have been studying ML in CAD, which indicates the importance of ML in this field. Most CAD schemes em- ploy feature-based MLs that had originally been developed and established in the pattern recognition field. On the other hand, MTANNs were born in the medical imaging field. Ev- idence demonstrated that PML including MTANNs was ef- fective for improving the performance of CAD schemes. It is hoped that this survey will be useful for researchers in un- derstanding the past studies and the current status of ML in CAD, and in advancing the research area of ML in CAD.
It is also hoped to see more original ML techniques/models created in the CAD field.
Acknowledgments
The author is grateful to Ms. E. Lanzl for improving the manuscript. This work was partly supported by NIH R01CA120549, S10 RR021039 and P30 CA14599. CAD and ML technologies developed at University of Chicago have been licensed to companies including R2 Technology (Hologic), Riverain Technologies, AlgoMedica, Median Technologies, Mitsubishi Space Software, General Electric, and Toshiba. It is the policy of University of Chicago that investigators disclose publicly actual or potential significant financial interests that may appear to be affected by research activities.
References
[1] M.L. Giger and K. Suzuki, “Computer-aided diagnosis (CAD),” in Biomedical Information Technology, ed. D.D. Feng, pp.359–374, Academic Press, 2007.
[2] K. Doi, “Current status and future potential of computer-aided diagnosis in medical imaging,” Br J Radiol, vol.78, Spec no.1, pp.S3–S19, 2005.
[3] H.P. Chan, B. Sahiner, M.A. Helvie, N. Petrick, M.A. Roubidoux, T.E. Wilson, D.D. Adler, C. Paramagul, J.S. Newman, and S.
Sanjay-Gopal, “Improvement of radiologists’ characterization of mammographic masses by using computer-aided diagnosis: an ROC study,” Radiology, vol.212, no.3, pp.817–827, Sept. 1999.
[4] F. Li, M. Aoyama, J. Shiraishi, H. Abe, Q. Li, K. Suzuki, R.
Engelmann, S. Sone, H. Macmahon, and K. Doi, “Radiologists’
performance for differentiating benign from malignant lung nod- ules on high-resolution CT using computer-estimated likelihood of malignancy,” AJR. Am. J. Roentgenol., vol.183, no.5, pp.1209–
1215, Nov. 2004.
[5] F. Li, H. Arimura, K. Suzuki, J. Shiraishi, Q. Li, H. Abe, R.
Engelmann, S. Sone, H. MacMahon, and K. Doi, “Computer- aided detection of peripheral lung cancers missed at CT: ROC analyses without and with localization,” Radiology, vol.237, no.2, pp.684–690, Nov. 2005.
[6] K. Suzuki, M. Hori, E. McFarland, A.C. Friedman, D.C. Rockey, and A.H. Dachman, “Can CAD help improve the performance of radiologists in detection of difficult polyps in CT colonography?,”
Proc. RSNA Annual Meeting, pp.872, Chicago, IL, 2009.
[7] K. Suzuki, J. Shiraishi, H. Abe, H. MacMahon, and K. Doi, “False- positive reduction in computer-aided diagnostic scheme for de- tecting nodules in chest radiographs by means of massive train- ing artificial neural network,” Academic Radiology, vol.12, no.2, pp.191–201, Feb. 2005.
[8] B. van Ginneken, B.M. ter Haar Romeny, and M.A. Viergever,
“Computer-aided diagnosis in chest radiography: A survey,” IEEE Trans. Med. Imaging, vol.20, no.12, pp.1228–1241, Dec. 2001.
[9] M.L. Giger, K. Doi, and H. MacMahon, “Image feature analysis and computer-aided diagnosis in digital radiography. 3. Automated detection of nodules in peripheral lung fields,” Med. Phys., vol.15, no.2, pp.158–166, March-April 1988.
[10] S. Chen, K. Suzuki, and H. MacMahon, “A computer-aided diag- nostic scheme for lung nodule detection in chest radiographs by means of two-stage nodule-enhancement with support vector clas- sification,” Med. Phys., vol.38, pp.1844–1858, 2011.
[11] K. Suzuki, S.G. Armato, F. Li, S. Sone, and K. Doi, “Massive training artificial neural network (MTANN) for reduction of false positives in computerized detection of lung nodules in low-dose CT,” Med. Phys., vol.30, no.7, pp.1602–1617, July 2003.
[12] H. Arimura, S. Katsuragawa, K. Suzuki, F. Li, J. Shiraishi, S. Sone,
and K. Doi, “Computerized scheme for automated detection of lung nodules in low-dose computed tomography images for lung cancer screening,” Acad. Radiol., vol.11, no.6, pp.617–629, June 2004.
[13] S.G. Armato, 3rd, M.L. Giger, C.J. Moran, J.T. Blackburn, K. Doi, and H. MacMahon, “Computerized detection of pulmonary nod- ules on CT scans,” Radiographics, vol.19, no.5, pp.1303–1311, Sept.-Oct. 1999.
[14] S.G. Armato, 3rd, F. Li, M.L. Giger, H. MacMahon, S. Sone, and K. Doi, “Lung cancer: performance of automated lung nodule de- tection applied to cancers missed in a CT screening program,” Ra- diology, vol.225, no.3, pp.685–692, Dec. 2002.
[15] H.P. Chan, K. Doi, S. Galhotra, C.J. Vyborny, H. MacMahon, and P.M. Jokich, “Image feature analysis and computer-aided diagno- sis in digital radiography. I. Automated detection of microcalcifi- cations in mammography,” Med. Phys., vol.14, no.4, pp.538–548, July-Aug. 1987.
[16] K.G. Gilhuijs, M.L. Giger, and U. Bick, “Computerized analysis of breast lesions in three dimensions using dynamic magnetic- resonance imaging,” Med. Phys., vol.25, no.9, pp.1647–1654, Sept. 1998.
[17] K. Drukker, M.L. Giger, and C.E. Metz, “Robustness of comput- erized lesion detection and classification scheme across different breast US platforms,” Radiology, vol.237, no.3, pp.834–840, Dec.
2005.
[18] H. Yoshida and J. Nappi, “Three-dimensional computer-aided di- agnosis scheme for detection of colonic polyps,” IEEE Trans. Med.
Imaging, vol.20, no.12, pp.1261–1274, Dec. 2001.
[19] K. Suzuki, H. Yoshida, J. Nappi, and A.H. Dachman, “Massive- training artificial neural network (MTANN) for reduction of false positives in computer-aided detection of polyps: Suppression of rectal tubes,” Medical Physics, vol.33, no.10, pp.3814–3824, 2006.
[20] K. Suzuki, H. Yoshida, J. Nappi, S.G. Armato, 3rd, and A.H.
Dachman, “Mixture of expert 3D massive-training ANNs for re- duction of multiple types of false positives in CAD for detec- tion of polyps in CT colonography,” Med. Phys., vol.35, no.2, pp.694–703, Feb. 2008.
[21] R.M. Summers, C.F. Beaulieu, L.M. Pusanik, J.D. Malley, R.B.
Jeffrey, Jr., D.I. Glazer, and S. Napel, “Automated polyp detector for CT colonography: Feasibility study,” Radiology, vol.216, no.1, pp.284–290, July 2000.
[22] A. Lostumbo, C. Wanamaker, J. Tsai, K. Suzuki, and A.H.
Dachman, “Comparison of 2D and 3D views for evaluation of flat lesions in CT colonography,” Acad. Radiol., vol.17, no.1, pp.39–47, Jan. 2010.
[23] A. Lostumbo, K. Suzuki, and A.H. Dachman, “Flat lesions in CT colonography,” Abdom. Imaging, vol.35, no.5, pp.578–583, Oct.
2010.
[24] D.E. Rumelhart, G.E. Hinton, and R.J. Williams, “Learning representations by back-propagating errors,” Nature, vol.323, pp.533–536, 1986.
[25] V.N. Vapnik, The Nature of Statistical Learning Theory, Springer- Verlag, Berlin, 1995.
[26] J. Shiraishi, Q. Li, K. Suzuki, R. Engelmann, and K. Doi,
“Computer-aided diagnostic scheme for the detection of lung nod- ules on chest radiographs: localized search method based on anatomical classification,” Med. Phys., vol.33, no.7, pp.2642–
2653, July 2006.
[27] S.G. Armato, 3rd, M.L. Giger, and H. MacMahon, “Automated detection of lung nodules in CT scans: Preliminary results,” Med.
Phys., vol.28, no.8, pp.1552–1561, Aug. 2001.
[28] M. Aoyama, Q. Li, S. Katsuragawa, H. MacMahon, and K. Doi,
“Automated computerized scheme for distinction between benign and malignant solitary pulmonary nodules on chest images,” Med.
Phys., vol.29, no.5, pp.701–708, May 2002.
[29] M. Aoyama, Q. Li, S. Katsuragawa, F. Li, S. Sone, and K.
Doi, “Computerized scheme for determination of the likelihood
measure of malignancy for pulmonary nodules on low-dose CT images,” Med. Phys., vol.30, no.3, pp.387–394, March 2003.
[30] A.K. Jerebko, R.M. Summers, J.D. Malley, M. Franaszek, and C.D. Johnson, “Computer-assisted detection of colonic polyps with CT colonography using neural networks and binary classi- fication trees,” Medical Physics, vol.30, no.1, pp.52–60, Jan. 2003.
[31] I. Sluimer, A. Schilham, M. Prokop, and B.van Ginneken, “Com- puter analysis of computed tomography scans of the lung: a sur- vey,” IEEE Trans. Med. Imaging, vol.25, no.4, pp.385–405, April 2006.
[32] Q. Li, “Recent progress in computer-aided diagnosis of lung nod- ules on thin-section CT,” Comput. Med. Imaging Graph., vol.31, no.4-5, pp.248–257, June-July 2007.
[33] F. Fraioli, G. Serra, and R. Passariello, “CAD (computed-aided detection) and CADx (computer aided diagnosis) systems in iden- tifying and characterising lung nodules on chest CT: Overview of research, developments and new prospects,” Radiol Med, vol.115, no.3, pp.385–402, April 2010.
[34] J.M. Goo, “A computer-aided diagnosis for evaluating lung nod- ules on chest CT: The current status and perspective,” Korean Jour- nal of Radiology: Official Journal of the Korean Radiological So- ciety, vol.12, no.2, pp.145–155, March-April 2011.
[35] K. Suzuki, “Pixel-based machine-learning (PML) in medical imag- ing,” Int. J. Biomedical Imaging, vol.2012, Article ID 792079, 792018 2012.
[36] R.O. Duda, P.E. Hart, and D.G. Stork, in Pattern Recognit., Wiley Interscience, Hoboken, NJ, 2001.
[37] C.M. Bishop, Neural Networks for Pattern Recognition, Oxford University Press, New York, 1995.
[38] C.M. Bishop, “An example - character recognition,” in Neural Net- works for Pattern Recognition, ed. C.M. Bishop, pp.1–4, Oxford University Press, New York, 1995.
[39] H.P. Chan, B. Sahiner, R.F. Wagner, and N. Petrick, “Classifier de- sign for computer-aided diagnosis: Effects of finite sample size on the mean performance of classical and neural network classifiers,”
Med. Phys., vol.26, no.12, pp.2654–2668, Dec. 1999.
[40] K. Fukunaga, Introduction to Statistical Pattern Recognition, Aca- demic Press, San Diego, 1990.
[41] R.E. Bellman, Adaptive control processes: A guided tour, Princeton University Press, Princeton, N.J., 1961.
[42] M. Aoyama, Q. Li, S. Katsuragawa, H. MacMahon, and K. Doi,
“Automated computerized scheme for distinction between benign and malignant solitary pulmonary nodules on chest images,” Med.
Phys., vol.29, no.5, pp.701–708, May 2002.
[43] P. Pudil, J. Novovicova, and J. Kittler, “Floating search methods in feature selection,” Pattern Recognit. Lett., vol.15, pp.1119–1125, 1994.
[44] K. Suzuki, “Determining the receptive field of a neural filter,” J Neural Eng, vol.1, no.4, pp.228–237, Dec. 2004.
[45] K. Suzuki, I. Horiba, and N. Sugie, “A simple neural network prun- ing algorithm with application to filter synthesis,” Neural Process.
Lett., vol.13, no.1, pp.43–53, Feb. 2001.
[46] A. Takemura, A. Shimizu, and K. Hamamoto, “Discrimination of breast tumors in ultrasonic images using an ensemble classifier based on the AdaBoost algorithm with feature selection,” IEEE Trans. Med. Imaging, vol.29, no.3, pp.598–609, 2010.
[47] J. Xu and K. Suzuki, “Computer-aided detection of hepatocellular carcinoma in hepatic CT: False positive reduction with feature se- lection,” IEEE International Symposium on Biomedical Imaging (IEEE ISBI), pp.1097–1100, Chicago, IL, 2011.
[48] K. Suzuki, I. Horiba, N. Sugie, and S. Ikeda, “Improvement of image quality of X-ray fluoroscopy using spatiotemporal neural filter which learns noise reduction, edge enhancement and motion compensation,” Proc. Int. Conf. Signal Processing Applications and Technology (ICSPAT), pp.1382–1386, Boston, MA, 1996.
[49] K. Suzuki, I. Horiba, N. Sugie, and M. Nanki, “Neural filter with selection of input features and its application to image quality
improvement of medical image sequences,” IEICE Trans. Inf. &
Syst., vol.E85-D, no.10, pp.1710–1718, Oct. 2002.
[50] K. Suzuki, I. Horiba, and N. Sugie, “Efficient approximation of neural filters for removing quantum noise from images,” IEEE Trans. Signal Process., vol.50, no.7, pp.1787–1799, July 2002.
[51] K. Suzuki, I. Horiba, and N. Sugie, “Neural edge enhancer for su- pervised edge enhancement from noisy images,” IEEE Trans. Pat- tern Anal. Mach. Intell., vol.25, no.12, pp.1582–1596, Dec. 2003.
[52] K. Suzuki, I. Horiba, N. Sugie, and M. Nanki, “Extraction of left ventricular contours from left ventriculograms by means of a neural edge detector,” IEEE Trans. Med. Imaging, vol.23, no.3, pp.330–339, March 2004.
[53] S.B. Lo, S.A. Lou, J.S. Lin, M.T. Freedman, M.V. Chien, and S.K.
Mun, “Artificial convolution neural network techniques and ap- plications for lung nodule detection,” IEEE Trans. Med. Imaging, vol.14, no.4, pp.711–718, 1995.
[54] S.C.B. Lo, H.P. Chan, J.S. Lin, H. Li, M.T. Freedman, and S.K.
Mun, “Artificial convolution neural network for medical image pattern recognition,” Neural Netw., vol.8, no.7-8, pp.1201–1214, 1995.
[55] J.S. Lin, S.B. Lo, A. Hasegawa, M.T. Freedman, and S.K. Mun,
“Reduction of false positives in lung nodule detection using a two- level neural classification,” IEEE Trans. Med. Imaging, vol.15, no.2, pp.206–217, 1996.
[56] S.C. Lo, H. Li, Y. Wang, L. Kinnard, and M.T. Freedman, “A mul- tiple circular path convolution neural network system for detection of mammographic masses,” IEEE Trans. Med. Imaging, vol.21, no.2, pp.150–158, Feb. 2002.
[57] B. Sahiner, H.P. Chan, N. Petrick, D. Wei, M.A. Helvie, D.D.
Adler, and M.M. Goodsitt, “Classification of mass and normal breast tissue: A convolution neural network classifier with spatial domain and texture images,” IEEE Trans. Med. Imaging, vol.15, no.5, pp.598–610, 1996.
[58] D. Wei, R.M. Nishikawa, and K. Doi, “Application of texture anal- ysis and shift-invariant artificial neural network to microcalcifi- cation cluster detection,” Radiology, vol.201, pp.696–696, Nov.
1996.
[59] W. Zhang, K. Doi, M.L. Giger, Y. Wu, R.M. Nishikawa, and R.A.
Schmidt, “Computerized detection of clustered microcalcifications in digital mammograms using a shift-invariant artificial neural net- work,” Med. Phys., vol.21, no.4, pp.517–524, April 1994.
[60] K. Suzuki, S.G. Armato, 3rd, F. Li, S. Sone, and K. Doi, “Massive training artificial neural network (MTANN) for reduction of false positives in computerized detection of lung nodules in low-dose computed tomography,” Med. Phys., vol.30, no.7, pp.1602–1617, July 2003.
[61] K. Suzuki, H. Abe, H. MacMahon, and K. Doi, “Image-processing technique for suppressing ribs in chest radiographs by means of massive training artificial neural network (MTANN),” IEEE Trans.
Med. Imaging, vol.25, no.4, pp.406–416, April 2006.
[62] S. Oda, K. Awai, K. Suzuki, Y. Yanaga, Y. Funama, H. MacMahon, and Y. Yamashita, “Performance of radiologists in detection of small pulmonary nodules on chest radiographs: Effect of rib sup- pression with a massive-training artificial neural network,” AJR.
Am. J. Roentgenol., vol.193, no.5, pp.W397–W402, Nov. 2009.
[63] K. Suzuki, “A supervised ‘lesion-enhancement’ filter by use of a massive-training artificial neural network (MTANN) in computer-aided diagnosis (CAD),” Phys. Med. Biol., vol.54, no.18, pp.S31–S45, Sept. 2009.
[64] K. Suzuki, J. Shiraishi, H. Abe, H. MacMahon, and K. Doi, “False- positive reduction in computer-aided diagnostic scheme for detect- ing nodules in chest radiographs by means of massive training ar- tificial neural network,” Acad. Radiol., vol.12, no.2, pp.191–201, Feb. 2005.
[65] K. Suzuki, F. Li, S. Sone, and K. Doi, “Computer-aided diagnostic scheme for distinction between benign and malignant nodules in thoracic low-dose CT by use of massive training artificial neural
network,” IEEE Trans. Med. Imaging, vol.24, no.9, pp.1138–1150, Sept. 2005.
[66] K. Suzuki, D.C. Rockey, and A.H. Dachman, “CT colonography:
Advanced computer-aided detection scheme utilizing MTANNs for detection of “missed” polyps in a multicenter clinical trial,”
Med. Phys., vol.30, pp.2–21, 2010.
[67] K. Suzuki, J. Zhang, and J. Xu, “Massive-training artificial neu- ral network coupled with Laplacian-eigenfunction-based dimen- sionality reduction for computer-aided detection of polyps in CT colonography,” IEEE Trans. Med. Imaging, vol.29, no.11, pp.1907–1917, Nov. 2010.
[68] J. Xu and K. Suzuki, “Massive-training support vector regression and Gaussian process for false-positive reduction in computer- aided detection of polyps in CT colonography,” Med. Phys., vol.38, pp.1888–1902, 2011.
[69] A. Jemal, R. Siegel, E. Ward, Y. Hao, J. Xu, T. Murray, and M.J.
Thun, “Cancer statistics, 2008,” CA. Cancer J. Clin., vol.58, no.2, pp.71–96, March-April 2008.
[70] M. Kaneko, K. Eguchi, H. Ohmatsu, R. Kakinuma, T. Naruke, K.
Suemasu, and N. Moriyama, “Peripheral lung cancer: Screening and detection with low-dose spiral CT versus radiography,” Radi- ology, vol.201, no.3, pp.798–802, Dec. 1996.
[71] S. Sone, S. Takashima, F. Li, Z. Yang, T. Honda, Y. Maruyama, M.
Hasegawa, T. Yamanda, K. Kubo, K. Hanamura, and K. Asakura,
“Mass screening for lung cancer with mobile spiral computed tomography scanner,” Lancet, vol.351, no.9111, pp.1242–1245, April 1998.
[72] C.I. Henschke, D.I. McCauley, D.F. Yankelevitz, D.P. Naidich, G. McGuinness, O.S. Miettinen, D.M. Libby, M.W. Pasmantier, J. Koizumi, N.K. Altorki, and J.P. Smith, “Early lung cancer ac- tion project: Overall design and findings from baseline screening,”
Lancet, vol.354, no.9173, pp.99–105, July 1999.
[73] C.I. Henschke, D.F. Yankelevitz, D.P. Naidich, D.I. McCauley, G.
McGuinness, D.M. Libby, J.P. Smith, M.W. Pasmantier, and O.S.
Miettinen, “CT screening for lung cancer: suspiciousness of nod- ules according to size on baseline scans,” Radiology, vol.231, no.1, pp.164–168, April 2004.
[74] R.T. Heelan, B.J. Flehinger, M.R. Melamed, M.B. Zaman, W.B.
Perchick, J.F. Caravelli, and N. Martini, “Non-small-cell lung cancer: results of the New York screening program,” Radiology, vol.151, no.2, pp.289–293, May 1984.
[75] M.L. Giger, K.T. Bae, and H. MacMahon, “Computerized detec- tion of pulmonary nodules in computed tomography images,” In- vest. Radiol., vol.29, no.4, pp.459–465, April 1994.
[76] K. Kanazawa, Y. Kawata, N. Niki, H. Satoh, H. Ohmatsu, R.
Kakinuma, M. Kaneko, N. Moriyama, and K. Eguchi, “Computer- aided diagnosis for pulmonary nodules based on helical CT im- ages,” Comput. Med. Imaging Graph., vol.22, no.2, pp.157–167, March-April 1998.
[77] M.N. Gurcan, B. Sahiner, N. Petrick, H.P. Chan, E.A. Kazerooni, P.N. Cascade, and L. Hadjiiski, “Lung nodule detection on tho- racic computed tomography images: preliminary evaluation of a computer-aided diagnosis system,” Med. Phys., vol.29, no.11, pp.2552–2558, Nov. 2002.
[78] Y. Lee, T. Hara, H. Fujita, S. Itoh, and T. Ishigaki, “Automated detection of pulmonary nodules in helical CT images based on an improved template-matching technique,” IEEE Trans. Med. Imag- ing, vol.20, no.7, pp.595–604, July 2001.
[79] K. Suzuki and K. Doi, “How can a massive training artificial neural network (MTANN) be trained with a small number of cases in the distinction between nodules and vessels in thoracic CT?,” Acad.
Radiol., vol.12, no.10, pp.1333–1341, Oct. 2005.
[80] H.P. Chan, B. Sahiner, R.F. Wagner, and N. Petrick, “Classifier de- sign for computer-aided diagnosis: effects of finite sample size on the mean performance of classical and neural network classifiers,”
Med. Phys, vol.26, no.12, pp.2654–2668, Dec. 1999.
[81] B. Sahiner, H.P. Chan, and L. Hadjiiski, “Classifier performance
prediction for computer-aided diagnosis using a limited dataset,”
Med. Phys, vol.35, no.4, pp.1559–1570, April 2008.
[82] A.A. Farag, A. El-Baz, G. Gimelfarb, M.A. El-Ghar, and T.
Eldiasty, “Quantitative nodule detection in low dose chest CT scans: new template modeling and evaluation for CAD system design,” Medical image computing and computer-assisted inter- vention: MICCAI . . . International Conference on Medical Im- age Computing and Computer-Assisted Intervention, vol.8, no.Pt 1, pp.720–728, 2005.
[83] Z. Ge, B. Sahiner, H.P. Chan, L.M. Hadjiiski, P.N. Cascade, N.
Bogot, E.A. Kazerooni, J. Wei, and C. Zhou, “Computer-aided de- tection of lung nodules: false positive reduction using a 3D gradi- ent field method and 3D ellipsoid fitting,” Med. Phys., vol.32, no.8, pp.2443–2454, Aug. 2005.
[84] S. Matsumoto, H.L. Kundel, J.C. Gee, W.B. Gefter, and H. Hatabu,
“Pulmonary nodule detection in CT images with quantized conver- gence index filter,” Med. Image Anal., vol.10, no.3, pp.343–352, June 2006.
[85] R. Yuan, P.M. Vos, and P.L. Cooperberg, “Computer-aided de- tection in screening CT for pulmonary nodules,” AJR. Am. J.
Roentgenol., vol.186, no.5, pp.1280–1287, May 2006.
[86] J. Bi, S. Periaswamy, K. Okada, T. Kubota, G. Fung, M.
Salganicoff, and R.B. Rao, “Computer aided detection via asym- metric cascade of sparse hyperplane classifiers,” Proc. ACM SIGKDD, pp.837–844, 2006.
[87] J. Pu, B. Zheng, J.K. Leader, X.H. Wang, and D. Gur, “An au- tomated CT based lung nodule detection scheme using geomet- ric analysis of signed distance field,” Med. Phys., vol.35, no.8, pp.3453–3461, Aug. 2008.
[88] A. Retico, P. Delogu, M.E. Fantacci, I. Gori, and A. Preite Martinez, “Lung nodule detection in low-dose and thin-slice com- puted tomography,” Computers in Biology and Medicine, vol.38, no.4, pp.525–534, April 2008.
[89] X. Ye, X. Lin, J. Dehmeshki, G. Slabaugh, and G. Beddoe, “Shape- based computer-aided detection of lung nodules in thoracic CT images,” IEEE Trans. Biomed. Eng., vol.56, no.7, pp.1810–1820, July 2009.
[90] B. Golosio, G.L. Masala, A. Piccioli, P. Oliva, M. Carpinelli, R. Cataldo, P. Cerello, F. De Carlo, F. Falaschi, M.E. Fantacci, G. Gargano, P. Kasae, and M. Torsello, “A novel multithreshold method for nodule detection in lung CT,” Med. Phys., vol.36, no.8, pp.3607–3618, Aug. 2009.
[91] S.G. Armato, 3rd, G. McLennan, M.F. McNitt-Gray, C.R. Meyer, D. Yankelevitz, D.R. Aberle, C.I. Henschke, E.A. Hoffman, E.A.
Kazerooni, H. MacMahon, A.P. Reeves, B.Y. Croft, and L.P.
Clarke, “Lung image database consortium: developing a resource for the medical imaging research community,” Radiology, vol.232, no.3, pp.739–748, Sept. 2004.
[92] K. Murphy, B. van Ginneken, A.M. Schilham, B.J. de Hoop, H.A.
Gietema, and M. Prokop, “A large-scale evaluation of automatic pulmonary nodule detection in chest CT using local image features and k-nearest-neighbour classification,” Med. Image Anal., vol.13, no.5, pp.757–770, Oct. 2009.
[93] M. Tan, R. Deklerck, B. Jansen, M. Bister, and J. Cornelis, “A novel computer-aided lung nodule detection system for CT im- ages,” Med. Phys., vol.38, no.10, pp.5630–5645, Oct. 2011.
[94] T. Messay, R.C. Hardie, and S.K. Rogers, “A new computation- ally efficient CAD system for pulmonary nodule detection in CT imagery,” Med. Image Anal., vol.14, no.3, pp.390–406, June 2010.
[95] A. Riccardi, T.S. Petkov, G. Ferri, M. Masotti, and R. Campanini,
“Computer-aided detection of lung nodules via 3D fast radial trans- form, scale space representation, and Zernike MIP classification,”
Med. Phys., vol.38, no.4, pp.1962–1971, April 2011.
[96] R.B. Rao, J. Bi, G. Fung, M. Salganicoff, N. Obuchowski, and D. Naidich, “LungCAD: A clinically approved, machine learning system for lung cancer detection,” Proc. ACM SIGKDD, pp.1033–
1037, 2007.
[97] B. Sahiner, H.P. Chan, N. Petrick, R.F. Wagner, and L. Hadjiiski,
“Feature selection and classifier performance in computer-aided diagnosis: the effect of finite sample size,” Med. Phys., vol.27, no.7, pp.1509–1522, July 2000.
[98] F. Li, S. Sone, H. Abe, H. MacMahon, S.G. Armato, 3rd, and K. Doi, “Lung cancers missed at low-dose helical CT screening in a general population: comparison of clinical, histopathologic, and imaging findings,” Radiology, vol.225, no.3, pp.673–683, Dec.
2002.
[99] S.J. Swensen, J.R. Jett, T.E. Hartman, D.E. Midthun, J.A. Sloan, A.M. Sykes, G.L. Aughenbaugh, and M.A. Clemens, “Lung cancer screening with CT: Mayo Clinic experience,” Radiology, vol.226, no.3, pp.756–761, March 2003.
[100] C.E. Metz, “ROC methodology in radiologic imaging,” Invest. Ra- diol., vol.21, no.9, pp.720–733, Sept. 1986.
[101] J.A. Hanley and B.J. McNeil, “A method of comparing the ar- eas under receiver operating characteristic curves derived from the same cases,” Radiology, vol.148, no.3, pp.839–843, Sept. 1983.
[102] Y. Kawata, N. Niki, H. Ohmatsu, R. Kakinuma, K. Eguchi, M.
Kaneko, and N. Moriyama, “Quantitative surface characterization of pulmonary nodules based on thin-section CT images,” IEEE Trans. Nucl. Sci., vol.45, no.4, pp.2132–2138, 1998.
[103] M.F. McNitt-Gray, E.M. Hart, N. Wyckoff, J.W. Sayre, J.G.
Goldin, and D.R. Aberle, “A pattern classification approach to characterizing solitary pulmonary nodules imaged on high resolution CT: Preliminary results,” Med. Phys., vol.26, no.6, pp.880–888, June 1999.
[104] Y. Matsuki, K. Nakamura, H. Watanabe, T. Aoki, H. Nakata, S.
Katsuragawa, and K. Doi, “Usefulness of an artificial neural net- work for differentiating benign from malignant pulmonary nod- ules on high-resolution CT: Evaluation with receiver operating characteristic analysis,” AJR. Am. J. Roentgenol., vol.178, no.3, pp.657–663, March 2002.
[105] K. Mori, N. Niki, T. Kondo, Y. Kamiyama, T. Kodama, Y. Kawada, and N. Moriyama, “Development of a novel computer-aided diag- nosis system for automatic discrimination of malignant from be- nign solitary pulmonary nodules on thin-section dynamic com- puted tomography,” J. Comput. Assist. Tomogr., vol.29, no.2, pp.215–222, March-April 2005.
[106] S.K. Shah, M.F. McNitt-Gray, S.R. Rogers, J.G. Goldin, R.D. Suh, J.W. Sayre, I. Petkovska, H.J. Kim, and D.R. Aberle, “Computer aided characterization of the solitary pulmonary nodule using vol- umetric and contrast enhancement features,” Academic Radiology, vol.12, no.10, pp.1310–1319, Oct. 2005.
[107] S. Iwano, T. Nakamura, Y. Kamioka, M. Ikeda, and T. Ishigaki,
“Computer-aided differentiation of malignant from benign solitary pulmonary nodules imaged by high-resolution CT,” Comput. Med.
Imaging Graph., vol.32, no.5, pp.416–422, July 2008.
[108] T.W. Way, B. Sahiner, H.P. Chan, L. Hadjiiski, P.N. Cascade, A.
Chughtai, N. Bogot, and E. Kazerooni, “Computer-aided diagno- sis of pulmonary nodules on CT scans: improvement of classi- fication performance with nodule surface features,” Med. Phys., vol.36, no.7, pp.3086–3098, July 2009.
[109] H. Chen, Y. Xu, Y. Ma, and B. Ma, “Neural network ensemble- based computer-aided diagnosis for differentiation of lung nodules on CT images: clinical evaluation,” Acad. Radiol., vol.17, no.5, pp.595–602, May 2010.
[110] M.C. Lee, L. Boroczky, K. Sungur-Stasik, A.D. Cann, A.C.
Borczuk, S.M. Kawut, and C.A. Powell, “Computer-aided diag- nosis of pulmonary nodules using a two-step approach for feature selection and classifier ensemble construction,” Artificial Intelli- gence in Medicine, vol.50, no.1, pp.43–53, Sept. 2010.
[111] Y. Kawata, N. Niki, H. Ohmatsu, and N. Moriyama, “Example- based assisting approach for pulmonary nodule classification in three-dimensional thoracic computed tomography images,” Acad.
Radiol., vol.10, no.12, pp.1402–1415, Dec. 2003.
[112] Y. Kawata, N. Niki, H. Ohmatsu, M. Kusumoto, T. Tsuchida, K.
Eguchi, M. Kaneko, and N. Moriyama, “Quantitative classification based on CT histogram analysis of non-small cell lung cancer: cor- relation with histopathological characteristics and recurrence-free survival,” Med. Phys., vol.39, no.2, pp.988–1000, Feb. 2012.
[113] H. Abe, H. MacMahon, R. Engelmann, Q. Li, J. Shiraishi, S.
Katsuragawa, M. Aoyama, T. Ishida, K. Ashizawa, C.E. Metz, and K. Doi, “Computer-aided diagnosis in chest radiography: Re- sults of large-scale observer tests at the 1996-2001 RSNA scientific assemblies,” Radiographics, vol.23, no.1, pp.255–265, Jan.-Feb.
2003.
[114] A. Jemal, T. Murray, E. Ward, A. Samuels, R.C. Tiwari, A.
Ghafoor, E.J. Feuer, and M.J. Thun, “Cancer statistics, 2005,” CA:
A Cancer Journal for Clinicians, vol.55, no.1, pp.10–30, Jan.-Feb.
2005.
[115] S.J. Winawer, R.H. Fletcher, L. Miller, F. Godlee, M.H. Stolar, C.D. Mulrow, S.H. Woolf, S.N. Glick, T.G. Ganiats, J.H. Bond, L. Rosen, J.G. Zapka, S.J. Olsen, F.M. Giardiello, J.E. Sisk, R.
Van Antwerp, C. Brown-Davis, D.A. Marciniak, and R.J. Mayer,
“Colorectal cancer screening: clinical guidelines and rationale,”
Gastroenterology, vol.112, no.2, pp.594–642, Feb. 1997.
[116] K. Suzuki and A.H. Dachman, “Computer-aided diagnosis in CT colonography,” in Atlas of Virtual Colonoscopy, eds. A.H.
Dachman and A. Laghi, pp.163–182, Springer, New York, 2011.
[117] H. Yoshida and J. N¨appi, “Three-dimensional computer-aided di- agnosis scheme for detection of colonic polyps,” IEEE Trans. Med.
Imaging, vol.20, no.12, pp.1261–1274, Dec. 2001.
[118] R.M. Summers, C.D. Johnson, L.M. Pusanik, J.D. Malley, A.M.
Youssef, and J.E. Reed, “Automated polyp detection at CT colonography: Feasibility assessment in a human population,” Ra- diology, vol.219, no.1, pp.51–59, April 2001.
[119] D.S. Paik, C.F. Beaulieu, G.D. Rubin, B. Acar, R.B. Jeffrey, Jr., J.
Yee, J. Dey, and S. Napel, “Surface normal overlap: a computer- aided detection algorithm with application to colonic polyps and lung nodules in helical CT,” IEEE Trans. Med. Imaging, vol.23, no.6, pp.661–675, June 2004.
[120] G. Kiss, J. Van Cleynenbreugel, M. Thomeer, P. Suetens, and G.
Marchal, “Computer-aided diagnosis in virtual colonography via combination of surface normal and sphere fitting methods,” Eur Radiol, vol.12, no.1, pp.77–81, Jan. 2002.
[121] S.B. Gokturk, C. Tomasi, B. Acar, C.F. Beaulieu, D.S. Paik, R.B.
Jeffrey, Jr., J. Yee, and S. Napel, “A statistical 3-D pattern process- ing method for computer-aided detection of polyps in CT colonog- raphy,” IEEE Trans. Med. Imaging, vol.20, no.12, pp.1251–1260, Dec. 2001.
[122] J. Nappi and H. Yoshida, “Automated detection of polyps with CT colonography: Evaluation of volumetric features for reduction of false-positive findings,” Acad. Radiol., vol.9, no.4, pp.386–397, April 2002.
[123] B. Acar, C.F. Beaulieu, S.B. Gokturk, C. Tomasi, D.S. Paik, R.B.
Jeffrey, Jr., J. Yee, and S. Napel, “Edge displacement field-based classification for improved detection of polyps in CT colonogra- phy,” IEEE Trans. Med. Imaging, vol.21, no.12, pp.1461–1467, Dec. 2002.
[124] A.K. Jerebko, J.D. Malley, M. Franaszek, and R.M. Summers,
“Multiple neural network classification scheme for detection of colonic polyps in CT colonography data sets,” Academic Radiol- ogy, vol.10, no.2, pp.154–160, Feb. 2003.
[125] A.K. Jerebko, J.D. Malley, M. Franaszek, and R.M. Summers,
“Support vector machines committee classification method for computer-aided polyp detection in CT colonography,” Academic Radiology, vol.12, no.4, pp.479–486, April 2005.
[126] Z. Wang, Z. Liang, L. Li, X. Li, B. Li, J. Anderson, and D.
Harrington, “Reduction of false positives by internal features for polyp detection in CT-based virtual colonoscopy,” Med. Phys., vol.32, no.12, pp.3602–3616, Dec. 2005.
[127] K. Suzuki, H. Yoshida, J. Nappi, and A.H. Dachman, “Massive- training artificial neural network (MTANN) for reduction of false
positives in computer-aided detection of polyps: Suppression of rectal tubes,” Med. Phys., vol.33, no.10, pp.3814–3824, Oct. 2006.
[128] J. Li, R. Van Uitert, J. Yao, N. Petrick, M. Franaszek, A.
Huang, and R.M. Summers, “Wavelet method for CT colonogra- phy computer-aided polyp detection,” Med. Phys., vol.35, no.8, pp.3527–3538, Aug. 2008.
[129] S. Wang, J. Yao, and R.M. Summers, “Improved classifier for computer-aided polyp detection in CT colonography by nonlin- ear dimensionality reduction,” Med. Phys., vol.35, no.4, pp.1377–
1386, April 2008.
[130] J. Yao, J. Li, and R.M. Summers, “Employing topographical height map in colonic polyp measurement and false positive reduction,”
Pattern Recognit., vol.42, no.6, pp.1029–1040, 2009.
[131] T. Doshi, D. Rusinak, R.A. Halvorsen, D.C. Rockey, K. Suzuki, and A.H. Dachman, “CT colonography: False-negative interpreta- tions,” Radiology, vol.244, no.1, pp.165–173, July 2007.
[132] D.C. Rockey, E. Paulson, D. Niedzwiecki, W. Davis, H.B.
Bosworth, L. Sanders, J. Yee, J. Henderson, P. Hatten, S. Burdick, A. Sanyal, D.T. Rubin, M. Sterling, G. Akerkar, M.S. Bhutani, K. Binmoeller, J. Garvie, E.J. Bini, K. McQuaid, W.L. Foster, W.M. Thompson, A. Dachman, and R. Halvorsen, “Analysis of air contrast barium enema, computed tomographic colonography, and colonoscopy: Prospective comparison,” Lancet, vol.365, no.9456, pp.305–311, Jan. 2005.
[133] H. Zhu, Z. Liang, P.J. Pickhardt, M.A. Barish, J. You, Y. Fan, H. Lu, E.J. Posniak, R.J. Richards, and H.L. Cohen, “Increas- ing computer-aided detection specificity by projection features for CT colonography,” Med. Phys., vol.37, no.4, pp.1468–1481, April 2010.
[134] S. Wang, J. Yao, N. Petrick, and R.M. Summers, “Combining sta- tistical and geometric features for colonic polyp detection in CTC based on multiple kernel learning,” Int. J. Computational Intelli- gence and Applications, vol.9, no.1, pp.1–15, Jan. 2010.
Kenji Suzuki received his Ph.D. degree in information engineering from Nagoya Univer- sity in 2001. From 1993 to 2001, he worked at Hitachi Medical Corporation, and then Ai- chi Prefectural University as faculty. In 2001, he joined Department of Radiology at Univer- sity of Chicago. Since 2006, he has been As- sistant Professor of Radiology, Medical Physics, and Cancer Research Center there. He has pub- lished more than 230 papers (including 90 peer- reviewed journal papers). He has an h-index of 26. He is inventor/co-inventor on 30 patents. He published 9 books and 18 book chapters, and edited 6 journal special issues. He was awarded/co-awarded more than 42 grants totaling $8.6M. He has been serving as the Editor-in-Chief and an Associate Editor of 23 leading in- ternational journals. He had supervised/co-supervised more than 45 gradu- ate/undergraduate students, 6 postdocs/computer scientists and 12 visiting professors/scholars. He has received 32 awards for his research and teach- ing.