九州大学学術情報リポジトリ
Kyushu University Institutional Repository
日本の家庭用エアコンをケーススタディとした耐久 消費財のCO2排出削減ポテンシャルの推計
西嶋, 大輔
https://doi.org/10.15017/1931687
出版情報:Kyushu University, 2017, 博士(経済学), 課程博士 バージョン:
権利関係:
CO
2Reduction Potential of Consumer Durables : A Case Study of Air Conditioners in Japan
A Dissertation Submitted in Partial Fulfillment of the Requirements for the Degree of
Ph.D. in Economics
Department of Economic Systems Graduate School of Economics
Kyushu University
by
Daisuke Nishijima
November 2017
1
Contents
Chapter 1. Introduction ... 2
1.1 Issues about climate change ... 2
1.2 Impacts of durable goods on climate mitigation ... 5
1.3 Structure of this dissertation ... 6
Chapter 2. Literature review and research objectives ... 9
2.1 Relationship between product lifetime and life-cycle environmental burdens ... 9
2.2 Scenario analyses for future environmental burdens associated with stock and flow of durable goods ... 15
2.3 Statistical estimation of product lifetime models ... 17
2.4 Contributions of this ... 19
Chapter 3 Effects of product lifetime and energy efficiency on life-cycle CO2 emissions ... 24
3.1 Introduction ... 24
3.2 Methodology ... 29
3.3 Empirical results and discussion ... 39
3.4. Conclusions ... 50
Chapter 4 Comprehensive analysis of roles of technology, product lifetime, and energy efficiency for climate mitigation ... 55
4.1 Introduction ... 55
4.2 Methodology ... 58
4.3 Data ... 65
4.4 Results ... 67
4.5 Conclusion and Policy Implications ... 78
Chapter 5 Conclusion ... 82
Acknowledgement ... 86
References ... 90
2
Chapter 1. Introduction
1.1 Issues about climate change
In 2015, at the 21st Session of the Conference of the Parties to the United Nations Framework Convention on Climate Change (COP21), the Paris Agreement was adopted as a new international framework for tackling the global warming, taking the place of the Kyoto Protocol (UNFCCC, 2016). As part of this agreement, it was decided to try to hold the global average temperature to within 2°C above the pre-industrial level, to propose and renew reduction targets every 5 years for all countries, including the major emitting countries, and to incorporate a framework for considering initiatives to help all countries achieve their reduction targets (UNFCCC, 2016). Thus, the agreement demonstrated a clear resolve by the whole of the international community to seriously tackle global warming. It is a clear statement that reducing emissions of Greenhouse gases (GHG), the cause of global warming, is becoming increasingly urgent, and that measures to combat the problem must now be rapidly worked out.
Figure 1.1 shows the trend of GHG emissions in the world during the period: 1970
3
to 2010 reported by the International Panel of Climate Change (IPCC) Working group III in 2014 (IPCC, 2014). The total of the GHG emissions in the world have been increasing since 1970. Especially, the annual increase rate of the GHG emissions during the period: 2000 to 2010 was 2.2% and the rate during this decade is higher than that during: 1970 to 2000 (1.3%). This means that we have to consider reducing the GHG emissions more seriously. Looking at the type of the greenhouse gases in 2010, CO2
accounted for approximately 76% of the total GHG emissions and CO2 is the main driver of global warming.
Figure 1.1 Trend and composition of greenhouse gas emissions (GHG) in the world between 1970 and 2010 (IPCC, 2014)
4
While climate policies can be approached from a wide variety of viewpoints, the lifestyles and behavior patterns of consumers are considered an important factor in terms of impacts on global warming (International Panel on Climate Change Working Group III, 2014). The International Energy Agency (IEA) shows the world CO2
emissions for each sector in 2014 and reported that residential sector not only directly emitted 6% of the world CO2 emissions, but indirectly induced 11% of the world CO2
emissions due to electricity and heat utilizations in 2014 (IEA, 2016). The total CO2
emissions caused by residential sector accounted for 17% of the world CO2 emissions and the residential sector is one of the key sector for reducing CO2 emissions.
Residential sector is also one of the main drivers of CO2 emissions in Japan.
According to the trend of the CO2 emissions by sector in Japan reported by the Ministry of the Environment of Japan (Ministry of the Environment of Japan, 2016), the residential sector is the fourth largest sector of CO2 emissions in Japan at 2014. It is important to note that CO2 emissions from the residential sector entirely tend to increase since 1990, whereas those from the other sectors entirely tend to decrease or be stable during the same period. It indicates that the importance of reducing the CO2 emissions
5
from residential sector have been increasing.
1.2 Impacts of durable goods on climate mitigation
In particular, since durable goods such as automobiles and home appliances are so essential to our lifestyles, the CO2 emitted by their manufacture and use makes a large contribution to the global warming, and many previous studies have used a variety of techniques and approaches to quantitatively assess the energy use and the CO2
emissions attributable to durable goods (Yokota et al., 2003; Kim et al., 2004; Elshkaki et al., 2005; Kagawa et al., 2006, 2008, 2009, 2011, 2015; Pout and Hitchin, 2009;
Akpinar-Ferrand and Singh, 2010; Steubing et al., 2010; Hertwich and Roux, 2011;
Olonscheck et al., 2011; Chan et al., 2013; Scown et al., 2013; Alberini and Bigano, 2015; Taptich et al., 2016; Waite et al., 2017). Based on electricity use of residential sector in Japan at 2009, after refrigerators, lights, and televisions, residential air conditioners are the fourth largest source of consumption, which also means that they are a major source of CO2 emissions (Agency for Natural Resources and Energy, Japan, 2010). Moreover, according to the previous study (Isaac and van Vuuren, 2009), the global CO2 emissions from air conditioners in residential sector will increase rapidly in
6
the future because of the changes in temperature derived from the climate change. From these viewpoints, it is important to analyze CO2 emissions from air conditioners for climate mitigation.
1.3 Structure of this dissertation
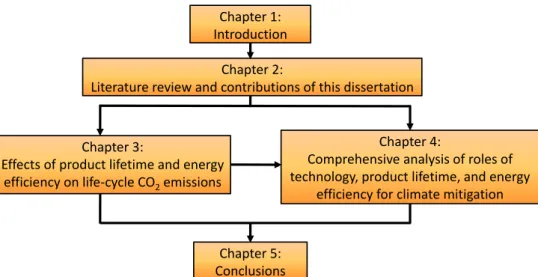
This Ph.D. dissertation comprises five chapters (See Figure 1.2). Chapter 2 conducts a review of relevant existing previous studies, identifies the contributions of those previous studies, and describes the significance and objectives of this dissertation.
Chapter 3 constructs an estimation framework for CO2 emissions focusing on air conditioners in Japan as a case study, and evaluates the effects of change in product lifetime and energy efficiency (annual electricity consumption) on the CO2 emissions.
Chapter 4 extends the estimation framework constructed in chapter 3 to environmental input-output model, conducts a comprehensive analysis for discussing polices about reducing CO2 emissions caused by air conditioners in Japan from viewpoints of industrial technology, product lifetime and energy efficiency, and discusses polices for reducing the CO2 emissions. Finally, Chapter 5 summarizes the results obtained from Chapters 3 and 4, and presents the conclusions of this dissertation.
7
Figure 1.2 Structure of this doctor dissertation
The contents of chapter 3 and chapter 4 in this doctor dissertation are research work published in the following peer-reviewed papers respectively.
Chapter 3:
Nishijima, D., 2016. Product Lifetime, Energy Efficiency and Climate Change: A Case Study of Air Conditioner in Japan. Journal of Environmental Management, vol.181, 582–589.
Chapter 4:
Nishijima, D., 2017. The Role of Technology, Product Lifetime, and Energy Efficiency
Chapter 1:
Introduction Chapter 2:
Literature review and contributions of this dissertation
Chapter 3:
Effects of product lifetime and energy efficiency on life-cycle CO2emissions
Chapter 4:
Comprehensive analysis of roles of technology, product lifetime, and energy
efficiency for climate mitigation
Chapter 5:
Conclusions
8
in Climate Mitigation: A Case study of Air Conditioners in Japan. Energy Policy, vol.104, 340–347.
9
Chapter 2. Literature review and research objectives
2.1 Relationship between product lifetime and life-cycle environmental burdens
How long consumers use their own durable goods is a critical factor for environmental burdens. This is so called ―product lifetime.‖ We can consider mainly two directions about product lifetime; shortening product lifetime and extending product lifetime. When the product lifetime of durable goods is shortened, replacement cycle of durable goods becomes faster and energy consumptions at use phase decrease due to improving energy efficiency of the durable goods. It can reduce environmental burdens at use phase, whereas the environmental burdens at disposal and production phases increase by increasing the amount of end-of–life products and new products. On the other hand, when product lifetime of durable goods is extended, replacement cycle of durable goods becomes slower and disposal and production of durable goods decrease. It can reduce environmental burdens at production and disposal phases, whereas it increases environmental burdens at use phase due to using old products with lower energy efficiency. As I mentioned above, there is a trade-off between environmental burdens caused at production and disposal phases and use phase. It is
10
important to evaluate which direction of product lifetime (shortening or extension) is better for the environment. Therefore, studies focusing on the impacts of product lifetime change are main stream of research fields that estimate environmental burdens from durable goods.
Life Cycle Assessment (LCA) gives us helpful information on the above research question. In LCA, an analyst can estimate the entire environmental burdens of a particular good considering not only use phase but resource mining, production, distribution, and disposal phases. The LCA can be applied to ‗vintage‘ and ‗new‘
durable goods, so we can compare environmental burdens associated with a ‗vintage‘
durable product with those associated with a ‗new‘ product and decide whether or not we replace our own ‗vintage‘ products with ‗new‘ ones from an environmental viewpoint.
There are many previous studies using LCA methodology (Ayres, 1995; Spielmann and Altaus, 2007; Eriksson et al., 2007; Samaras and Meisterling, 2008; Du et al., 2010;
Deng et al., 2011; Grignon-Massé et al., 2011; Aktas and Bilec, 2012; Chester and Horvath, 2012; Basbagill et al., 2013; Hawkins et al., 2013; Ardente and Mathieux,
11
2014; Bakker et al., 2014; Garcia et al., 2015; Suckling and Lee, 2015; Xiao et al., 2015; Bobba et al. 2016; Iraldo et al, 2016; Parikh and Parikh, 2016)
For a seminal study, Kiatkittipong et al. (2008) conducted life cycle assessments of computer monitors, refrigerators, light bulbs, and induction motors and showed whether we should purchase new products by comparing accumulated energy consumptions of new products with those of old products as to each product.
Tasaki et al. (2012) proposed a visualization of results obtained by the life cycle assessment. Tasaki et al. (2012) focused on 3 types of home appliances (TV, air conditioner, and refrigerator) in Japan and they conducted life cycle assessments considering product size, environmental benefits of replacing vintage products with new products, and frequency of product use. They converted the results of the life cycle assessments into diagrams for consumers‘ decision making about whether replacing with new products is environmentally preferable.
Related to the life cycle assessment, some previous studies proposed calculation methodologies about when and how often replacement of durable goods should be
12
carried out to minimize life cycle environmental burdens in a certain period. This analysis framework is called ―Life Cycle Optimization (LCO)‖ (Kim et al., 2003, 2006;
Spitzley et al., 2005; Bole, 2006; De Kleine et al., 2011). The LCO finds a best replacement schedule of a particular durable good to minimize the life cycle environmental burdens by dynamic programming. For example, Kim et al. (2003) applied the LCO methodology to automobile replacement and provided the best replacement schedule for minimizing CO, CO2 NMHC, and NOx respectively. There are also some previous studies that proposed calculation methodologies of replacement schedules to minimize environmental burdens other than LCO methodology (Chalkley et al, 2003; Mijailović, 2013; Skelton and Allwood, 2013; Mizuno et al., 2015;
Eryilmaz, 2017).
The life cycle assessment can consider the environmental burdens caused by both shortening and extending product lifetime of durable goods. There are previous studies that analyzed impacts of shortening and extending product lifetime respectively on environmental burdens from durable goods. Some previous studies analyzed the impact of a scrappage scheme on environmental burdens from durable goods. (Baltas and Xepapadeas, 1999; ECMT, 1999; Van Wee et al., 2000, 2011; Dill 2004; BenDor and
13
Ford, 2006; Lelli et al., 2010; Lenski et al., 2010; Brand et al., 2011; Sandler, 2012; Li et al., 2013; Antweiler and Gulati, 2015; DeShazo et al., 2017). A scrappage scheme are
is a policy in which a government gives consumers incentives for replacing new high energy-efficient products that a government targets. Scrappage schemes have been widely introduced in many countries not only for environmental policy but also for a measure for stimulating economy.
Lavee and Becker (2009) analyzed the impact of an accelerated vehicle retirement program in Israel by cost-benefit analysis. They considered three types of cars that are private cars, trucks and buses. They found that for private cars, an accelerated vehicle scrappage program can generate significant benefits and lower air pollution by approximately 17%. Conversely, conducting an accelerated vehicle scrappage program for buses and trucks makes negative net benefits. They also discussed the causes of the difference in effect of the program to private cars and trucks and buses. They mentioned that differences in natural retirement rate or reduction rate of air pollution due to replacement between car types make the difference in effects of the program.
Lenski et al. (2013) conducted a cost-benefit analysis of the vehicle scrappage
14
program in US which is also called ‗Cash for Clunkers‘ considering both economic and environmental benefits at a life cycle perspective. They showed that the vehicle scrappage program could contribute to avoiding carbon dioxide and pollutant emissions.
They also discussed more effective design of the vehicle scrappage program. They pointed out that more economic and environmental benefits could have been achieved by a lower value of rebate, auction mechanism for setting rebate value, and targeting to areas where damages from emissions are relatively higher.
There are also some previous studies focusing on effects of product lifetime extension on environmental burdens from durable goods (Cooper, 2005; Kagawa et al., 2008, 2009, 2011; Defra, 2011). For example, Kagawa et al. (2006) quantitatively analyzed impacts of product lifetime extension of automobiles on energy consumptions and economy in Japan by the environmental input-output framework considering some consumption pattern shifts induced by product lifetime extension. They revealed that product lifetime extension can realize significant energy consumptions and GDP increase if consumers spend income gains obtained from product lifetime extension on consumer services.
15
2.2 Scenario analyses for future environmental burdens associated with stock and flow of durable goods
There is another main research field about environmental burdens from durable goods. That is a scenario analysis about future environmental burdens from durable goods focusing on stock and flow of durable goods. This research field can give an estimation framework for the environmental burdens including some factors (e.g.
population, distribution rate, product lifetime, energy efficiency in use) as parameters.
Once we construct the forecasting framework, we can estimate the future environmental burdens from consumer durables using the framework. Changing the parameters in the framework and comparing the estimation results, we can also evaluate the reduction potential of changes in each factor and propose combined scenarios for achieving a reduction target of environmental burdens. As to environmental burdens from durable goods, we firstly set initial number of stock of particular durable goods and estimate the future number of stock, replacement demand, and waste of durable goods. Then, we forecast the environmental burdens from durable goods by multiplying those estimated numbers by emission coefficients (Lumbreras et al., 2008; Yang, et al., 2009; Kromer et al., 2010; Hao et al., 2011, 2016; Baptista et al., 2012; Palencia et al., 2012; Singh and
16
Strømman, 2013; Ürge-Vorsatz et al. 2015; Mittal et al., 2016; Alam et al., 2017; Zhao and Heywood, 2017).
Müller (2006) introduced a material flow analysis system for stock dynamics considering population, product lifetime, material intensity and service unit a stock provides. He applied the analysis into concrete in housing stock in Netherland as a case study and estimated the future stock of concrete in housing. Moreover, he changed the values of parameters about product lifetime, material intensity and useful floor area (service unit of housing in this study) and analyzed the effects of those changes on concrete stock in housing.
Melaina and Webster (2011) developed a formula for estimating greenhouse gas emissions from motor vehicle travel, utilizing three factors that are travel distance per a unit, fuel consumption, and fuel carbon intensity. They also conducted scenario analyses aimed at achieving the greenhouse gas emission target set by the U.S. government for the year 2050. They showed that all the three factors must progress significantly for achieving the greenhouse gas reduction target.
17
2.3 Statistical estimation of product lifetime models
Most of the previous studies about environmental burdens from durable goods used statistical product lifetime models. The widely-used statistical product lifetime model is lifetime distribution (or lifetime function). This product lifetime model expresses a relationship between disposal rate (survival rate) of a particular durable good and their usage duration. Using this product lifetime distribution, we can get the disposal or survival probabilities of durable goods corresponding to their usage duration and also can calculate the stock of materials and products (Bergsdal et al., 2007; Oguchi et al., 2008; Hu et al., 2010; Huo and Wang, 2012; Pauliuk and Müller, 2014; Chen and Graedel, 2015; Golev et al., 2016; Cao et al., 2017;Guo and Yan, 2017; Miatto et al., 2017), the number of waste products (Kim et al., 2008; Walk, 2009; Oguchi et al., 2010;
Zhang et al., 2011; Araújo et al., 2012; Polák and Drápalová, 2012; Pant 2013; Hauber et al., 2014; Rahmani et al., 2014), material or substance flow (Melo, 1999; Kleijn et al.,
2000; Tasaki et al., 2004; Davis et al., 2007; Hashimoto et al., 2007; Yoshida et al., 2009; Kapur et al., 2008; Hatayama et al., 2010; Huang et al., 2013; Lam et al., 2013;
Pauliuk et al., 2017), and associated environmental burdens (Samaras et al., 1999; van der Voet et al., 2002; Kakudate et al., 2002; Cheah et al., 2009; Yan and Crookes 2009;
18
Zhou et al., 2011; Cai et al., 2015; Xue et al., 2017). The product lifetime distribution has such benefits for estimating environmental burdens induced by durable goods and it has been widely used in many previous studies.
The product lifetime distributions are statistically estimated by actual data about existing or disposed products based on some types of distribution function. As to product lifetime function of durable goods, Weibull distribution function has been widely used and statistically well fitted for estimating the product lifetime. Murakami et al. (2010) and Oguchi et al. (2010) explained about definitions of some types of product
lifetime, estimation methodologies of product lifetime distribution, and information on data of product lifetime distribution more concretely. Many product lifetime distributions have been estimated as to a variety of products in different countries (Bayus, 1988; Cohen and Whitten, 1988; Islam and Meade, 2000; Tasaki et al., 2001;
Oguchi et al., 2006, 2010; Erumban, 2008; Babbitt et al., 2009; Murakami et al., 2010;
Kagawa et al., 2011; Daigo et al., 2007, 2015; Oguchi and Fuse, 2015, Miller et al., 2016); Petridis et al., 2016; Weymar and Finkbeiner, 2016).
19
2.4 Contributions of this dissertation
From the comprehensive overview of the previous studies about environmental burdens from durable goods, those previous studies contributed to discussions about reducing environmental burdens from durable goods mainly on the following two points.
The first point is that the previous studies have clarified the relationship between product lifetime and environmental burdens induced by durable goods. As I mentioned in section 2.1, product lifetime has a large influence on those environmental burdens. In that point, life cycle assessment considers both shortening and extending product lifetime as measures for reducing the environmental burdens. There are also previous studies focused on the effects of shortening or extending product lifetime respectively on environmental burdens from durable goods. Those previous studies help us to discuss how long we should use our own products from an environmental perspective.
The second point is that the previous studies have shown the reduction potential of not only product lifetime change but the other factors such as change in energy
20
efficiency and/or technologies of durable goods. Previous studies in section 2.2 constructed estimation frameworks of environmental burdens based on stock of durable goods including a variety of factors such as population and carbon or material intensity.
These previous studies not only estimated environmental burdens derived from durable goods in the future, but also showed integrated scenarios for achieving particular reduction targets. The results can help especially policymakers to understand how they can achieve reduction targets they are imposed.
However, the previous studies have not analyzed yet as below. One is that they have not statistically modeled empirical trends of energy efficiency in use of durable goods.
When we discuss the reduction potential of energy efficiency improvement for reducing environmental burdens, we should consider historical technological progress about energy efficiency. Although some previous studies analyzed effects of energy efficiency improvement on environmental burdens induced by durable goods, they did not consider that point. We should capture features of historical trend of energy efficiency by statistically modelling empirical trend of energy efficiency and discuss reduction policies of the environmental burdens more empirically.
21
The other point is that the previous studies did not discuss reduction of environmental burdens from durable goods with simultaneous consideration of both micro factors such as product lifetime and energy efficiency of particular durable goods, and macro factors such as industrial technologies surrounding the durable goods including supply chains. Most of the previous studies focused on reduction measures of environmental burdens from durable goods based on product lifetime or energy efficiency. However, upstream industries centered around durable goods have also an important role of reducing life-cycle environmental burdens from the durable goods and we should take those industries into account for discussing reductions in the environmental burdens along the supply-chains. Few previous studies considered the impacts of industries surrounding durable goods on the environmental burdens and there is no comprehensive analysis for the environmental burdens simultaneously considering product lifetime, energy efficiency, and industries related to durable goods.
Motivated by the shortcomings of the previous studies above, this doctoral dissertation focuses on life-cycle CO2 emissions caused by air conditioners in Japan as a case study. In chapter 3, I statistically model the product lifetime and trend of energy efficiency of air conditioners in Japan. Using those models, I estimate the number of
22
stock and replacement of air conditioners and CO2 emissions induced by air conditioners. Finally, I conduct scenario analyses about the effects of change in product lifetime and energy efficiency in use of air conditioners on CO2 emissions. Through the results, I evaluate the CO2 reduction potential of change in product lifetime and energy efficiency and quantitatively show a target value of improvement rate of energy efficiency for conducting scrappage schemes such as ―Home appliance eco-point program‖. In chapter 4, I connect the models of product lifetime and energy efficiency modeled in chapter 3 with the environmental input-output framework and construct the comprehensive analytical framework for CO2 emissions induced by air conditioners in Japan during the period from 1990 to 2005. Using the constructed framework, I conduct a structural decomposition analysis to find specific industrial sectors that indirectly contributed to increasing the CO2 emissions during the period. I also conduct scenario analyses about the impacts of change in product lifetime and energy efficiency on the CO2 emissions and quantitatively shows combinations of shortening or extending product lifetime and energy efficiency improvement necessary for holding the CO2
emissions in 2005 at 1990 level. Finally, based on the results of analyses above, I discuss comprehensively how we should reduce CO2 emissions induced by air conditioners from viewpoints of industrial technology surrounding air conditioners,
23
product lifetime, and energy efficiency.
This doctoral dissertation discusses reduction measures of CO2 emissions induced by air conditioners in Japan comprehensively considering not only microscopic factors of durable goods such as product lifetime and energy efficiency in use, but macroscopic factors such as technology of industries surrounding the durable goods. The outcomes showed in this dissertation are useful for policymakers and durable goods industries and also enable us to develop discussions for reducing CO2 emissions from durable goods.
24
Chapter 3 Effects of product lifetime and energy efficiency on life-cycle CO2 emissions
3.1 Introduction
After the United Nations Framework Convention on Climate Change was adopted in 1992, with the aim of stabilizing the concentration of greenhouse gases in the atmosphere, a worldwide effort began to combat global warming. As a result of the various initiatives, Japan took toward climate mitigation, it managed to reduce GHG emissions in 2014 by 3.1% compared to those in 2013 (Ministry of the Environment of Japan, 2016). However, since Japan has to conduct a reduction of 26% GHG emissions by 2030 compared to 2013 in Paris Agreement (Ministry of Foreign Affair of Japan, 2016), additional GHG reductions are needed. The residential sector accounted for a substantial proportion of total emissions—15.2% in 2014 (Ministry of the Environment of Japan, 2016)—so the reduction of total residential CO2 emissions appears to be an urgent challenge for Japan.
As I described in chapter 1, residential air conditioners are the fourth largest source
25
of consumption, which also means that they are a major source of CO2 emissions (Agency for Natural Resources and Energy, Japan, 2010). The energy efficiency of residential air conditioners has greatly improved in recent years as a result of the increased efficiency of compressors and heat exchangers, together with the adoption of inverter technology. A comparison of air conditioners with an energy efficiency of 2.8 kW (sufficient to cool a room of approx. 18 m2) reveals that a typical model made in 2013 consumes about 40% less energy than does one made in 1995.More recently, however, the energy efficiencies of air conditioners have improved only marginally, as their technology approaches its limits (Agency for Natural Resources and Energy, Japan, 2010, 2011, 2012, 2013, 2014).
Even as efforts to improve the energy efficiency of residential air conditioners face technological limitations, the reduction of CO2 emissions remains an urgent task. In addition, the environmental concerns of consumers continue to mount. Nevertheless, because replacement purchases of new air conditioners do not promise any significant gains in energy efficiency, from both economic and environmental viewpoints, consumers have an incentive to continue using their current air conditioners for a longer time. This results in fewer replacement purchases of new air conditioners and a smaller
26
quantity of CO2 emissions generated in the production phase of residential air conditioners. On the other hand, when old air conditioners are retained for a longer time, replacement purchases of new higher efficiency models are delayed, resulting in higher CO2 emissions in the use phase. Thus, in considering how a longer use of residential air conditioners affects CO2 emissions, there is a trade-off between CO2 emissions arising from the production phase and those arising from the use phase.
Many previous studies focused on the trade-off above mentioned and estimated the impacts of product lifetime and energy efficiency of durable goods on environmental burdens (Kondo and Nakamura, 2004; Van Schaik and Reuter, 2004; Müller et al., 2006; Nakamura and Kondo, 2006; Ou et al., 2010; Beccali et al., 2013, 2014, 2016;
Cellura et al., 2014; Finocchiaro et al., 2016). Kagawa et al. (2011) evaluated the impacts of change in product lifetime on total CO2 emissions from vehicle use in Japan and showed that extending product lifetime of vehicles can contribute to reducing CO2
emissions. Yokota et al. (2003) assumed that the lifetime distribution of residential air conditioners followed a gamma distribution in estimating total life-cycle CO2 emissions of residential air conditioners in Japan for the period from 1990 to 2010, including emissions during manufacturing, use, and waste disposal. Furthermore, they examined
27
the degree to which changes in the average lifetime of residential air conditioners and changes in the recovery rate of refrigerant at the time of waste disposal impacted life-cycle CO2 emissions.
The following points, however, were not analyzed. First, trends in the energy efficiency of residential air conditioners were not modeled and empirically analyzed.
Second, the impact on life-cycle environmental load in the case that the average lifetime and energy efficiency both change at the same time was not considered. Finally, they did not show to what degree does the diminishing rise in the energy efficiency of residential air conditioners hold back the reduction of CO2 emissions that occurs when the lifetime of air conditioners becomes shorter (by accelerating new replacement purchases).
In this chapter, I used a Weibull distribution model to estimate the total stock of residential air conditioners between 1990 and 2013 in order to compute the total life-cycle CO2 emissions (sum of production-phase and use-phase emissions) associated with residential air conditioners for this period. In addition, I modeled the trend in annual energy efficiency (i.e., annual electricity consumption) of an ―average‖ air
28
conditioner sufficient to cool a room of approximately 18 m2 as a reverse logistic curve with respect to time, and from the estimated parameters of the reverse logistic curve, I determined the technologically critical (limit) value of energy efficiency. Using the results of this estimation, I conducted scenario analyses in order to investigate how changes in product lifetime and energy efficiency impact the lifecycle CO2 emissions and how much we should improve energy efficiency of air conditioners for holding back the reduction of CO2 emissions that occurs when the lifetime of air conditioners becomes shorter (by accelerating new replacement purchases). It should be noted that since life-cycle CO2 emissions associated with an end-of-life household air conditioner are negligibly small (Nakamura and Kondo, 2006), this study did not consider the end-of-life phase in the proposed analysis framework.
The rest of this paper is organized as follows: Section 3.2 provides a literature review; Section 3.2 formulates the methodology developed in this study; Section 3.3 presents the empirical results and discussion; Section 3.4 presents our conclusions.
29
3.2 Methodology
3.2.1 Estimating the stock of residential air conditioners and the number of new
residential air conditioners sold each year
The survival rate in year t of the air conditioners newly sold in year i , ti is assumed to follow a Weibull distribution, as follows:
exp
β t i
φ t i t i
α
(3.1)
where and respectively represent the scale parameter and shape parameter of the distribution. Weibull distributions fit the data well and are widely used to model the product lifetimes of various kinds of durable goods (e.g., Kagawa et al., 2011; Oguchi and Fuse, 2015). Note that when ti, Eq. (3.1) gives the proportion of the new household air conditioners sold in year i that remain in use in year i as 1. The mean value of the Weibull distribution function (that is, average product lifetime) is given by
30
1 1
(3.2)
where
m is the gamma function, which can be expressed as
0
1da a e
m a m . In
this study, I set the values of scale parameter and shape parameter to 7.9 and 1.8 respectively, as specified in the research report ―Reuse Promotion of End-of-Life Products‖ (Ministry of the Environment of Japan, 2011). Therefore, using the
above-adopted values for the scale and shape parameters, the average lifetime of household air conditioners, as a baseline, is 12.6 years.
Specifying the survival rate of air conditioners as in Eq. (3.1), the stock of residential air conditioners St
in year t can be estimated using the following equation:1 1
( ) ( ) t ( ) ( )
t t t i i
i
S μ B μ φ μ B μ
(3.3)where Bt
(Bi
) and ti
are the number of newly sold residential airconditioners in year t(i), and the survival rate in condition that average lifetime of air conditioners is 12.6 years, respectively..
31
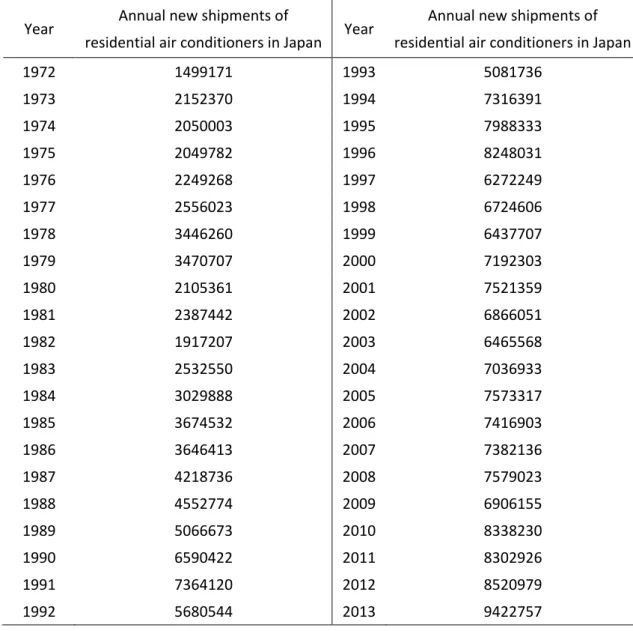
Using the data on annual new shipments of residential air conditioners in Japan for the 42 years from 1972 to 2013, as published by the Japan Air Refrigeration and Air Conditioning Industry Association (The Japan Air Refrigeration and Air Conditioning Industry Association, 2015) (see Table 3A of the Appendix 3A for the shipment data) as
(i1972,1973,,2013)Bi in Eq. (3.3), which expands to the system of equations
1972 41
2011 2
2012 1
2013 2013
1972 2
1973 1
1974 1974
1972 1
1973 1973
1972 1972
B B
B B
S
B B
B S
B B
S
B S
(3.4)
I estimated the stock of air conditioners in each year on the basis of the current average product lifetime. Note that I assume that all air conditioners are following the same lifetime distribution, irrespective of their age (i.e., year of production).
For purposes of analysis, in this study the stock of air conditioners in each year estimated using Eq. (3.4), remains constant with respect to lifetime. Under this assumption, I consider a change in the average product lifetime of air conditioners from
6 .
12
to * such that the survival rate changes from ti
to ti
* while32
remaining a Weibull distribution. Then from eq. (3.4), the annual numbers of new residential air conditioners sold in the 42-year period from 1972 to 2013
* (i1972,1973,,2013)Bi can be estimated sequentially as follows:
*
*
*
* :
*
*
*
*
*
*
*
*
*
*
*
*
*
*
*
1972 41
2011 2
2012 1
2013 2013
1972 2
1973 1
1974 1974
1972 1
1973 1973
1972 1972
1972
B B
B S
B
B B
S B
B S
B
S S
B
(3.5)
3.2.2 Household air conditioner energy efficiency and its time series trend
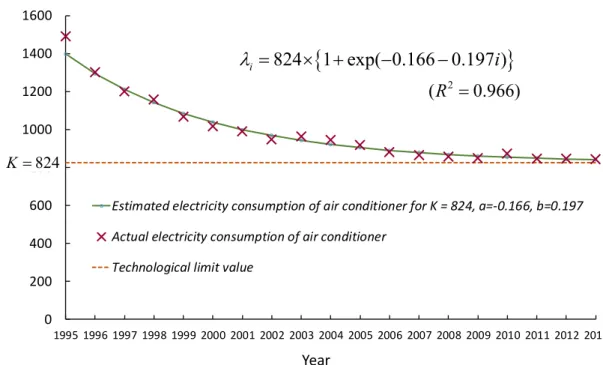
In terms of estimating the impact on CO2 emissions associated with household air conditioners, another important factor (in addition to change in product lifetime) is change in energy efficiency (i.e., annual electricity consumption). To assess the impact on CO2 emissions of changes in air conditioner electricity consumption, I assume in this study that the annual electricity consumption per air conditioner unit manufactured in year i, i, follows a reverse logistic function,
1 expa bi)
i K
(3.6)
33
where K is the critical value, and a and b are parameters, with b0. The reverse logistic function is a decreasing function with respect to i, with the characteristic that as i approaches infinity, i converges towards K.
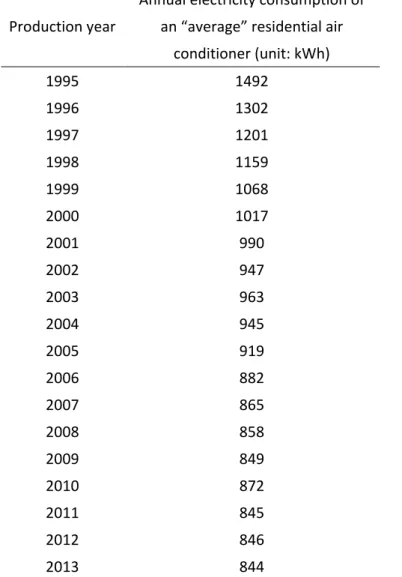
I made use of annual electricity consumption data for ‗average‘ household air conditioners (sufficient to cool a room of approximately 18 m2) manufactured between 1995 and 2013 from a government ―Energy-saving Performance Catalog‖ (Agency for Natural Resources and Energy, 2010, 2011, 2012, 2013, 2014) to estimate the reverse logistic function. The data used in this estimation are provided in Table 3B of Appendix 3B. I estimated the function parameters aˆ and bˆ in eq. (3.6) for different fixed critical values K and obtained the coefficient of determination of the reverse logistic curve by regression analyses. I obtained the highest coefficient of determination
) 966 . 0
(R2 with values Kˆ 824, aˆ0.166, and bˆ0.197 (see Fig. 3.1).
34
Figure 3.1 Catalog-based annual electricity consumption of an ―average‖ residential air conditioner and estimated consumption based on a reverse logistic function
In the following analysis, I assume the annual electricity consumption of residential air conditioners manufactured in each year on a baseline to follow Eq. (3.6) for K 824. Because I could not obtain electricity consumption data for household air conditioners for 1994 or earlier years, I assumed for this study that air conditioner electricity consumption for the years up to 1994 was the same as that for air conditioners manufactured in 1995.
The estimated value Kˆ can be considered a critical electricity consumption value
0 200 400 600 800 1000 1200 1400 1600
1995 1996 1997 1998 1999 2000 2001 2002 2003 2004 2005 2006 2007 2008 2009 2010 2011 2012 2013 Estimated electricity consumption of air conditioner for K = 824, a=-0.166, b=0.197 Actual electricity consumption of air conditioner
Technological limit value
Electricity consumption of air-conditioner (unit: kWh)
824 1 exp( 0.166 0.197 )
i i
(R2 0.966)
824 K
Year
35
expressing a technological limit for household air conditioners, which can be estimated from empirical values of electricity consumption. That is, the electricity consumption of household air conditioners is changing from 1,492 kWh in 1995 to a future technological limit value of 824 kWh.
It is well known that the annual electricity consumption of an ―average‖ residential air conditioner provided by the ―Energy-saving Performance Catalog‖ database (i.e.
catalog-based annual electricity consumption) is not the ‗actual‘ annual electricity consumption occurring in the residential sector. According to the research report by the National Institute of Advanced Industrial Science and Technology (AIST) of Japan (2010), the actual annual electricity consumption of residential air conditioners is 18%
of the catalog-based annual electricity consumption if one considers usage time of residential air conditioners. Thus, in this study, I multiply the values of i by 18% and use the results as the annual electricity consumption of air conditioners produced for the corresponding years.
36
3.2.3 Method of estimating the electricity consumption and CO2 emissions of residential
air conditioners
Next, I estimate the total electricity consumption of air conditioners during their use phase. The electricity consumed in year t by residential air conditioners C
t can be expressed as follows:
t i
i i t
i B
t C
1972
*
*
(3.7)
Then, by multiplying Eq. (3.7) by the life-cycle CO2 emissions coefficient per kilowatt-hour for air conditioners in the use phase r, the CO2 emissions from air conditioners in year t, Er
t , is calculated as follows:) ( )
(t C t
Er
r (3.8)Next, I estimate Ep
t , the CO2 emissions of residential air conditioners in the production phase in year t. This is done using the life-cycle CO2 emissions coefficient37
p, which represents the quantity of emissions generated in manufacturing one air conditioner, as follows:
p t
*p t B
E (3.9)
The life-cycle CO2 emissions coefficients for the use and production phases were set as 0.0005
r r0.0005 and p 0.31 (tonnes of CO2 equivalent), respectively, based on ―Guidelines for the Calculation of Greenhouse Gas Emission Intensities Throughout the Supply Chain Ver. 2.1‖ (Ministry of the Environment of Japan, 2014). In this study, it is assumed that air conditioners purchased in year t are manufactured in that same year.
Now, using Eqs. (3.8) and (3.9), the total life-cycle CO2 emissions E
t for residential air conditioners can be determined as follows.) ( ) ( )
( t E t E t
E
r
p (3.10)38
3.2.4 Scenario analysis of the influence on CO2 emissions of changes in average lifetime
and the critical value of electricity consumption of residential air conditioners
I will explain the scenario analyses on how the average product lifetime of residential air conditioners influences total CO2 emissions. I vary the average product lifetime by changing the mean value of the Weibull distribution function shown in Eq. (3.1) and analyze the impacts of these changes on total CO2 emissions. I estimate life-cycle CO2 emissions when the average lifetime is reduced by 1 year and extended by 1 year relative to the average lifetime value of 12.6 years estimated by the Ministry of the Environment (2011). More specifically, along the lines of Kagawa et al. (2006, 2009, 2011), I fix the value of the shape parameter at 1.8 and re-estimate the values of required to make the average lifetime in Eq. (3.2) 11.6 and 13.6 for the shorter and longer lifetime scenarios, respectively. Then from the Weibull distribution functions obtained with both parameters, I determine the survival rate for each scenario and estimate the life-cycle CO2 emissions for both the use and production phases from Eqs. (3.8) and (3.9).
39
Next, I conduct a scenario analysis to assess how changes in the critical value of annual electricity consumption of residential air conditioners K influences life-cycle CO2 emissions. More specifically, I estimate the electricity consumption in the case that the critical value of annual electricity consumption is reduced by 100% from
ˆ 824
K , i.e., to (1)Kˆ. It is noted that when 0, the values of Eq. (3.6) are annual electricity consumption of air conditioners manufactured in each year as a baseline In this study, I set the value of the parameters in Eq. (3.6) to aˆ0.166 and
197 . ˆ0
b to determine the annual electricity consumption i of residential air conditioners manufactured in each year for three scenarios: reductions of the electricity consumption limit value by 5% ( 0.05), by 10% ( 0.1), and by 15% ( 0.15).
For each of these scenarios, I then estimate the life-cycle CO2 emissions. This analysis examines the potential for reducing CO2 emissions not only by changing the average product lifetime but also by improving the energy performance of air conditioners.
3.3 Empirical results and discussion
3.3.1 Trend in stock of residential air conditioners over the years
40
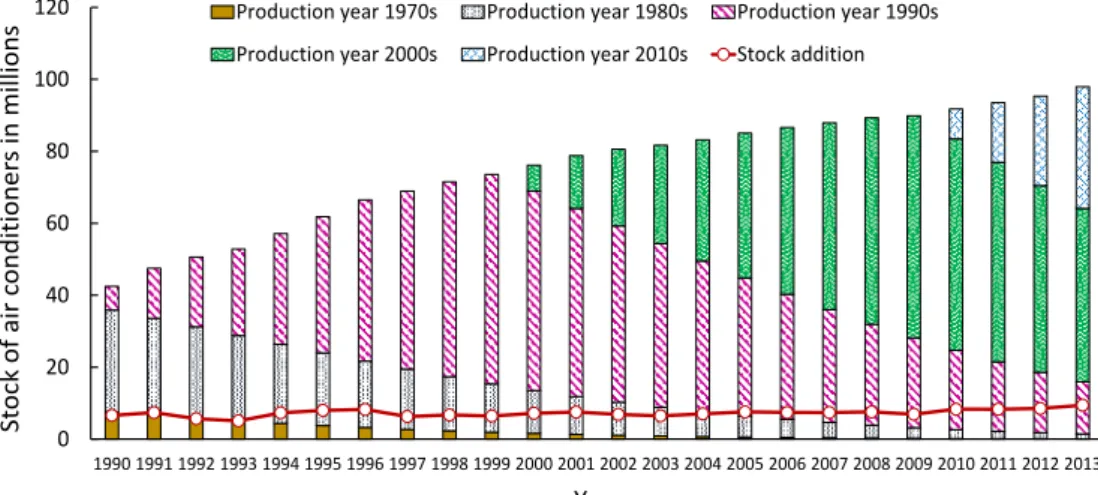
Figure 3.2 shows the stock of residential air conditioners between 1990 and 2013, as estimated using Eq. (3.4), as well as the number of residential air conditioners that were shipped domestically, according to data provided by the Japan Air Refrigeration and Air Conditioning Industry Association (2015). It is clear from Fig. 3.2 that the total stock of residential air conditioners has consistently risen. Interestingly, despite the fact that Japan‘s population began to decline between 2009 and 2013 (Statistics Bureau, Japan, 2015), the stock of air conditioners over this period continued to increase in the same manner as below. However, from 1990 to 2013 the number of households in Japan rose steadily from 41.15 to 54.59 million (Statistics Bureau, Japan, 2015), much like the air conditioner numbers. Considering that air conditioners are a type of durable good that is installed on a per-household or per-room basis, it is natural that the stock of air conditioners increase roughly in line with the number of households. From this observation, I find that the air conditioner stock moves primarily in response to the number of households rather than to the current population. According to estimates by the National Institute of Population and Social Security Research of Japan (2013), the number of households in Japan is expected to continue increasing until 2019. In light of this, the stock of air conditioners is also likely to continue rising, which means that the impact of air conditioners on climate change will also continue to grow bigger.
41
Figure 3.2 Total stock of residential air conditioners and new air conditioner shipments
3.3.2 Change in CO2 emissions in production and use phases for each average lifetime
scenario
Next, I look at life-cycle CO2 emissions when the average product lifetime is reduced and extended by 1 year from the baseline scenario (12.6, 0), to 11.6 and 13.6 years, respectively.
Figure 3.3 shows the change in production-phase CO2 emissions of residential air conditioners for the baseline level of 12.6 years and extended and reduced by 1 year.
0 20 40 60 80 100 120
1990 1991 1992 1993 1994 1995 1996 1997 1998 1999 2000 2001 2002 2003 2004 2005 2006 2007 2008 2009 2010 2011 2012 2013 Production year 1970s Production year 1980s Production year 1990s
Production year 2000s Production year 2010s Stock addition
Stock of air conditioners in millions
Year
42
Production-phase CO2 emissions are lowest for the scenario in which the average product lifetime is extended by 1 year to 13.6 years. This can be explained by the fact that increasing the air conditioner lifetime tends to depress the number of new air conditioners produced. The estimated production-phase CO2 emissions (in millions of tonnes) in 2013 for the three average product lifetime scenarios are 3.08 for 11.6 years, 2.89 for 12.6 years, and 2.73 for 13.6 years. Thus, extending the average product lifetime by 1 year enables a 5.5% reduction in emissions in 2013 relative to the baseline average product lifetime scenario of 12.6 years.
Figure 3.3 Production-phase CO2 emissions of residential air conditioners for each average product lifetime scenario
Year
CO2emissions generated in production phase per year (unit: Mt-CO2-eq) 0 1 2 3 4
2000 2001 2002 2003 2004 2005 2006 2007 2008 2009 2010 2011 2012 2013 μ = 11.6, ε= 0 μ = 12.6, ε= 0 μ = 13.6, ε= 0
43
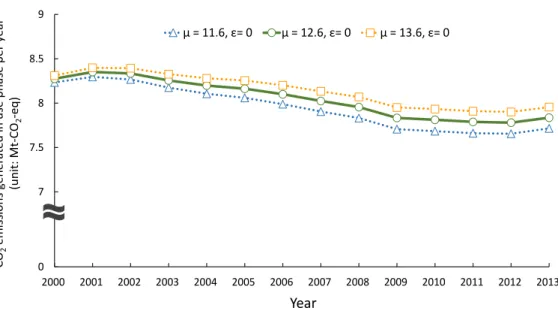
Although there was very little difference in use-phase emissions between the scenarios, as shown in Fig. 3.4, emissions are lowest when the average product lifetime is 11.6 years. This is likely to be because a shorter lifetime tends to increase the number of more energy-efficient, newer air conditioners as a proportion of the total stock of air conditioners in use. The use-phase CO2 emissions (in millions of tonnes) for the three average product lifetimes are 7.72 for 11.6 years, 7.84 for 12.6 years, and 7.96 for 13.6 years. Thus, reducing the average lifetime by 1 year enables a 1.5% reduction in use-phase CO2 emissions in 2013 relative to the baseline average product lifetime scenario of 12.6 years.
The results reveal that when the average product lifetime is reduced, there is a trade-off between the reduction in emissions during product use (use phase), due to the additional purchases of new, more energy-efficient air conditioners, and the increase in emissions arising from the additional production of new air conditioners stimulated by the reduction of the average product lifetime.
44
Figure 3.4 Use-phase CO2 emissions of residential air conditioners for each average product lifetime scenario
3.3.3 Total residential air conditioner CO2 emissions in production and use phases for
each scenario
Here, I show how the total CO2 emissions for residential air conditioners, from both the production and use phases, are influenced by reducing the average product lifetime by 1 year (11.6, 0) and by extending it by 1 year (13.6, 0) relative to the baseline value of 12.6 years. It is important to note that further development toward cleaner air conditioners has a large potential for reducing life-cycle CO2 emissions.
Therefore, for the baseline value of the average product lifetime (12.6 years), I also
0 1.5 3
2000 2001 2002 2003 2004 2005 2006 2007 2008 2009 2010 2011 2012 2013 μ = 11.6, ε= 0 μ = 12.6, ε= 0 μ = 13.6, ε= 0
6.5 7 7.5 8 8.5 9
2000 2001 2002 2003 2004 2005 2006 2007 2008 2009 2010 2011 2012 2013 μ = 11.6, ε= 0 μ = 12.6, ε= 0 μ = 13.6, ε= 0
CO2emissions generated in use phase per year (unit: Mt-CO2-eq)
Year
45
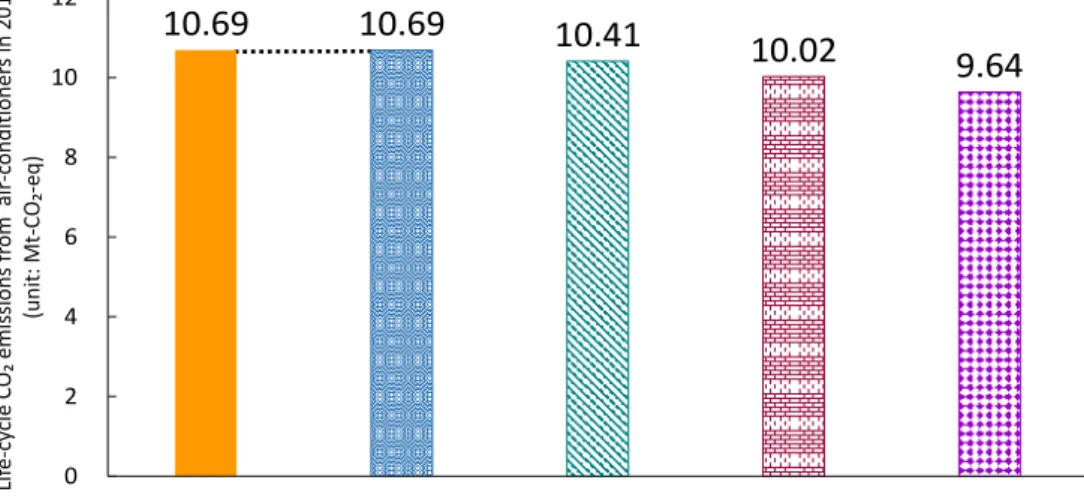
show the effect of lowering the critical value of electricity consumption Kˆ 824 by 5% (12.6, 0.05), 10% (12.6, 0.1), and 15% (12.6, 0.15). Figure 3.5 graphically displays the difference in total CO2 emissions (production phase plus use phase) for each of these scenarios relative to the baseline case (12.6, 0).
First, the results for total CO2 emissions for each average product lifetime scenario are that total emissions are lowest when the average product lifetime is extended by 1 year to 13.6 years, and highest when the average product lifetime is reduced by 1 year to 11.6 years. The estimates of total CO2 emissions (millions of tonnes) for 2013 are 10.79 for 11.6 years, 10.73 for 12.6 years, and 10.69 for 13.6 years. Thus, extending the average product lifetime by 1 year enables a CO2 emissions reduction of approximately 0.4% in 2013 relative to the baseline scenario. This result suggests that at the current level of air conditioner energy efficiency (technology level) (i.e., K824), reducing life-cycle CO2 emissions would be more effectively achieved by extending the average product lifetime to make better use of existing air conditioners than by increasing the average energy efficiency of the stock of air conditioners by reducing the average product lifetime.
46
Next, analysis on how changes in the critical value of electricity consumption influence CO2 emissions reveals that reducing the critical value of annual electricity consumption by 5%, 10%, and 15% would cut life-cycle CO2 emissions to 10.34, 9.95, and 9.55 million tonnes, respectively. Also, a comparison of CO2 emission levels in the case of extending average product lifetime by 1 year to 13.6 years and in the cases of reducing the critical value (of annual electricity consumption) by 5%, 10%, and 15%
reveals that emissions can be reduced more by lowering the critical value of annual electricity consumption by 5% than by extending the average product lifetime by 1 year, as shown by Fig. 3.5. An additional finding is that the emission reduction effect of extending the average product lifetime by 3 years is still lower than that of improving the critical value of electricity consumption by 5% (see Fig. 3A at Appendix 3C for more comprehensive results on potential changes in life-cycle CO2 emissions through changing average product lifetime and the critical value of electricity consumption).
This result suggests that if we had to decide whether to try to reduce the life-cycle CO2
emissions of air conditioners either by extending the average product lifetime or by improving the energy efficiency, it would be better to try to improve the electricity consumption, even taking into account the adverse economic impact due to the depressing effect that extending the average product lifetime has on replacement air