Japanese sign language classification based on gathered
images and neural networks
Shin-ichi Ito a,1,*, Momoyo Ito a,2, Minoru Fukumi a,3
a Tokushima University, 2-1 Minami-josanjima, Toksuhima 770-8506, Japan
1[email protected]; 2 [email protected]; 3 [email protected]
* corresponding author
1. Introduction
Sign language (SL) is one of the communication tools for humans. In communication between humans and computers, it is important to develop the communication tool and to make SL recognition techniques. SL includes fingerspelling and a hand gesture. In the hand gesture, there are a finger alphabet and a hand motion.
There are lots of techniques to classify the SL for hand-shape feature extraction, hand and/or finger motion feature extraction, and SL word classification [1]–[28]. In the hand-shape feature extraction, Jeballi et al. [9] classified French SL using HMM, Ranga et al. [10] classified American SL using Gobor filter with wavelet transform and CNN, and Tao et al. [12] classified the American SL alphabet using CNN. In the hand and/or finger motion feature extraction, Silanon [14] classified Thai fingerspelling using histograms of the orientation gradient feature and Phitakwinai et al. [15] classified Thai SL using scale-invariant feature transform. In the SL word classification, Pariwat et al. [16] classified Thai SL using SVM. Pigou et al. [17] classified the hand gestures of SL using CNN, Molchanov et al. [18]
classified hand gestures using 3D CNN, Mukai et al. [19] classified JSL using SVM, and Takayama and Takashi [20] classified JSL using an improved HMM. It requires a specific size of input data for machine learning technique.
It is not easy to specify the size because they are differences of SL speed on each human and length of word of SL. Furthermore, Rao et al. [21] classified SL using CNN and used a dataset wherein the sample size was maintained constant. If it is possible to gather information on word of SL, it is no need to specify the size and possible to develop the method to classify SL words without depend on language speed and length of word.
A R T I C L E I N F O A B S T R A C T
Article history
Received May 31, 2019 Revised August 25, 2019 Accepted September 29, 2019 Available online October 29, 2019
This paper proposes a method to classify words in Japanese Sign Language (JSL). This approach employs a combined gathered image generation technique and a neural network with convolutional and pooling layers (CNNs). The gathered image generation generates images based on mean images. Herein, the maximum difference value is between blocks of mean and JSL motions images. The gathered images comprise blocks that having the calculated maximum difference value. CNNs extract the features of the gathered images, while a support vector machine for multi-class classification, and a multilayer perceptron are employed to classify 20 JSL words. The experimental results had 94.1% for the mean recognition accuracy of the proposed method. These results suggest that the proposed method can obtain information to classify the sample words.
This is an open access article under the CC–BY-SA license.
Keywords
Japanese sign language gathered image mean image
This paper proposes a novel method to gather image to classify JSL words without dependence on language speed, and length of word. This study implementvarious claasification techniques, susch as neural networks with convolutional and pooling layers (CNNs), SVM for multi-class classification (MSVM), and a multilayer perceptron (MLP).
2. Method
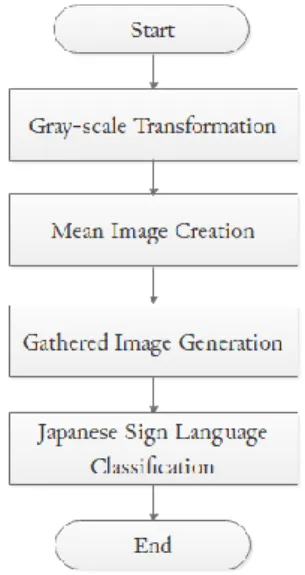
The proposed method consists of grayscale transformation, mean image creation, gathered image generation, and JSL word classification. Flowchart of JSL words classification method is shown in
Fig. 1. Each step is detailed in the following sections.
Fig. 1. Flowchart of JSL words classification method (proposed method). 2.1. Grayscale Transformation for Preprocessing
Fig. 2 shows a grayscale transformation. In this preprocessing stage, grayscale images are created by transforming on all images after the video is converted to still images, as follows
𝐺𝑟𝑎𝑦 = 0.299 ∗ 𝑅 + 0.587 ∗ 𝐺 + 0.114 ∗ 𝐵
where Gray is grayscale value of each pixel. B, G, and R are the blue-, green-, and red-scale values, respectively.
Fig. 2. Gray-scale transformation. 2.2. Mean Image Creation
A mean image is created by calculating the average value on each block divided into N × M pixels as follows:
𝑀𝑒𝑎𝑛(𝑥, 𝑦) = ∑ 𝐺𝑟𝑎𝑦𝐼𝑚𝑎𝑔𝑒 𝑖(𝑥, 𝑦) /𝑁𝑢𝑚𝐼𝑚𝑎𝑔𝑒
where Mean, GrayImage, x, y, i, and NumImage indicate the mean image, grayscale image, x-coordinate of a block in an image, y-coordinate of a block in an image, image number, and total sample images of a JSL word. Fig. 3 shows the creation of a mean image. The created mean image expresses information
concerning the hand motion of a JSL word because the gray value of the hand motion information is thin.
Fig. 3. Mean image creation. 2.3. Gathered image generation
In gathered image generation, the difference values of the blocks in an image between the mean image and all images of a JSL word are calculated. Then, the winner blocks that have the maximum difference values are decided. The gathered image consists of the winner blocks, i.e., those that have the calculated maximum difference values. In Fig. 4, MeanImage, GrayImage, maximum, and max_num indicate the created mean image, the grayscale image, the maximum difference value between the created mean image, and the total number of grayscale images in each block, respectively.
Fig. 4. Listing of gathered image generation program.
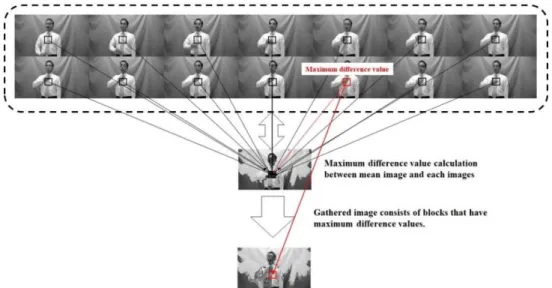
Fig. 5 shows the gathered image generation based on computing the maximum value of difference from the mean image. The generated gathered image highlights the hand motion information of a JSL word due to the embedding of the gray value of the block that has the maximum difference value from the created mean image.
Fig. 5. Gathered image generation based on computing the maximum value of difference from the mean image.
1 for n in range (0, block number)
2 maximum = | MeanImage[n] – GrayImage[n][0] | 3 for i in range (1, image number of a JSL word) 4 if | MeanImage[n] – GrayImage[n][i] | >= maximum 5 maximum = GrayImage[n][i]
6 max_num = i
2.4. Japanese sign language classification
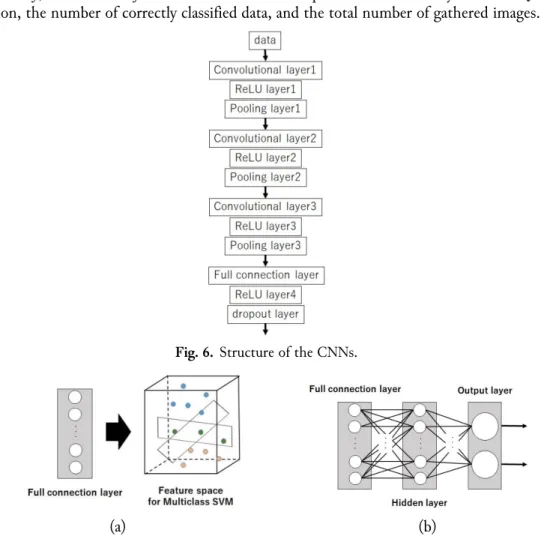
It is not easy to extract the features of the generated gathered image because the generated gathered image is complex. CNNs are therefore used for extracting the features of the generated gathered images. The convolutional layers have L × L filters. The information in the generated gathered image is compressed using the pooling layer. Then, a dropout function (dropout ratio: Q%) is applied to protect against overtraining. The CNN structure is shown in Fig. 6. Finally, the JSL words are classified using the MSVM and MLP classifiers, respectively. Fig. 7 shows the structure of the MSVM and MLP. The accuracy rate for classifying JSL words is expressed as follows.
𝐴𝑐𝑐𝑢𝑟𝑎𝑐𝑦 = 𝐶𝑜𝑟𝑟𝑒𝑐𝑡𝐶𝑙𝑎𝑠𝑠𝑖𝑓𝑖𝑐𝑎𝑡𝑖𝑜𝑛/𝑇𝑜𝑡𝑎𝑙𝑁𝑢𝑚
where Accuracy, CorrectClassification and TotalNum represent the accuracy rate for JSL word classification, the number of correctly classified data, and the total number of gathered images.
Fig. 6. Structure of the CNNs.
(a) (b)
Fig. 7. Classifiers for JSL classification: the structures of (a) a multi-class SVM (MSVM) and (b) a multilayer
perceptron (MLP).
3. Results and Discussion
We conducted experiments using actual JSL videos. The total number of subjects was 11 healthy persons (3 females and 8 males; mean age = 24.7 years). The number of JSL words was 20 related to greeting and enquiries using JSL during general communication in an information center and/or office. A total of 13,200 images were generated (the numbers of subjects, words and generated gathered images were 11, 20 and 60). The number of classes was 20 (20 JSL words). Some common phrases used by the participants were “excuse me,” “I see,” “I’m not sure,” “where,” “when,” “please,” and “thanks.” In JSL, “excuse me” consisted of “talk,” “not care,” and “could you.” “I see,” “I’m not sure (not sure),” “when,” “please,” and “thanks” were single word. “Where” is expressed using two words: “place” and “what.”
Additionally, some selected greetings consisted of “morning,” “afternoon,” or “night” with “greeting.” The place words used in this experiment were “athenaeum,” “hospital,” and “information,” (a single word). The selected verbs were “go,” “say,” and “hope,” (a single word). C/C++ codes were employed to implement the grayscale transformation, mean image creation, gathered image generation. MATLAB toolbox was used to extract the features using the CNNs and JSL classification using the MSVM and MLP. The gathered image consisted of 108 × 192 pixels. The size of blocks was 6 (N) and 6 (M), respectively. The size of filters of the first to third hidden layers were six, three and three, respectively. The total numbers of first to third convolutional layers were 64, 64 and 192, respectively. The pooling layer employed the max pooling algorithm. The number of units for the full-connection layer was 1,000. The dropout rate Q was 50. The hidden layer of the MLP had 1,000 units. Training data sets were selected 80% of the datasets randomly.
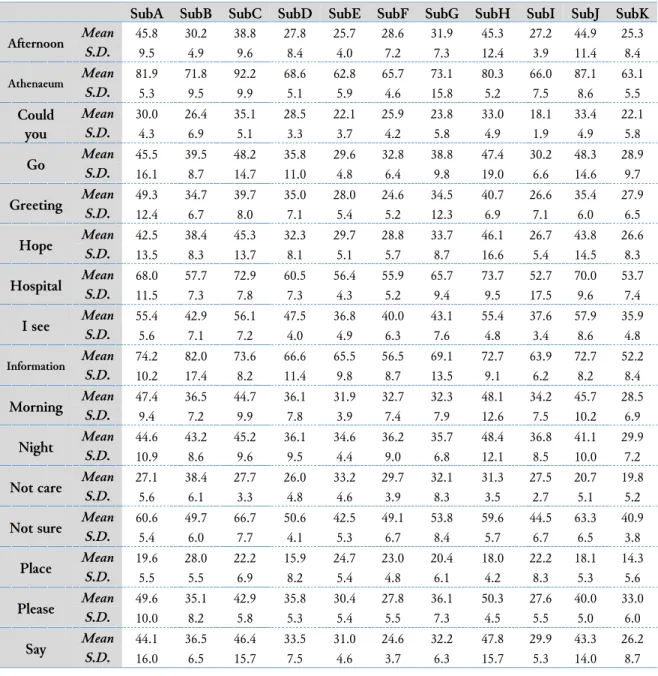
Table 1 shows the mean and standard deviation of the sample number of each Japanese sign for each subject. SubA to SubK in Table 1 represent subjects A to K, respectively. We confirmed that the mean numbers of the sample images were different for each JSL word, and for each subject and that the mean numbers of the sample images were considerably variable.
Table 1. Mean and standard deviation (S. D.) of the sample number of each Japanese Sign Language in the case
of each subject.
SubA SubB SubC SubD SubE SubF SubG SubH SubI SubJ SubK
Afternoon Mean 45.8 30.2 38.8 27.8 25.7 28.6 31.9 45.3 27.2 44.9 25.3 S.D. 9.5 4.9 9.6 8.4 4.0 7.2 7.3 12.4 3.9 11.4 8.4 Athenaeum Mean 81.9 71.8 92.2 68.6 62.8 65.7 73.1 80.3 66.0 87.1 63.1 S.D. 5.3 9.5 9.9 5.1 5.9 4.6 15.8 5.2 7.5 8.6 5.5 Could you Mean 30.0 26.4 35.1 28.5 22.1 25.9 23.8 33.0 18.1 33.4 22.1 S.D. 4.3 6.9 5.1 3.3 3.7 4.2 5.8 4.9 1.9 4.9 5.8 Go Mean 45.5 39.5 48.2 35.8 29.6 32.8 38.8 47.4 30.2 48.3 28.9 S.D. 16.1 8.7 14.7 11.0 4.8 6.4 9.8 19.0 6.6 14.6 9.7 Greeting Mean 49.3 34.7 39.7 35.0 28.0 24.6 34.5 40.7 26.6 35.4 27.9 S.D. 12.4 6.7 8.0 7.1 5.4 5.2 12.3 6.9 7.1 6.0 6.5 Hope Mean 42.5 38.4 45.3 32.3 29.7 28.8 33.7 46.1 26.7 43.8 26.6 S.D. 13.5 8.3 13.7 8.1 5.1 5.7 8.7 16.6 5.4 14.5 8.3 Hospital Mean 68.0 57.7 72.9 60.5 56.4 55.9 65.7 73.7 52.7 70.0 53.7 S.D. 11.5 7.3 7.8 7.3 4.3 5.2 9.4 9.5 17.5 9.6 7.4 I see Mean 55.4 42.9 56.1 47.5 36.8 40.0 43.1 55.4 37.6 57.9 35.9 S.D. 5.6 7.1 7.2 4.0 4.9 6.3 7.6 4.8 3.4 8.6 4.8 Information Mean 74.2 82.0 73.6 66.6 65.5 56.5 69.1 72.7 63.9 72.7 52.2 S.D. 10.2 17.4 8.2 11.4 9.8 8.7 13.5 9.1 6.2 8.2 8.4 Morning Mean 47.4 36.5 44.7 36.1 31.9 32.7 32.3 48.1 34.2 45.7 28.5 S.D. 9.4 7.2 9.9 7.8 3.9 7.4 7.9 12.6 7.5 10.2 6.9 Night Mean 44.6 43.2 45.2 36.1 34.6 36.2 35.7 48.4 36.8 41.1 29.9 S.D. 10.9 8.6 9.6 9.5 4.4 9.0 6.8 12.1 8.5 10.0 7.2
Not care Mean 27.1 38.4 27.7 26.0 33.2 29.7 32.1 31.3 27.5 20.7 19.8
S.D. 5.6 6.1 3.3 4.8 4.6 3.9 8.3 3.5 2.7 5.1 5.2
Not sure Mean 60.6 49.7 66.7 50.6 42.5 49.1 53.8 59.6 44.5 63.3 40.9
S.D. 5.4 6.0 7.7 4.1 5.3 6.7 8.4 5.7 6.7 6.5 3.8 Place Mean S.D. 19.6 28.0 22.2 15.9 24.7 23.0 20.4 18.0 22.2 18.1 14.3 5.5 5.5 6.9 8.2 5.4 4.8 6.1 4.2 8.3 5.3 5.6 Please Mean 49.6 35.1 42.9 35.8 30.4 27.8 36.1 50.3 27.6 40.0 33.0 S.D. 10.0 8.2 5.8 5.3 5.4 5.5 7.3 4.5 5.5 5.0 6.0 Say Mean 44.1 36.5 46.4 33.5 31.0 24.6 32.2 47.8 29.9 43.3 26.2 S.D. 16.0 6.5 15.7 7.5 4.6 3.7 6.3 15.7 5.3 14.0 8.7
SubA SubB SubC SubD SubE SubF SubG SubH SubI SubJ SubK Talk Mean S.D. 24.5 37.0 33.4 24.9 30.4 29.1 34.0 29.1 30.7 32.3 20.3 4.4 7.3 3.4 2.9 6.3 3.4 6.6 3.0 3.5 5.1 6.3 Thanks Mean 59.5 44.3 59.7 49.0 40.4 39.4 50.9 57.4 45.4 62.2 40.5 S.D. 6.2 12.1 8.8 7.6 5.3 5.2 5.8 5.6 5.9 7.7 6.0 What Mean 39.6 35.6 38.0 31.3 30.8 29.2 35.4 42.1 25.0 37.6 25.1 S.D. 12.4 4.7 5.4 8.1 7.5 7.2 8.9 11.0 5.0 9.4 5.8 When Mean 59.2 59.9 65.8 47.9 44.6 48.5 47.7 59.8 39.4 58.7 35.2 S.D. 5.6 11.4 6.7 4.3 6.1 6.8 8.1 6.4 7.4 6.9 2.8
The maximum and minimum means of the sample images were 92.9 for “athenaeum” in the case of subject C and 18.0 for “place” in the case of subject H. In addition, the maximum and minimum standard deviations of the sample images were 19.0 for “go” in the case of subject H and 1.9 for “could you” in the case of subject I. Table 2 shows the recognition accuracy (mean and standard deviation) for 20 JSL words classification.
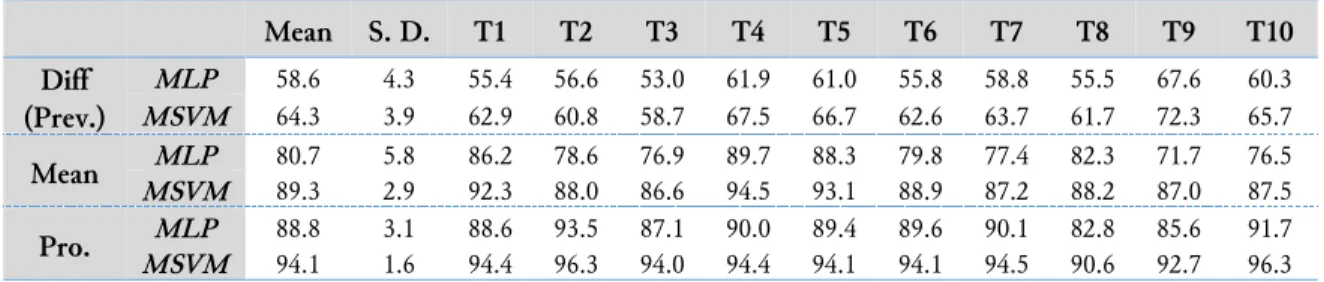
Table 2. Recognition accuracy for 20 JSL words (mean and standard deviation ) (%).
Mean S. D. T1 T2 T3 T4 T5 T6 T7 T8 T9 T10 Diff (Prev.) MLP 58.6 4.3 55.4 56.6 53.0 61.9 61.0 55.8 58.8 55.5 67.6 60.3 MSVM 64.3 3.9 62.9 60.8 58.7 67.5 66.7 62.6 63.7 61.7 72.3 65.7 Mean MLP 80.7 5.8 86.2 78.6 76.9 89.7 88.3 79.8 77.4 82.3 71.7 76.5 MSVM 89.3 2.9 92.3 88.0 86.6 94.5 93.1 88.9 87.2 88.2 87.0 87.5 Pro. MLP 88.8 3.1 88.6 93.5 87.1 90.0 89.4 89.6 90.1 82.8 85.6 91.7 MSVM 94.1 1.6 94.4 96.3 94.0 94.4 94.1 94.1 94.5 90.6 92.7 96.3
Diff (Prev.), Mean, and Pro. indicate the method of previous studies [29]–[31], the mean image creation method, and the method of embedding information of the block having the maximum value of difference between the mean image and the grayscale images for the gathered image creation, respectively. In the previous method, the difference values of all blocks between target image and the previous image, and next image, respectively. Information of target image and the block having the maximum value of difference. The information on each block having the maximum value was embedded in all blocks in an image (Fig. 8). This previous method has often been employed to analyze security footage with residual images that express human movements [29], to visualize sleep conditions (e.g., sound sleep and bad sleep) [30], and to classify 10 JSL words [31]. T indicates the trail number. We confirmed that the maximum mean of the recognition accuracy was 94.1% using the proposed method and the MSVM classifier and that the minimum standard deviation was 1.6%. The mean and the standard deviation of the recognition accuracy using the previous method were 64.3% and 3.9%, respectively, and the mean and standard deviation using mean image creation were 89.3% and 2.9%, respectively.
(a) (b)
Fig. 8. Example of general gathered image generation. The general outline for calculating (a) the maximum
Fig. 9 to Fig. 11 show the generated gathered images for each JSL word for each subject using the previous method, mean image creation, and the proposed method, respectively.
(a)
(b)
Fig. 9. Gathered image results for the general gathered image generation method (the previous method). The
created sample images for (a) each of the 20 JSL words for each subject and (b) a part of the created sample images (afternoon, athenaeum, could you, go, and greeting).
In the previous method, the maximum difference for each block was calculated. The information of each block having the maximum difference was embedded in an image to generate the gathered image. The gathered image expresses the most significant action in the hand motion of a JSL word because the gathered image comprises the block information that had maximum difference. “Place” in JSL is a downward motion from the top with the dominant hand open. The significant action of “place” is a downward motion with the dominant hand open. “Afternoon” in JSL is a motion in front of the face with the forefinger and middle finger of the dominant hand. The significant action of “afternoon” is in front of the face with the forefinger and middle finger up. “Greeting” in JSL is expressed by the action of bending the forefingers of both hands in front of one’s face. The significant action of “greeting” involves bending the forefingers of both hands in front of one’s face. “Could you” in JSL is expressed through a motion that shows the palm of the hand to the person one is conversing with from the state of showing the back of the dominant hand. The significant action for this sign is showing the palm of the dominant hand. “Go” in JSL is a motion where the forefinger of the dominant hand moves from the bottom to the front. The significant action for this sign is moving the forefinger of the dominant
hand forward. We confirmed this in Fig. 8 and Fig. 9(b). “Athenaeum” in JSL is a motion that opens the hands from the state of pressing the hands together and then forms a square with both hands. The significant actions of “athenaeum” are opening the hands and making a square. It was difficult to find the opening hands motion in the gathered image. The mean and standard deviation of the previous method were 65% or less and 3.5% or more, as shown in Table 2. These results suggest that the gathered information in the gathered image becomes insufficient when the JSL word includes complex hand motions, as in the case of “athenaeum,” and that the recognition accuracy is not high when using the previous method.
(a)
(b)
Fig. 10. Gathered image results using the mean image creation method. The created sample images for (a) each
of the 20 JSL words for each subject and (b) a part of the created sample images (afternoon, athenaeum, could you, go, and greeting).
In mean image creation, the gathered image expressed information of the hand motion of a JSL word even though the gray value of the hand motion information deteriorated. The hand motions of “afternoon,” “greeting,” “could you,” and “go” are shown in Fig. 10(b). A part of the hand motions of “athenaeum” is shown in Fig. 10(b). The gray value of the area related to the hand motion was too thin because the number of sample images was too high. We confirmed that the mean and standard deviations were 85% or more and 3% or less, respectively. From these results, it is difficult to extract features using CNNs when the number of sample images is too large and that it is easy to classify the JSL words when
the number of sample images is small because the created mean image has gathered enough hand motion information.
(a)
(b)
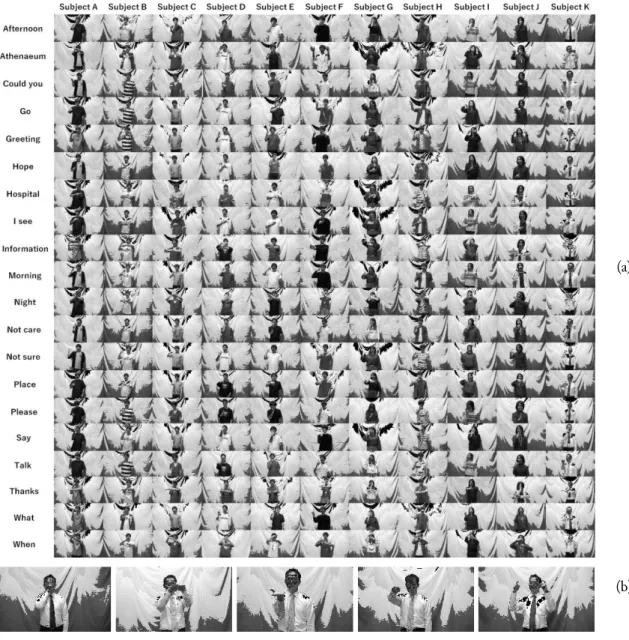
Fig. 11. Gathered image results obtained using the proposed method. The created sample images for (a) each
of the 20 JSL words for each subject and (b) a part of the created sample images (afternoon, athenaeum, could you, go, and greeting).
In the proposed method, the gathered image highlighted the hand motion information of the JSL word because the embedded gray value of the blocks contained the maximum difference value from the created mean image. The hand motions of “afternoon,” “athenaeum,” “greeting,” “could you,” and “go” are shown in Fig. 11(b). Here, the proposed method is compared to the mean image creation method.
Fig. 12 shows samples (“place”) of mean images and gathered images using the proposed method. Even though hand motion information can be found in the mean image, the gray values of the areas related to the hand motion were thin. We confirmed that the thin information was highlighted and that the mean and standard deviation were 94% or more and 1.8% or less, respectively (excellent results). These results suggest that it is easy to extract the features of JSL words and classify these words by highlighting the gray values of the areas related to the hand motion in the mean image. In addition, the proposed method had a beneficial effect on extracting the features related to the JSL words and classifying the JSL words. Then, the proposed method employed CNNs (Fig. 6) and the SVM (Fig. 7), obtaining
experimental results with high recognition accuracy. These results suggest that the combination of CNNs and the SVM effectively extracts features from complex images and classifies hand motions.
(a)
(b)
Fig. 12. Samples of mean and gathered images using the proposed method. Sample results for (a) the mean
image creation method and (b) the proposed method.
4. Conclusion
To solve the issues that language speed during the JSL word motions and length of word were different and that the size of input data for CNNs was specified, this paper employed the gathered image generation technique to make the gathered image to classify JSL words without dependence on language speed and length of word. It was not easy to extract the features to classify the JSL words because the generated gathered image was complex images. The CNNs were employed to features because the CNNs
could obtain the features from complex image. This paper proposed the novel approach to classify JSL words. The proposed method consisted of grayscale transformation, mean image creation, gathered image generation, and JSL word classification. In the grayscale transformation, input data were transformed via preprocessing. In the mean image creation, information related to the hand motions of JSL words was gathered. Information related to the hand motions of JSL words was highlighted in the gathered image generation. Then, the CNNs were employed for extracting features of the gathered images. Moreover, the MSVM and the MLP were employed for classifying the 20 JSL words.
In the experimental results, we confirmed that the thin information was highlighted and that the mean and standard deviation were 94% or more and 1.8% or less, respectively. The experimental results suggest that it is easy to extract the features of JSL words and classify these words by highlighting the gray values of the areas related to the hand motion in the mean image. In addition, the proposed method had a beneficial effect on extracting the features related to the JSL words and classifying the JSL words. Then, the proposed method employed CNNs and the MSVM, obtaining experimental results with high recognition accuracy. These results suggest that the combination of CNNs and the SVM effectively extracts features from complex images and classifies hand motions. However, the gathered image of the proposed method contains no time-series information of the hand motions. Therefore, we will create the novel gathered image considering the time-series information to improve the classification accuracy.
Acknowledgment
We are especially grateful to support from the Tateishi Science and Technology Foundation Grant for Research (A).
References
[1] K. M. Lim, A. W. C. Tan, and S. C. Tan, “Block-based histogram of optical flow for isolated sign language recognition,” J. Vis. Commun. Image Represent., vol. 40, pp. 538–545, Oct. 2016, doi: 10.1016/j.jvcir.2016.07.020.
[2] K. Li, Z. Zhou, and C.-H. Lee, “Sign Transition Modeling and a Scalable Solution to Continuous Sign Language Recognition for Real-World Applications,” ACM Trans. Access. Comput., vol. 8, no. 2, pp. 1–23, Jan. 2016, doi: 10.1145/2850421.
[3] R. Cui, H. Liu, and C. Zhang, “A Deep Neural Framework for Continuous Sign Language Recognition by Iterative Training,” IEEE Trans. Multimed., vol. 21, no. 7, pp. 1880–1891, Jul. 2019, doi: 10.1109/TMM.2018.2889563.
[4] A. Sutherland, G. Awad, and J. Han, “Boosted subunits: a framework for recognising sign language from videos,” IET Image Process., vol. 7, no. 1, pp. 70–80, Feb. 2013, doi: 10.1049/iet-ipr.2012.0273.
[5] M. Elpeltagy, M. Abdelwahab, M. E. Hussein, A. Shoukry, A. Shoala, and M. Galal, “Multi-modality-based Arabic sign language recognition,” IET Comput. Vis., vol. 12, no. 7, pp. 1031–1039, Oct. 2018, doi: 10.1049/iet-cvi.2017.0598.
[6] P. V. V. Kishore, D. A. Kumar, A. S. C. S. Sastry, and E. K. Kumar, “Motionlets Matching With Adaptive Kernels for 3-D Indian Sign Language Recognition,” IEEE Sens. J., vol. 18, no. 8, pp. 3327–3337, Apr. 2018, doi: 10.1109/JSEN.2018.2810449.
[7] X. Yang, X. Chen, X. Cao, S. Wei, and X. Zhang, “Chinese Sign Language Recognition Based on an Optimized Tree-Structure Framework,” IEEE J. Biomed. Heal. Informatics, vol. 21, no. 4, pp. 994–1004, Jul. 2017, doi: 10.1109/JBHI.2016.2560907.
[8] J. Jimenez, A. Martin, V. Uc, and A. Espinosa, “Mexican Sign Language Alphanumerical Gestures Recognition using 3D Haar-like Features,” IEEE Lat. Am. Trans., vol. 15, no. 10, pp. 2000–2005, Oct. 2017, doi: 10.1109/TLA.2017.8071247.
[9] M. Jebali, P. Dalle, and M. Jemni, “Extension of Hidden Markov Model for Recognizing Large Vocabulary of Sign Language,” Int. J. Artif. Intell. Appl., vol. 4, no. 2, pp. 35–44, Mar. 2013, doi: 10.5121/ijaia.2013.4203. [10] V. Ranga, N. Yadav, and P. Garg, “American Sign Language Fingerspelling Using Hybrid Discrete Wavelet Transform-Gabor Filter and Convolutional Neural Network,” J. Eng. Sci. Technol., vol. 13, no. 9, pp. 2655– 2669, 2018, available at : Google Scholar.
[11] Y. Zhou, G. Jiang, and Y. Lin, “A novel finger and hand pose estimation technique for real-time hand gesture recognition,” Pattern Recognit., vol. 49, pp. 102–114, Jan. 2016, doi: 10.1016/j.patcog.2015.07.014. [12] W. Tao, M. C. Leu, and Z. Yin, “American Sign Language alphabet recognition using Convolutional Neural
Networks with multiview augmentation and inference fusion,” Eng. Appl. Artif. Intell., vol. 76, pp. 202–213, Nov. 2018, doi: 10.1016/j.engappai.2018.09.006.
[13] O. Al-Jarrah and A. Halawani, “Recognition of gestures in Arabic sign language using neuro-fuzzy systems,”
Artif. Intell., vol. 133, no. 1–2, pp. 117–138, Dec. 2001, doi: 10.1016/S0004-3702(01)00141-2.
[14] K. Silanon, “Thai Finger-Spelling Recognition Using a Cascaded Classifier Based on Histogram of Orientation Gradient Features,” Comput. Intell. Neurosci., vol. 2017, pp. 1–11, 2017, doi: 10.1155/2017/9026375.
[15] S. Phitakwinai, S. Auephanwiriyakul, and N. Theera-Umpon, “Thai Sign Language Translation Using Fuzzy C-Means and Scale Invariant Feature Transform,” pp. 1107–1119, doi: 10.1007/978-3-540-69848-7_88. [16] T. Pariwat and P. Seresangtakul, “Thai finger-spelling sign language recognition using global and local
features with SVM,” in 2017 9th International Conference on Knowledge and Smart Technology (KST), 2017, pp. 116–120, doi: 10.1109/KST.2017.7886111.
[17] L. Pigou, S. Dieleman, P.-J. Kindermans, and B. Schrauwen, “Sign Language Recognition Using Convolutional Neural Networks,” 2015, pp. 572–578, doi: 10.1007/978-3-319-16178-5_40.
[18] P. Molchanov, S. Gupta, K. Kim, and J. Kautz, “Hand gesture recognition with 3D convolutional neural networks,” in 2015 IEEE Conference on Computer Vision and Pattern Recognition Workshops (CVPRW), 2015, pp. 1–7, doi: 10.1109/CVPRW.2015.7301342.
[19] N. Mukai, N. Harada, and Y. Chang, “Japanese Fingerspelling Recognition Based on Classification Tree and Machine Learning,” in 2017 Nicograph International (NicoInt), 2017, pp. 19–24, doi: 10.1109/NICOInt.2017.9.
[20] N. Takayama and H. Takahashi, “Sign Words Annotation Assistance Using Japanese Sign Language Words Recognition,” in 2018 International Conference on Cyberworlds (CW), 2018, pp. 221–228, doi: 10.1109/CW.2018.00048.
[21] G. A. Rao, K. Syamala, P. V. V. Kishore, and A. S. C. S. Sastry, “Deep convolutional neural networks for sign language recognition,” in 2018 Conference on Signal Processing And Communication Engineering Systems
(SPACES), 2018, pp. 194–197, doi: 10.1109/SPACES.2018.8316344.
[22] R. Yang, S. Sarkar, and B. Loeding, “Handling Movement Epenthesis and Hand Segmentation Ambiguities in Continuous Sign Language Recognition Using Nested Dynamic Programming,” IEEE Trans. Pattern
Anal. Mach. Intell., vol. 32, no. 3, pp. 462–477, Mar. 2010, doi: 10.1109/TPAMI.2009.26.
[23] C.-H. Wu, Y.-H. Chiu, and C.-S. Guo, “Text Generation From Taiwanese Sign Language Using a PST-Based Language Model for Augmentative Communication,” IEEE Trans. Neural Syst. Rehabil. Eng., vol. 12, no. 4, pp. 441–454, Dec. 2004, doi: 10.1109/TNSRE.2003.819930.
[24] C. Sun, T. Zhang, B.-K. Bao, C. Xu, and T. Mei, “Discriminative Exemplar Coding for Sign Language Recognition With Kinect,” IEEE Trans. Cybern., vol. 43, no. 5, pp. 1418–1428, Oct. 2013, doi: 10.1109/TCYB.2013.2265337.
[25] H.-D. Yang, S. Sclaroff, and S.-W. Lee, “Sign Language Spotting with a Threshold Model Based on Conditional Random Fields,” IEEE Trans. Pattern Anal. Mach. Intell., vol. 31, no. 7, pp. 1264–1277, Jul. 2009, doi: 10.1109/TPAMI.2008.172.
[26] M. Mohandes, M. Deriche, and J. Liu, “Image-Based and Sensor-Based Approaches to Arabic Sign Language Recognition,” IEEE Trans. Human-Machine Syst., vol. 44, no. 4, pp. 551–557, Aug. 2014, doi: 10.1109/THMS.2014.2318280.
[27] T.-H. S. Li, M.-C. Kao, and P.-H. Kuo, “Recognition System for Home-Service-Related Sign Language Using Entropy-Based K-Means Algorithm and ABC-Based HMM,” IEEE Trans. Syst. Man, Cybern. Syst., vol. 46, no. 1, pp. 150–162, Jan. 2016, doi: 10.1109/TSMC.2015.2435702.
[28] Yun Li, Xiang Chen, Xu Zhang, Kongqiao Wang, and Z. J. Wang, “A Sign-Component-Based Framework for Chinese Sign Language Recognition Using Accelerometer and sEMG Data,” IEEE Trans. Biomed. Eng., vol. 59, no. 10, pp. 2695–2704, Oct. 2012, doi: 10.1109/TBME.2012.2190734.
[29] W. Akutsu, T. Furuya, H. N. Miyamura, and T. Saito, “Hierarchical Image Gathering Technique for Browsing Surveillance Camera Images,” pp. 383–390, doi: 10.1007/978-3-540-73345-4_44.
[30] S. Ito, K. Orihashi, M. Ito, and M. Fukumi, “A Gathered Images Analysis Method to Evaluate Sound Sleep,” J. Inst. Ind. Appl. Eng., vol. 7, no. 1, pp. 16–24, Jan. 2019, doi: 10.12792/JIIAE.7.16.
[31] S. Ito, M. Ito, and M. Fukumi, “A Method of Classifying Japanese Sign Language using Gathered Image Generation and Convolutional Neural Networks,” in 2019 IEEE Intl Conf on Dependable, Autonomic and
Secure Computing, Intl Conf on Pervasive Intelligence and Computing, Intl Conf on Cloud and Big Data Computing, Intl Conf on Cyber Science and Technology Congress (DASC/PiCom/CBDCom/CyberSciTech),