INTRODUCTION
Advances in dialysis technology have contributed to an increased survival rate in chronic hemodialysis patients. Appropriate nutritional managements greatly contribute to extension of life expectancy by preventing complications and are becoming more important than ever(1-4). Energy management is one of the most im-portant among them. Energy deficiency leads to hyper-catabolism of protein, and requires an increase of
dialysis volume. Excess energy intake, on the other hand, leads to hypertriglyceridemia and accumulation of fat, which then cause cardiovascular complica-tions. In addition, water molecules in the excess food and production of water during metabolism may result in increased water retention. In spite of such importance of energy intake, the study on energy metabolism of maintenance hemodialysis patients has not been ex-tensively studied so far, may be because of the high cost of gas monitor.
Ikizler, et al.(5) recommended the importance of high-energy intake in maintenance hemodialysis pa-tients. They observed that resting energy expendi-ture (REE) of hemodialysis patients was higher than that of healthy individuals. They also showed that
ORIGINAL
Low resting energy expenditure in middle-aged and elderly
hemodialysis patients with poor nutritional status
Miho Kogirima
1, Katsuhiko Sakaguchi
2, Kohsuke Nishino
1, Yoko Ichikawa
3, Fumie Hiramatsu
3,
and Shigeru Yamamoto
31Department of Food Science and Nutrition, Doshisha Women’s College, Kyoto, Japan;2Kidney Center, Sumitomo Hospital, Osaka, Japan ; and3Department of Internal Public Health Nutrition, Institute of Health Biosciences, The University of Tokushima Graduate School, Tokushima, Japan
Abstract : Due to high resting energy expenditure (REE) in maintenance hemodialysis patients, an increase in energy intake is usually recommended to improve their nutritional status. However, some patients appear to have poor appetite and low energy intake. In such patients low energy metabo-lism is expected. We hypothesized that in maintenance hemodialysis patients there are two types of the energy metabolism, high and low. This study was aimed at finding the energy metabolism in maintenance hemodialysis patients, especially in those with poor nutritional status.
Subjects were hemodialysis out-patients (34 males and 20 females, mean age 59.1±10.7y) . REE
was measured by an indirect calorimeter. Protein intake was obtained from normalized protein catabolic rate (nPCR) , and physical activity level (PAL) was obtained by time study. Nutritional status assessed by serum albumin concentration was poor (3.7±0.2g/dL) in
spite of the adequate protein intake (1.1±0.3g/kg per day) . Only11% of the subjects had appropriate
serum albumin concentration. Mean REE was 24.6 kcal/kg per day which was lower than that of healthy Japanese (26.5kcal/kg per day) . REE and PAL positively correlated with serum albumin concentration (p<0.01) . The results suggest that maintenance hemodialysis patients with poor nutritional status may have low REE. J. Med. Invest. 53 : 34-41, February, 2006
Keywords : hemodialysis patient, resting energy expenditure, physical activity level, serum albumin, poor nutritional status
Received for publication August 1, 2005 ; accepted September 12, 2005.
Address correspondence and reprint requests to Shigeru Yamamoto, Department of Internal Public Health Nutrition, Institute of Health Biosciences, The University of Tokushima Graduate School Kuramoto-Cho Tokushima 770-8503, Japan and Fax:81-88-633-9427.
The Journal of Medical Investigation Vol. 53 2006
REE of the patients during hemodialysis treatment was higher than that during non-dialysis period. How-ever, from our experience, some patients seem to have poor appetite, low energy intake and poor nutri-tional status. In such patients low energy metabolism is expected and hence an increase of energy intake is not appropriate until their REE improves. In fact the subjects in the study of Ikizler, et al. (5) were young (mean age 38.3±13.0y) , had high body mass index (BMI:26.3±5.9)and relatively proper serum albumin level(4.08±0.32g/dL), indicating their nutritional status was not poor. These suggest that energy metabolism of the hemodialysis patients is not the same and may rather be different depending upon their nutritional status. This study was aimed at determining the energy metabolism in maintenance hemodialysis patients with poor nutritional status, so that proper quantity of energy can be recommended for the patients.
SUBJECTS AND METHOD
1. Subjects
The subjects consisted of 81 hemodialysis patients (52 males and 29 females of age range 40-79 y) who were being treated at satellite dialysis clinics, in Osaka, Japan. Seventy eight percent of the subjects were non-diabetic hemodialysis patients. Of all patients, the primary causes of admission included chronic glomerular nephritis (68%), diabetic nephropathy (22%), nephrosis (3%), renal sclerosis (3%) and pregnancy toxemia (4%). The patients underwent three4-h sessions of hemodialysis per wk using bicarbonate-buffered dialysate containing100mg glucose/dL and30mEq bicarbonate/L. Blood was collected for routine analysis before a hemodialysis session. Laboratory parameters were measured by Nichiyaku Medical Laboratories using an autoanalyzer. The Kt/V as a formula of hemo-dialysis volume(K:the urea clearance, t: hemohemo-dialysis time, V:the urea distribution volume)was calculated by the methods of Daugirdas (single-pool model)(6). Normalized protein catabolic rate (nPCR) was calculated by the methods of Shinzato, et al . (7) .
The Ethical Committee of The University of Tokushima approved this study. The subjects were provided with full explanation about the purpose and procedures of the study and informed consent was obtained form each patient.
2. Measurement of REE
REE was measured 2h after the last meal (8) before a mid-wk hemodialysis. The subjects refrained from
smoking and were trained how to breath through the mask. After resting for at least 15 min at room temperature (24 to 25!) (9) , REE was measured with Metavine (Vine, Tokyo, Japan) over 6min while the subject was in the sitting or supine position (8, 10, 11). The stable value for 3 min was defined as the REE. As described above, the study on energy metabolism has not been extensively explored so far, due to the high cost of the gas monitor. We used Metavine which measures only O2concentration. Energy expenditure
is calculated by using the fixed respiratory quotient (0.82) (8). It is much cheaper than those which measure both O2and CO2. Another advantage of this procedure is the
small size. Therefore if the monitor is good enough to neglect the inaccuracy and the limitation due to the measurement of only O2, it will be a strong support
for treatment of the patients. Results of this device indicated that large errors occur at low flow rates. Under normal conditions the error is less than 5% (10) . Even if the estimate was greater, the coefficient of variation was reported to be 10% or less (8) .
From the total of 81 subjects (52 males and 29 females) who were enrolled, REE data was generated for 54 hemodialysis patient (34 males and 20 females). Subjects with diabetic nephropathy or unstable REE were excluded.
3. PAL and dietary survey
Average physical activity level (PAL) of a day was estimated by the following equation. PAL=Σ(Af×T/ 1440). Where Af refers to activity factor for the indi-vidual activities (this expresses the ratio to basal metabolic rate), and T refers to time required for the individual activities (min). PAL of each activity was based on the activity factor for Japanese (12, 13). We defined basal metabolic rate (BMR)as 80% of REE(12). The nutrition survey was conducted by employing the 24h recalling method in 26 hemodialysis patients (19 males, 7 females) who agreed to participate. The information was collected from the patients themselves or a family member who prepared meals for the patient over 3 consecutive days excluding holidays.
4. Statistical analysis
Statistical analysis was performed using SPSS software (version 12.0 J, SPSS Inc., Chicago, IL, USA) for Windows and data were expressed as the mean±SD. All variables were tested for normality of distribution, and loga-rithmic conversion was performed if the distribution was not normal. Relationships between variables
were analyzed by calculating Pearson’s correlation coefficients. Principal component analysis was per-formed using parameters that displayed a significant correlation with REE so that factors could be extracted, and the components were scored. The promax method was used for rotation. In addition, using REE as the dependent variable and the scores for each component as independent variables, multiple regression analysis was performed by both forced entry and stepwise method. In all analyses, p<0.05 was considered significant.
RESULTS
1. Profile of the patients
Table 1 shows the mean values of age, duration of dialysis, height, body weight, body mass index (BMI), physical activity level (PAL) and clinical pa-rameters of the 81 patients. The durations of main-tenance hemodialysis for male and female were 7.1±6.9y and 10.4±6.7y(range:0.1-22.7y), respectively. Forty three point six percent and 34.6% of the patients
had maintenance hemodialysis for less than 5y and more than10y respectively. PAL lower than 1.3 was observed in 59.2% of males and 70.4% of females. As shown in Table 1, mean Kt/V was more than 1.3 and mean normalized protein catabolic rate (nPCR) was more than 1.2 g/kg per day in both male and female patients. These values (1.3 Kt/V and 1.2 nPCR) indicate low levels of mortality. Serum albumin level was 3.7±0.2 g/dL in males and 3.6±0.3g/dL in females. Subjects with appropriate serum albumin level (more than 4.0 g/dL) were only 9 (11.1%). The mean energy intake was 32.3 kcal/kg per day. The protein intake (1.14g/kg per day) was similar to the mean nPCR (1.2 g/kg per day) .
Table 2 shows the profile of the patients from whom REE were measured. REE was 1365±303 kcal per day (24.3±5.5kcal/kg per day) in the male patients and 1141±196kcal per day (25.0±4.7kcal/kg per day) in the females. PAL was 1.3±0.1 in both males and females. In addition, serum C-reactive protein (CRP), an energy metabolism related factor, was a little high in the patients. In 29.6% of the patients the level of CRP was more than 0.3mg/dL. The inflammation and infections-related factors, mean white blood cells (WBC), mean neutrophil and eosinophil counts as % of WBC were higher than standard value. Neutrophil Table 1. Characteristics of the patients
Variable Total(n=81) Male(n=52) Female(n=29)
Age, y 59.6±11.1 58.0±11.1 62.4±10.8 Duration of dialysis, y 8.3±7.0 7.1±6.9 10.4±6.7 Height, cm 159.8±8.4 163.9±5.8 152.3±7.1 Body weight (DW), kg 52.7±11.0 57.4±10.7 45.0±6.1 BMI 20.6±3.2 21.3±3.3 19.3±2.3 PAL 1.3±0.1 1.3±0.1 1.3±0.1 Kt/V 1.43±0.31 1.30±0.24 1.65±0.29 nPCR, g/kg per day 1.2±0.3 1.2±0.3 1.2±0.3 Serum albumin, g/dL 3.7±0.3 3.7±0.2 3.6±0.3
Serum total protein, g/dL 6.5±0.4 6.6±0.4 6.4±0.4 Serum creatinine, mg/dL 12.8±3.3 13.6±3.4 11.5±2.5
Hemoglobin, g/dL 10.5±1.0 10.5±1.1 10.4±0.9
Serum CRP, mg/dL 0.38±0.66 0.30±0.37 0.52±0.99
WBC, cells/mm3 6128±1587 6127±1512 6129±1742
Neutrophil (segmented cell), % 66.9±7.7 66.5±7.3 67.6±8.6
Eosinophil, % 4.0±3.6 4.3±3.6 3.5±3.7
Energy intake, kcal/da 1680±437 1720±479 1571±297
Energy intake/DW, kcal/kg per day 32.3±6.9 31.0±7.4 35.6±5.0 Protein intake, g/da 59.2±14.8 59.4±13.2 58.6±19.8
Protein intake/DW, g/kg per day 1.14±0.29 1.07±0.24 1.32±0.36 Data are expressed as the mean±SD. BMI, body mass index, dry weight, the weight measured immediately after patients underwent hemodialysis. PAL, physical activity level : Kt/V, standardized dialysis volume: nPCR, normalized protein catabolic rate, WBC : white blood cell, CRP : C-reactive protein.
Marked a ; data of 26 subjects (19 males and 7 females).
Table 2. Profile of the patients measured resting energy expendi-ture (REE)
Variable Total(n=54) Male(n=34) Female(n=20)
Age, y 59.1±10.7 57.8±11.2 61.3±9.5 Duration of dialysis, y 10.1±7.3 8.9±7.6 12.2±6.6 Height, cm 159.6±8.4 163.4±5.9 152.9±8.0 Body wt, kg (Dry wt) 53.0±10.3 57.1±10.1 46.1±6.0 BMI 20.7±3.0 21.3±3.3 19.6±2.2 REE, kcal/d 1282±288 1365±303 1141±196
REE/DW, kcal/kg per day 24.6±5.1 24.3±5.5 25.0±4.7
PAL 1.3±0.1 1.3±0.1 1.3±0.1
Kt/V 1.40±0.27 1.30±0.26 1.58±0.20
nPCR, g/kg per day 1.1±0.3 1.2±0.3 1.1±0.2
Serum albumin, g/dL 3.7±0.2 3.7±0.2 3.6±0.3
Serum total protein, g/dL 6.5±0.4 6.6±0.4 6.4±0.4 Serum creatinine, mg/dL 13.1±3.2 13.7±3.6 12.2±2.2
Serum CRP, mg/dL 0.46±0.78 0.34±0.43 0.66±1.15
WBC, cells/mm3 5990±1576 6035±1584 5913±1600
Neutrophil (segmented cell) % 65.7±7.7 65.6±7.3 65.8±8.7
Eosinophil, % 4.5±4.0 4.8±4.0 4.1±4.2
Data are expressed as the mean±SD. BMI, body mass index ; dry weight, the weight measured immediately after patients underwent hemodialysis. PAL, physical activity level : Kt/V, standardized dialysis volume : nPCR, normalized protein catabolic rate : WBC : white blood cell, CRP : C-reactive protein. M. Kogirima, et al. Low energy expenditure in hemodialysis patients
count was more than70% of WBC in 31.5% of the patients.
2. Comparison of basal metabolic rate (BMR) be-tween normal Japanese and patients.
The BMR of the patients was estimated by the following calculation.
BMR=0.8×REE
The percentages of BMR of patients against the BMR in healthy Japanese (12) were 76.4% for males and 81.4% for females (Table 3).
3. Factors related to REE
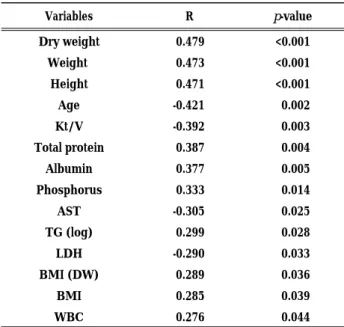
Forty three variables (age, duration of dialysis, height, body weight, dry weight, BMI, 35 laboratory test results, nPCR, and PAL) were used for analysis of simple correlations with REE. As shown in Table 4, 14 factors displayed a significant correlation with REE. This analysis revealed a positive correlation with factors such as the serum phosphorus level, body weight, height, serum total protein level, and serum albumin level. On the other hand, there was a negative correlation for factors such as age, the Kt/V, and AST level. Principal component analy-sis was then performed for factors except for age and for the values that were calculated by formula (Kt/V, BMI with dry weight, and BMI) , and this detected 3 components (Table 5) . The first component expressed “obesity,” while the second component was
“protein nutrition,” and the third component was “liver function.” Using the scores of these 3 components as independent variables, multiple regression analysis (forced entry method) was performed for more com-prehensive examination of the factors influencing REE (Fig. 1) . This analysis revealed that the standardized coefficient (β1) was the biggest for the second
com-ponent,“protein nutrition”. The multiple regression coefficient was 0.606 (R12= 0.367, p<0.001) and the
contri-bution rate was 32.8%. On the other hand, the first component, “obesity” (β2= 0.342) , and the second
com-ponent, “protein nutrition”(β2= 0.342), were selected
by stepwise analysis. In this analysis, the contribution rate was 30.2% (R22= 0.329, p<0.001) .
Fig 2 shows the relationship between serum albumin and REE of the patients. Serum albumin concentration and REE correlated significantly (p<0.01). From regression analysis, REE with serum albumin concentration of the reference standard (4.0g/dL) was 27kcal/kg per day. Fig 3 shows the relationship between serum albumin and PAL of all the patients. Serum albumin concen-tration and PAL correlated significantly (p<0.01) . From regression analysis, PAL with serum albumin con-centration of the reference standard (4.0g/dL) was 1.33.
DISCUSSION
The purpose of this study was to confirm our hy-pothesis that there are patients with low REE, yet high-energy intake is recommended to the hemo-dialysis patients most of whom had poor nutritional status (5,14) . In such patients an increase in energy intake, without increase of REE, is difficult.
Nutritional status of our study subjects was poor. Their mean BMI (20.6±3.2) was which was lower than that of Japanese average (23.4) reported in the Annual National Health and Nutrition Survey (15). Protein nutritional status assessed by serum albumin concentration was poor(3.7±0.3g/dL) in spite of the adequate protein intake (1.14g/kg per day) and mean nPCR (1.2g/kg per day). Only 11% of the subjects had normal serum albumin concentration (4.0g/ dL or more). The survey of the Japanese Society of Nephrology showed low survival rate for hemodialysis
Table3.Comparison of basal metabolism standard in Japanese and resting energy expenditure (REE) in patients aged 50-69 years
Patient(32) Basal metabolism standard in Japanese
variable Male (n=18) Female (n=14) Male Female
Age, y 59.8±6.4 59.9±6.3 50-69 50-69
Height, cm 162.3±4.6 152.4±7.2 163.9 151.4
Body weight, kg (Dry weight) 56.7±12.0 46.1±5.9 62.5 53.8
BMI 21.4±4.1 19.9±2.5 23.3 23.5
BMR, kcal/d 1032±250a 903±132a 1350 1110
REE, kcal/d 1291±312 1129±165 1688b 1388b
REE/DW, kcal/kg per day 23.3±5.7 24.7±4.3 27.0 25.8
Data are expressed as the mean or mean±SD. BMR, basal metabolic rate.
Letter of the right shoulder, a ; REE×0.8,b ; BMR/0.8.
patients with serum albumin level lower than 4.0g/dL (16). The mean REE (24.6kcal/kg per day) was lower than that of the normal Japanese (26.5kcal/kg per day). The patients of the present study were very different from the subjects of Ikizler et al (5) who had high REE. Nutritional status of them was much better than that of our subjects. They had higher BMI (26.3±5.9) and higher serum albumin level (4.08±0.32g/dL) than our subjects. This big contrast of nutritional status may support our findings. Another important difference was
the age of the patients. Our subjects were much older (mean age 59.1±10.7y)than those of Ikizler, et al.(mean age 38.3±13.0 y) (5) . By aging energy metabolism declines and this should be considered when energy intake is discussed.
It is well known that there is a strong positive relationship between the energy intake and protein utilization (17-19) . If the energy intake is poor, protein will be burned as the source of energy and finally leading to protein malnutrition. In this study we could observe similar results. The value of nPCR (1.2g/kg per day) in this study was not low compared with the protein intake recommended by the Nu-tritional guidelines of National Kidney Foundation Dialysis-Outcomes-Quality-Initiative (NKF-DOQI) (at least 1.2g/kg per day) (20) and the Japanese Society of Nephrology (1.0-1.2g/kg per day) (16) . These recom-mendations are higher than those for healthy popu-lations, being 0.8g/kg per day in United States (21) and 0.9g/kg per day in Japan (22) . Serum albumin has been reported to have a strong correlation with the morbidity and mortality of hemodialysis patients (3, 23-27). Our study indicated the correlation between REE and serum albumin. High energy may be required for the patients, however it may be possible only when their REE is improved.
This suggests that, the treatments of inflammation and infections may have to be done first. It is possible that due to the treatment, the appetite and energy intake will recover leading to recovery of protein nutrition. This is because mean of CRP, WBC, neutrophil and eosinophil counts were higher. Especially mean values of CRP and neutrophil (segmented cell) were higher in the patients than the standard value. These results indicate that many of our patients were in condition of chronic inflammation, although it is not an intense inflammation. For the treatment of inflam-mation and infections, the patients may need to take temporary supplement of high energy.
A decrease in fat-free mass may be considered as the other factor contributing for low REE in these patients. Ravussin, et al.(28) have reported that most of the differences in REE related to differ-ence in body size, gender, and age can be corrected by calculating the fat-free mass. In addition, Cun-ningham (29) reported that 65-90% of the variation in REE among adults can be explained by the fat-free mass. Therefore, the correlation between REE and body size among hemodialysis patients in our study may represent the relationship between REE and fat-free mass. There are reports that indicate the relationship between age-related decrease of lean Table5.Principal component analysis of items correlated with
resting energy expenditure (REE)
1 st 2 nd 3 rd TG (log) 0.892 -0.225 -0.193 Dry weight 0.802 0.063 0.224 Weight 0.797 0.066 0.230 Albumin -0.177 0.881 0.057 Total protein -0.048 0.854 -0.304 Height 0.425 0.645 -0.054 Phosphorus -0.174 0.542 0.500 AST 0.119 0.198 -0.961 WBC 0.154 -0.095 0.474 LDH -0.137 -0.079 -0.425
The Promax method incorporating Kaiser’s normalization was used for rotation and it was found that rotations converged after 5 repetitions. The hatched areas indicate the first to fourth components.
Table4. Relationship between resting energy expenditure (REE) and clinical parameters in the patients
Variables R p-value Dry weight 0.479 <0.001 Weight 0.473 <0.001 Height 0.471 <0.001 Age -0.421 0.002 Kt/V -0.392 0.003 Total protein 0.387 0.004 Albumin 0.377 0.005 Phosphorus 0.333 0.014 AST -0.305 0.025 TG (log) 0.299 0.028 LDH -0.290 0.033 BMI (DW) 0.289 0.036 BMI 0.285 0.039 WBC 0.276 0.044
BMI was calculated from the body weight measured immediately before patients underwent hemodialysis and BMI (DW) was calculated from dry weight ; P, serum phosphorus level ; AST, serum Aspartate aminotransferase ; LDH, serum lactate dehydroge-nase ; WBC, white blood cell ; TG (lg), serum triglyceride level after logarithmic conversion.
M. Kogirima, et al. Low energy expenditure in hemodialysis patients
body mass and decrease of BMR (30, 31) . Ishimura,
et al.(32) have studied the changes of body composition for up to 15 y after the initiation of hemodialysis. The patients of the study were 62.3±11.5y of age and their mean BMI was 21.5±3.3 which were similar to our subjects (59.1±10.7 y and BMI 20.7±3.0) .
Nutritional status of the patients improved until 3 y from the initiation of hemodialysis and then declined. They reported that fat-free mass was low in their patients. Low physical activity may be another factor of low fat-free mass in the patients. Of course the sickness itself decreases the activity, too. These indicate that both of them deteriorate and lead to a vicious circle. Low PAL (lower than 1.3) was observed in 59.2% of male and 70.4% of female subjects. These values are similar to 64% of institutionalized Japanese elderly female (n=113, 79.5±7.0 y)(13) .
REE of Japanese was estimated in 3833 healthy subjects by Metavine (12, 33) using the same gas monitor used in this study. REE of the healthy subjects vs. our hemodialysis patients aged 50-69y were 1807± 490 kcal per day (n=389) vs. 1291±312 kcal per day (n=18)(p<0.001) and70y< were1757±530 kcal per day (n=187) vs. 1287±196 kcal per day (n=6)(p<0.01) , respectively, in male subjects. In female, REE of the healthy subjects vs. our hemodialysis patients aged 50-69y were 1590±390 kcal per day (n=569) vs. 1129± 165 kcal per day (n=14)(p<0.001) and 70y< were 1331± 411 kcal per day (n=228) vs. 1034±222 kcal per day (n=4) (N.S.) , respectively. Except the female patients aged 70y or older, the subjects displayed significantly lower values compared with the healthy subjects (unpaired
t-test). REE per weight of healthy subjects aged 50-69y was 29.6 kcal/kg per day in male and 29.9 kcal/kg per day in female. These indicate REE of our hemo-dialysis patients was low (Table 3) .
The results of this study suggest that maintenance hemodialysis patients with poor nutritional status may have low REE. Serum albumin level of them need to be more than 4.0 g/dL. We think that energy intake of our patients need to be more than 29 kcal/kg per day based on the results (Fig. 2, 3), namely, REE (27kcal/kg per day)×0.8×PAL (1.33) with the proviso that 80% of REE is BMR (12). An increase in energy intake in such patients is difficult without improve-ment in both REE and appetite.
ACKNOWLEDGMENTS
We gratefully acknowledge Ryosuke Matsuwaka, M.D., Ph.D., Eiko Kohara, R.N., Mikami Clinic and the study participants for their cooperation and support. The present study was partly sponsored by the Japanese Ministry of Education, Culture, Sports, Science and Technology.
Figure 1. Multiple regression analysis.
Multiple regression analysis (forced entry method) with resting energy expenditure (REE) as the dependent variable and the scores for 3 components detected by principal component analysis as independent variables. β1,standardized coefficient by forced
entry ; multiple regression coefficients : 0.606.β2, standardized
coefficient by stepwise analysis ; multiple regression coeffi-cients : 0.573.
Figure 2. Relationship between REE and serum albumin con-centration.
The subjects were 54 patients who measured REE. p<0.01
Figure 3. Relationship between PAL and serum albumin con-centration
The subjects were 81 patients who determined PAL. p<0.01
REFERENCES
1. Mehrotra R, Kopple JD : Nutritional management of maintenance dialysis patients: Why aren’t we doing better? Annu. Rev. Nutr. 21:343-379, 2001 2. Riella MC : Malnutrition in dialysis : Malnourishment or uremic inflammatory response? Kidney Int 57 : 1211-1232, 2000
3. Qureshi AR, Alvestrand A, Danielsson A, Divino-Filho JC, Gutierrez A, Lindholm B, Bergström J: Factors predicting malnutrition in hemodialysis patients:A cross-sectional study. Kidney Int 53: 773-782, 1998
4. Ikizler TA, Wingard RL, Harvell J, Shyr Y, Hakim RM : Association of morbidity with markers of nutrition and inflammation in chronic hemodialysis patients: A prospective study. Kidney Int 55 : 1945-1951, 1999
5. Ikizler TA, Wingard RL, Sun M, Harvell J, Parker RA, Hakim RM : Increased energy expenditure in hemodialysis patients. J Am Soc Nephrol 7:2646-2653, 1996
6. Daugirdas JT:Second generation logarithmic es-timates of single-pool variable volume Kt/V:an analysis of error. J Am Soc Nephrol 4 : 1205-1213, 1993
7. Shinzato T, Nakai S, Fujita Y, Takai I, Morita H, Nakane K, Maeda K:Determination of Kt/V and Protein Catabolic Rate Using Pre-and Postdialysis Blood Urea Nitrogen Concentrations. Nephron 67 : 280-290, 1994
8. Igawa S, Sakamaki M, Miyazaki M : Examination of the reliability of the portable calorimeter. Cli Exp Pharmacol Physiol (Suppl 29) : S 13-S 15, 2002
9. Kashiwazaki H, Dejima Y, Suzuki T : Influence of upper and lower thermoneutral room temperatures. (20℃ and 25℃) on fasting and post-prandial resting metabolism under different outdoor temperatures. Eur J Clin Nutr 44 : 405-413, 1990 10. Tamura T, Ichinoseki N, Yoshimura T, Torii Y : Development and evaluation of a simple calorimeter for the measurement of resting metabolism. Clin Exp Pharmacol Physiol (Suppl 29):S2-S6, 2002
11. Kato M, Tajika M, Miwa Y, Moriwaki H : Validation of a portable indirect calorimeter (Metavine○R
) for measuring energy expenditure in an elderly population. Clin Exp Pharmacol Physiol (Suppl 29) : S 9-S 12, 2002
12. Kenko-Eiyo Joho Kenkyukai:Energy, In
Recom-mended Dietary Allowances for the Japanese, 6th
revision, 1999. pp 31-51 (in Japanese)
13. Ozeki T, Ebisawa H, Ichikawa M, Nagasawa N, Sato F and Fujita Y : Physical activities and energy expenditures of institutionalized Japanese elderly women. J Nutr Sci Vitaminol 46 : 188-192, 2000 14. Neyra R, Chen KY, Sun M Shyr Y, Hakim RM, Ikizler TA : Increased resting energy expenditure in patients with end-stage renal disease. J Parent Ent Nutr. 27 : 36-42, 2003 15. Kenko-Eiyo Joho Kenkyukai : The Annual National
Health and Nutrition Survey. Daiichi-Shuppan, Tokyo, 2004 (in Japanese)
16. The Japanese Society of Nephrology : Guidelines for life style and dietary therapy for kidney diseases. Jpn J Nephrol 39(in Japanese) : 1-37, 1997 17. Kishi K, Miyatani S, Inoue G : Requirement
and utilization of egg protein by Japanese young men with marginal intakes of energy. J Nutr 108 : 658-669, 1978
18. Bergstrom J : Nutrition and mortality in hemo-dialysis. J Am Soc Nephrol 6 : 1329-1341, 1995 19. Bergstrom J : Why are dialysis patients
mal-nourished? Am J Kidney Dis 26 : 229-241, 1995 20. National Kidney Foundation : KDQOI Clinical Practice Guidelines for Nutrition in Chronic Renal Failure. Am J Kidney Dis 35 : (Suppl 2) : S 17-S 104, 2000
21. Committee on Dietary Allowances : Dietary Reference Intakes for energy, carbohydrate, fiber, fat, fatty acids, cholesterol, protein, and amino acids. The National Academy of Sciences, Washington DC, 2002
22. Committee of Dietary Reference Intakes for the Japanese:Reports of Committee of Dietary Reference Intakes for the Japanese, 2004 (in Japanese)
23. Kaysen GA, Stevenson FT, Depner TA : Determinants of albumin concentration in hemodialysis patients. Am J Kidney Dis 29 : 658-668, 1997
24. Goldwasser P, Kaldas AI, Barth RH : Rise in serum albumin and creatinine in the first half year on hemodialysis. Kidney Int 56 : 2260-2268, 1999 25. Avram MM, Goldwasser P, Derkatz D, Gusik SA :
Correlates of long-term survival on hemodialysis. In : Friedman EA. Death on Hemodialysis, Dordrecht, The Netherlands, Kluwer. 1994, pp 169-176
26. Lowrie EG, Huang WH, Lew NL, Liu Y:The relative contribution of measured variables to death risk among hemodialysis patients. In: Friedman EA. Death on Hemodialysis. Dordrecht, The Netherlands,
M. Kogirima, et al. Low energy expenditure in hemodialysis patients
Kluwer. 1994, pp 121-141
27. Locatelli F, Mastrangelo F, Redaelli B, Ronco C, Marcelli D, Greca GL, Orlandini G, the Italian Cooperative Dialysis Study Group : Effects of different membranes and dialysis technologies on patient treatment tolerance and nutritional parameters. Kidney Int 50 : 1293-1302, 1996 28. Ravussin E, Lillioja S, Anderson TE, Christin
L, Bogardus C : Determinants of 24-hour energy expenditure in man:methods and results using a respiratory chamber. J Clin Invest 78 : 1568-1578, 1986
29. Cunningham J J : Body composition as a determinant of energy expenditure: a synthetic review and a proposed general prediction equation. Am J Clin Nutr 54 : 963-969, 1991
30. Tzankoff SP, Norris AH : Effect of muscle mass decrease on age-related BMR changes. J Appl Physiol 43 : 1001-1006, 1977
31. Keys A, Taylor HL, Grande F : Basal metabolism and age of adult man. Metabolism 22 : 579-587, 1973
32. Ishimura E, Okuno S, Marukawa T Katoh Y, Hiranaka T. Yamakawa T, Morii H, Kim M, Matsumoto N, Shoji T, Inaba M, Nakatani T, Nishizawa Y : Body fat mass in hemodialysis patients. Am J Kidney Dis 41 (Suppl 1):S137-S 141, 2003
33. Hosoya N, Mitsuhashi F, Sugiyama M : Resting energy expenditure among Japanese. Clin Exp Pharmacol Physiol (Suppl 29) : S16-S18, 2002