DOCTORAL DISSERTATION
A STUDY ON THE COMPLEXITY OF
URBAN STRUCTURE IN
PRE-INDUSTRIAL EAST ASIAN CITIES
September 2020
Zhao Haosu
Graduate School of Environmental Engineering
Dewancker Bart Lab
I
ACKNOWLEDGEMENTS
I would like to thank my supervisors Prof. Dr. Bart Dewancker, and Prof. Dr. Weijun Gao and Prof. Dr. Fukuda Hiroatsu for the scientific and organizational support. Furthermore, I would like to thank the other staff at the Environmental Engineering Faculty of the Kitakyushu University for fruitful discussions and valuable suggestions. My particular thanks go to my college mates Fanyue Qian, Dan Yu, Yuang Guo, Weiping Cao, Gang Cui and Xuan Ma, with whom I spent a great time inside and outside the laboratory.
This study would not have been possible without the Bart laboratory members who supported me during the extensive historical and literature survey work phases. Thanks to all of you! I would also like to thank to all people I got the chance of working and studying with in local, regional bodies, research institutions, and other organizations in Kitakyushu city.
I am very grateful to my family who always supported me and granted me the freedom to follow my personal interests. I also want to thank my tutors and friends, especially Xiaosheng Zhao, for their moral and scientific support throughout my studies. Without them, the last years would have been much harder.
Most importantly, I thank my great mother Li Qiong Shi, who always believed in me and supported me in every possible way. By sharing the joys and sorrows of the last years, she has contributed so much to eventually finishing this project. Thank you so much!
II
ABSTRACT
As biology inspired of space-organism,cities in continues land expansion and growth size metabolic, is also considered with a similar mechanism for its own internal-structures interactive. This localized environmental various brought about by the overall development outcome that affect every residential property living in it, especially in areas with a high concentration of urban agglomeration in East Asia, which the ultra-large-scale urban environment basically replaces the original surface natural environment and becomes the dominant environment for human life. However, while facing the size of a huge and highly centralized city, it is difficult to fully understand the heterogeneous and complex urban texture of the urban structure and environment of the local area.
Therefore, the propose of this study intend to make a step forward the understanding of cities with their spatiotemporal dynamics and central-peripheral effects as the organism metabolism for the model-based built environment and socio-economic activities matching. Which specially focus the self-organized formation process in pre-industrial East Asia cities with historical form patterns as empirical evidence. And configuring the correlation between human action manifolded land consumption probability and statistical urban patterns quantity of non-fossil energy drives human settlement state. Additionally, the author purposed a simple mechanism to reproduce the cities expansion and growth of its organism evolves from historical order of relatively equilibrium to contemporary disorder of system complexity.
The research approach for an universal urban patterns modelling method is divided into two stages, accordingly, the pre-industrial city formation process simulates with East Asian cities model of their intact city boundaries and structure laws as the primitive urban dynamics, the contemporary urban aggregation delineation with the system complex and boundary discreteness.
III
TABLE OF CONTENTS
ACKNOWLEDGEMENTS ... I ABSTRACT ... II TABLE OF CONTENTS ... III LIST OF FIGURES ... VII LIST OF TABLES ... XII CHAPTER 1:BACKGROUND AND PURPOSE ... 1
1.1 Introduction ... 1-1 1.2 Research Background ... 1-3 1.2.1Global population and urbanizations ... 1-3 1.2.2 Cities of physical size growth ... 1-8 1.2.3 Morphology and urban structure ... 1-11 1.2.4 City size and urban dynamics affect ... 1-12 1.3 Overview of pre-industrial urban structure in earlier Eastern Asia cities ... 1-14 1.4 Purpose of the study ... 1-16 CHAPTER 2: MOTIVATION AND METHODOLOGY ... 2-1 2.1 Bridging the gap between population agglomeration and urban built-up environment 2-1 2.1.1 Introduction of the disregarding of cities with locational quantifying ... 2-1 2.1.2 Population distribution approximate by the urban system ... 2-2 2.1.3 Morphology observation of intra-urban variations ... 2-6 2.2 Locational responsive of urban modelling method ... 2-11 2.2.1 Long line literature from urban geography and economic... 2-11 2.2.2 Fractal underlying of urban cluster integration ... 2-13 Reference... 2-23 CHPATER 3: THEORETICAL MODEL ANALYSIS OF FRACTAL CITY PATTERN ... 3-1
IV
3.1 Urban formation with growing fractal process depicts ... 3-1 3.1.1 Introduction of city forms evolution ... 3-1 3.1.2 Urban agglomeration production ... 3-2 3.1.3 Comparative analysis between classical model and fractal model ... 3-4 3.2 The impact on physical environment for urban organized with fractal model ... 3-7 3.2.1 Background of urban environment with complex morphology configuration ... 3-8 3.2.2 Evaluating approach and software application ... 3-12 3.2.3 Result and finding ... 3-14 3.3 Merit of city growth pattern in fractal delineation ... 3-20 Reference... 3-23 CHAPTER 4: FRACTAL ANALYSIS ON WELL-BEHAVED HISTORICAL CITY ORGANISM ... 4-1
4.1 Urban growth model of city from pre-industrial era, Eastern Asia... 4-1 4.1.1 Historical context of walled cities ... 4-1 4.1.2 Data acquisition and processing... 4-4 4.2 Evaluation model and process framework ... 4-9 4.2.1 Allometry of the city from its Ordinary Least Squares ... 4-10 4.2.2 Two main aspect of historical urban system ... 4-15 4.2.3 Analysis result and finding ... 4-27 4.3 Urban historical organization in fractal delineation ... 4-30 Appendix ... 4-33 Reference... 4-40 CHAPTER 5: HISTORICAL CITIES` VARIABLES WITH HUMAN BODY SIZE ADAPTS ... 5-1
5.1 Introduction of the historical city size as human settlement state ... 5-1 5.1.1 Urban geography approach of city (population) size distributes ... 5-1
V
5.1.2 Human settlement state of pre-industrial Eastern Asia cities ... 5-4 5.1.3 Historical city size and body measurement ... 5-5 5.2 Agglomeration entity, density probability with human dimensions as intermediate ... 5-11 5.2.1 Material fabric of historical settlement state with different dimensions scales ... 5-11 5.2.2 Assessing city size distribution with human dimension ... 5-15 5.3 Evaluation organizational interactivities of cities in human dimensions responsive .... 5-18 5.3.1 The probability density in each wall enclosed spatial property ... 5-18 5.3.2 Distribution regularity of city sizes ... 5-21 5.3.3 Human movement ability for historical city size varies ... 5-28 5.4 Summary and discussing ... 5-30 Appendix ... 5-32 Reference... 5-35 CHAPTER 6: INNOVATION AND APPLICATION ON NATURAL CITY OF SIMPLE
MODELLING ... 6-1
6.1 Cities with localized features as dynamic responsive ... 6-1 6.2 Research question ... 6-2 6.3 Human dimension basis receptive and intermediate ... 6-5 6.3.1 part 1: Human agent-based complex adapts ... 6-6 6.3.2 part 2: Watershed transform for urban intensity segmentation ... 6-11 6.4 Case study in Chiba city ... 6-16 6.4.1 Data process ... 6-18 6.4.2 Modelling the formation compactness of urban built environment ... 6-19 6.5 Application on urban compactness prediction ... 6-26 Reference... 6-30 CHAPTER 7: CONCLUSION AND OUTLOOK ... 7-1
VI
7.1 Conclusion ... 7-1 7.1.1 Cities as a fractal iteration model ... 7-1 7.1.2 Historical urban organism on fractal modelling ... 7-2 7.1.3 Indicator of cities sampling from historical equilibrium ... 7-2 7.1.4 Application applicability for out-of-equilibrium modelling ... 7-3 7.2 Outlook... 7-4
VII
LIST OF FIGURES
Figure 1-1. Different data sources over the same city`s (Beijing as example) delineation. .. 1-3 Figure 1-2. Agglomeration growth rate of world cities size with more than 300,000 inhabitants ... 1-4 Figure 1-3. World`s population by size class of settlement, 1990-2030 ... 1-5 Figure 1-4. Trends and projections in urban population as a percentage of total population by world region 1950–2030 ... 1-5 Figure 1-5. Proportion of East Asian megacities among the top 41 of global in 2030 projection (left) and Percentage of Top 10 of the world`s biggest urban agglomeration (right) ... 1-6 Figure 1-6. Urban and rural population of the world, 1950–2050 ... 1-7 Figure 1-7. International criteria exist for the boundary definition of a city ... 1-8 Figure 1-8 Classical models of urban morphology ... 1-11 Figure 1-9 Central radius effect in different urban function of structure formation... 1-12 Figure 1-10 The distribution regularity of city size and rank in the United States from 1790– 1940. (sources: Allen, 1997:30) ... 1-13 Figure 1-11 Research object and delineation problem of urban agglomeration ... 1-17 Figure 1-12 Pattern formation of purposed universal urban function in cities of size delineate ... 1-17 Figure 1-13 Research flow chart of the thesis ... 1-20 Fig.2-1. Arrange and change of temple`s distribution in Yahata eastern area ... 2-4 Fig.2-2. The effect of 100m contour and surface runoff ... 2-5 Figure 2-3. The relationship about the geolocation of temples with respect of altitude and the distance to the 100m contour ... 2-7 Figure 2-4. The distribution of Fitting curve 1920 and 2015 ... 2-8 Figure 2-5. Morphology approach of city with organism growth and its endogenous, Yahata eastern area, Kitakyushu city. ... 2-10 Figure 6. Illustration of how fractal dimensionality is measured from a 2D urban surface. 2-16
VIII
Figure 2-7. A pattern of DLA generated by the software of Fractal Master. ... 2-17 Figure 2-8. Illustration of network distribute in organism boundary of self-similarity ... 2-20 Figure 2-9. Model of road network and its average distribution radius ... 2-21 Fig.3-1. Information agency processing in Euclidean boundary dimension condition with grid cells increasing ... 3-5 Fig.3-2. The fractal abundance adapts on locational resolution variation of cluster integration consistent from urban fabric agglomeration ... 3-6 Fig.3-3. Comparing between the classical Euclidean space coordinate system and the fractal abundance adaptiveness space resolution system for the common phase space delineation 3-6 Figure 3-4. System complexity on social or nature organization and its environmental interventions ... 3-9 Figure 3-5-1. The generation step of growing regularity of fractals in self-affine situation (a): the pattern changing on obstacle property and passage ratio ... 3-10 Figure 3-5-2. The generation steps of growing regularity of fractals in self-affine situation (b): the combination iteration reveals in a self-organized system. ... 3-10 Figure 3-6. Obstruction in real urban system aligns with structure equilibrium, organized by underlying mechanism, and create different morphological street canyon scales for airflow percolate. ... 3-12 Figure 3-7. The scaling property and spatial relationship of urban ABL in local place condition ... 3-13 Figure 3-8. the framework of technical route of urban ABL in local place condition... 3-14 Figure 3-9-1. Choice of connectivity ... 3-15 Figure 3-9-2. Mean integration degrees (Integration R105000) ... 3-15 Figure 3-10. Spatial distribution rank for each connection ... 3-16 Figure 3-11. Settle the flow receptors ... 3-17 Figure 3-12. The airflow condition occurs in perpendicular income situations ... 3-18 Figure 3-13. The airflow condition occurs in oblique income situations ... 3-18 Figure 3-14. Wind perception with different airflow incoming orientation, perpendicular (left)
IX
oblique (right). ... 3-19 Figure 3-15. Comparison of spatial structure between (a) conventional coordinate system and (b) fractal dimensional measurement. ... 3-21 Figure 4-1. Walled spatial significant for urban in homothetic territorial features demarcate of its relational global force imprints in macro-levels. ... 4-3 Figure 4-2. Wall concentric distribution pattern in different historical place with current location or city names, Eastern Asia ... 4-5 Figure 4-3. Historical information for walled cities replacement with chronological progress. ... 4-6 Figure 4-4. Regular spatial emergence steps on growth property subdivisions and with its spontaneous driving force diffuse. ... 4-12 Figure 4-5. The framework of historical urban growth state delineation. ... 4-16 Figure 4-6. The area-perimeter scaling relations between wall enclosed areas and boundary perimeters of each wall enclosure features with different compound clusters. ... 4-17 Figure 4-7. Scaling capacity (probability) of the quasi-allometry property in different wall embedded urban enclosure of its staged emerge ... 4-24 Figure 4-8. Double logarithm relation between Least square fitting and agglomerate distribution embedding of wall-enclose boundary limit. ... 4-26 Figure 5-1-1. Illustration of complementary cumulative distribution for city (agglomerated) size adaption of functional delineation... 5-3 Figure 5-1-2. Size influence on density probability within same information resolution as distribution detection. ... 5-4 Figure 5-2. City with introverted wall clustering of Beijing in middle 20th century. (source: Hedda, 1986) ... 5-5 Figure 5-3. Step as the length of body measures in grid system of building modulus ... 5-11 Figure 5-4. Complimentary and explanatory of the background of body embedded measurement system and with correlated conversion and iteration in historical Eastern Asia countries. ... 5-13 Figure 5-5. The lognormal probability density distribution function with rank size discriminate from 5 wall enclosed spatial property and as generate threshold of each organization proportion
X
in 9 historical cities ... 5-16 Figure 5-6 The constant exponential increase of ‘bu’ steps of human activity quantity in different distribution condition of hierarchy ranked spatial living pattern at 5 wall enclosures cities. ... 5-25 Figure 5-7. The localized varying regularity of distribution exponent τ(q) from different city ranks and with respective spatial property of human individual movement of its activity. 5-27 Figure 5-8. The schematic diagram of the analytical process of city size evolution in based of the human dimensional agent mediating ... 5-29 Figure. 6-1. Conceptual scheme illustrating the research hypothesis testing ... 6-3 Figure 6-2. Reference from “Dimensions of the Human Figure” (detail), Architectural Graphic Standards, 6th ed. (1970). (John Wiley and Sons.) ... 6-5 Figure 6-3. Comparison of the aggregation phenomenon between census data of administrative management boundary and urban building blocks distribute of geo databases ... 6-6 Figure. 6-4. Interpretation of an immersion scenario on the landscape where water spillover from building geodesic occupies would merge at SKIZs, dams are constructed to segment the land scape surface. ... 6-15 Figure 6-5. Illustration of the defined research area in remote sensing images, Chiba city. 6-17 Figure 6-6. Material artifact patterns arrangement of urban fabric constitute and with their density and interactions in watershed segmentations ... 6-21 Figure. 6-7. Spatial property between different city structures complex probabilities with homothetic scaling conduct. ... 6-22 Figure. 6-8. Diagram of main components and data flow of the urban organizational compactness patterns formation. ... 6-25 Figure 6-9. HBO clusters aggregate of urban organizational compactness formation model with human dimensional scaling responsive (HDSR) mechanism as an independence variable and measure of urban built environment endogenous as the dependent variable for all 3669 estimations. ... 6-27 Figure 6-10. A scatter plot showing the relationship between HBO`s scaling rate as a predictor (idealized sprawling) and urban population aggregation (UPA) as the outcome variable (entropy degree) with the fitted regression line. ... 6-28
XI
Figure. 6-11. Urban population aggregation outcome (endogeneity) mapped onto the urban built environment and interpolated via Universal Kriging on raster grid and the inverse distance weighting via Three-dimensional thermodynamic diagram. ... 6-29
XII
LIST OF TABLES
Table 1-1 Dimension of the urbanization or urban dynamic process ... 1-2 Table 1-2 Form of urban expansion ... 1-10 Table 2-1. Comparation between cities and organism system... 2-22 Table 3-1. Spatial parameter correlation on schema iteration. ... 3-20 Table 4-1. Dimension and socioeconomic hierarchy of Sinology wall enclosures urban profiles, in a macrostructural to microstructural process of Sinology significant scaling framework domains. ... 4-4 Table 4-2. Wall enclosed city areas and perimeters with respect to difference clustering representative of a ubiquitous growth trajectory (political domains) in 21 Sinology historic cities, Eastern Asia. ... 4-7 Table 4-3. The global fractal parameters of wall enclosure model in different growth state of potential trajectory in homothetic cross-sections. ... 4-18 Table 4-4. Empirical and theoretical result of fractal parameters in different walled allometric stages. ... 4-18 Table 4-5. Scaling capacity (potentiality) from core to edge in respective of each wall embedded urban enclosures for structure diffusion cross-section. ... 4-21 Table 4-6. The global average constancy of the allometric scaling in each wall limited growth stages. ... 4-22 Table 4-7. Dimensional pattern changing on quasi-allometric scaling of fractal spectrums consistency ... 4-28 Table 4-8. Iteration schema for the wall enclosed urban form extrusion and its correlated typologies and scaling. ... 4-29 Table 4-9. Zoning type dependence form iteration with existing walled city ranks evolution. ... 4-30 Table 5-1 Comparison of body measurement system between ancient Chinese (Kaogongji, Rites of Zhou, Book of Diverse Crafts*) system and English (imperial) system ... 5-7 Table. 5-2 Changes in units of measure over dynasties ... 5-10 Table 5-3. The wall enclosed area and the perimeter length of each city rank in 9 historical
XIII
Eastern Asia cities. ... 5-14 Table 5-4. Empirical complementary cumulative distribution of city sizes in different unfolding processes and with 5 introverted spatial living patterns carriers as human activity capacity in respective spatial living patterns restrict of its consistent step movement. ... 5-19 Table 5-5. The distribution exponent of ‘bu’ steps unit in different walled spatial property embedded city ranks. ... 5-26
Chapter 1
CHAPTER ONE: BACKGROUND AND PURPOSE
1.1 INTRODUCTION ... 1-1 1.2 RESEARCH BACKGROUND ... 1-3 1.2.1 GLOBAL POPULATION AND URBANIZATIONS ... 1-3 1.2.2 CITIES OF PHYSICAL SIZE GROWTH ... 1-8 1.2.3 MORPHOLOGY AND URBAN STRUCTURE ... 1-11 1.2.4 CITY SIZE AND URBAN DYNAMICS AFFECT ... 1-12 1.3 OVERVIEW OF PRE-INDUSTRIAL URBAN STRUCTURE IN EARLIER EASTERN ASIA CITIES ... 1-14 1.4 PURPOSE OF THE STUDY ... 1-16 REFERENCE ... 1-21
-1-1- 1.1 Introduction
In this day and age, an estimated 54.5 percent of the world’s population lives in cities, and this proportion continues to grow. By 2030, urban areas are projected to house 60 per cent of people globally and one in every three people will live in cities with at least half a million inhabitants, and by 2050, this proportion will increase to 7 out of 10 as some 2 billion people move to cities (United Nations Human Settlements Program, 2016; World Health Organization, 2010). The cities are as concentrate the human activities as spatial extents; it has been in long time discussed in terms of natural and land-use component and with result from numerous processes that spatially and temporally. Highly integrated cities also concentrate the consumption of energy resources, the allocation of information and capital and the infrastructures support of social-economic and human individual needs as the anthropogenic effect upon the ecological environment. An interdisciplinary science that linkages the locational human activities and whole cities with fractal indices is highlighted in recent years as an advance biology analogues approach for these urban organization delineations. Meanwhile, by capturing the morphology fabrics and forms of urban physical features, the degrees on how much environmental or socio-economic practices have affected both the size and structures of cities can be evaluated. In other words, how much the locations have modified the original aspect of urban concentrations.
This phenomenon leads to growing urban areas across the globe and consequent loss of (semi-)natural areas and biodiversity around cities, to benefit of artificial land uses (Seto et al., 2012). The rapid urbanization and accelerating socio-economic development have generated global problems from climate change to incipient crises in food, energy and water availability, public healthy as well as the global economy. In this circumstance, the surface and density of cities are undoubtedly two key factors in understanding their socio-economic, environmental and health effects. It required the urban structure an understandable evolution mechanism of its organizational delineation and clusters aggregation. And the simplest urban modelling method then are pursued that can contain the complex and interactive evolution parameters as much as possible. Concerning this issue, the research field focusses on quantifying both the environmental and socio-economic outcomes of city`s locational sizes is getting more activities than before. In other words, the mixed area where urban concentration and natural landscape or/and resources compete is excepted to affordance the very large patches of cities` defining and measuring (density, continuity, concentration, clustering, centrality, nuclearity, proximity, etc.) with indices from various macro variables to locational individual modes.
With widely discuss and characterize of urban areas across many different cities size, the standard metrics which, however, consisting the urban landscapes of a highly fragmented mosaic of different land features and a manifolded network system of infrastructures support, but very few take into
-1-2-
account the relative location of the material artifact of urban fabrics constitute, provide a somewhat arbitrarily boundaries definition of a particular city. Inspired by the bottom-up process on the basis of geographical features as maximally clusters of cities (populated) sites identified, there are growing interest in resolving of ambiguity of cities delineation and the incongruous comparison arise by different standards. It takes a step forward the conventional ‘manual’ city size data collection and systematically refine the cities in a much more natural and unified way of temporary urban stable composites.
With more people leading urban lives and the number and size of cities expanding everywhere, it is increasingly important to know more quantitatively the way a city organizes itself. Thus, the major of this research are mainly focus on three aspects: (i) Identifying universal patterns in cities for furthering our understanding of urban dynamics, and help to manage contemporary global challenges of hyper-urbanization. (ii) Defining complex and diverse landscapes of cities with corresponds macro variables change, especially from the historical comparison of cities at embryonic stable. (iii) Improving the accuracy of urban models as maximally aggregated clusters as physical built environment composite.
Defining cities is complex and challenging as areas regarded as being urban differ widely in their morphology and character on a global scale as well as within countries and regions. Urbanization (or urban dynamic) is not just a description of the current situation, it rather has to be understood as “a collective term for a set of changes which generally occur within the appearance and expansion of large-scale coordinated activities in a society” (Tilly 1964: 16). Several interdependent dimensions of these changes were identified (see Table 1-1). In some cases, distances between built-up areas and the number of dwellings are an additional factor for the identification of urban areas. More elaborated definitions exist that make categorization more appropriate, yet more complex.
Table 1-1 Dimension of the urbanization or urban dynamic process
Dimension independent Manifestation
Political administrative Policies; Boundary adjustment
Social Changing values; Dietary habits
Ecological Biodiversity; Human biophysical interaction
Spatial Land-use change; Growth
Demographic Natural increase; Migration
As outlined above, comparing data on urbanization between different spatial units is error-prone and might lead to false conclusions. Moreover, the author is also aware of the difficulty of a universal definition, caused by the differences in historical development, administrative conditions
-1-3-
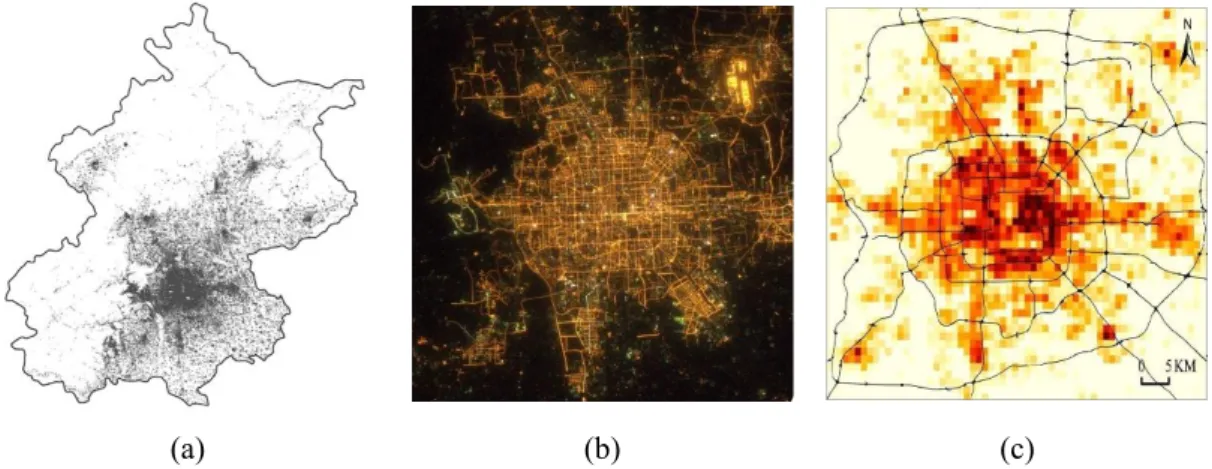
and respective foci. It must be emphasized that all definitions are in somewhat degrees of limited use when it comes to the micro level. This especially applies to the fuzzy distinction between urban and rural areas (Figure 1-1).
(a) (b) (c)
Figure 1-1. Different data sources over the same city`s (Beijing as example) delineation. (a) Administration boundary and spatial distribution pattern from remote sensing imagine (source: USGS website http://www.usgs.gov/) (b) Nighttime light (brightness) pattern (source: NASA) (c) The number of location requests based on dig data platform (source: https://heat.qq.com).
1.2 Research Background
1.2.1Global population and urbanizations
Population growth changes the appearance of cities worldwide (Figure 1-2). Excessive urban population growth has led to the inclusion of surrounding urban areas or small towns in the scale of urban space, forms a larger-scale, and ultra-large space aggregate that transcends the traditional urban concept. Cities with more than 10 million inhabitants are often termed “megacities”. In 2016, there were 31 megacities globally and their number is projected to rise to 41 by 2030 (Figure 1-3). Meanwhile, 45 cities had populations between 5 and 10 million inhabitants. A minority of people reside in megacities—500 million, representing 6.8 per cent of the global population in 2016. But, as these cities increase in both size and number, they will become home to a growing share of the population. By 2030, a projected 730 million people will live in cities with at least 10 million inhabitants, representing 8.7 per cent of people globally. Additional, Projections indicate that 29 additional cities will cross the 5 million mark between 2016 and 2030, of which 15 are located in Asia. In 2030, 63 cities are projected to have between 5 and 10 million inhabitants. (UNPD, 2018) Although the world’s population is expected to continue to urbanize, the pace of urbanization is expected to slow in the future, with both the absolute size of the urban population and the proportion urban likely to grow less rapidly (Figure 1-4). Thus, during 2018-2030 the urban population of the
-1-4-
world is projected to increase at an average annual rate of 1.7 per cent, much lower than in 1950-1970 (3.0 per cent), 1950-1970-1990 (2.6 per cent) or in 1990-2018 (2.2 per cent). For the period 2030-2050, the average annual urban growth rate is expected to be even lower at 1.3 per cent. The proportion urban is also expected to rise at a slower pace: 0.7 per cent during 2018-2030 and 0.6 per cent during 2030-2050. By 2050 the population of the world is projected to be 68 per cent urban, with urban dwellers numbering 6.7 billion (WUP, 2018).
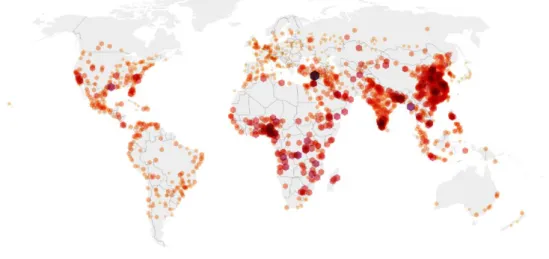
At present of the world’s 31 megacities (that is, cities with 10 million inhabitants or more) in 2016, 8 are located in the Eastern Asia regions or the “Far East”, including 4 cities ranks in Top 10 megacities in 2016, separately Tokyo, Shanghai, Osaka and Beijing, while Tokyo is developed and expected to remain the world’s largest city until 2030, despite the projection will decline of nearly 1 million inhabitants (Figure 1-5). In the meantime, more than half of the population lived in rural areas in 2016 of Asia, but that share is declining. Between 2016 and 2030, the number of cities with 500,000 inhabitants or more is expected to grow by 30 per cent in Asia. This means that urbanization or over-urbanization will continue to dominate Asia in the next 10 years, especially in East Asia, and will continue to highlight the most obvious urban agglomeration phenomenon across the world.
Figure 1-2. agglomeration growth rate of world cities size with more than 300,000 inhabitants. (Source: World Urbanization Prospects: The 2018 Revision Population Database
-1-5-
Figure 1-3. World`s population by size class of settlement, 1990-2030
Figure 1-4. Trends and projections in urban population as a percentage of total population by world region 1950–2030. (Source: WUP: The 2018 Revision Population Database)
-1-6-
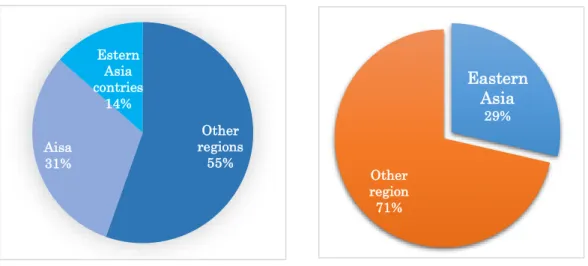
Figure 1-5. Proportion of East Asian megacities among the top 41 of global in 2030 projection (left) and Percentage of Top 10 of the world`s biggest urban agglomeration (right)
From urban geography and urban economic perspective, the driving force behind urbanization is a complex socio-economic process that transforms the built environment, converting formerly rural into urban settlements, while also shifting the spatial distribution of a population from rural to urban areas. It includes changes in dominant occupations, lifestyle, culture and behavior, and thus alters the demographic and social structure of both urban and rural areas. A major consequence of urbanization is a rise in the number, land area and population size of urban settlements and in the number and share of urban residents compared to rural dwellers. The degree or level of urbanization is typically expressed as the percentage of population residing in urban areas, defined according to criteria used by national governments for distinguishing between urban and rural areas. In practice, urbanization refers both to the increase in the percentage of population residing in urban areas and to the associated growth in the number of urban dwellers, in the size of cities and in the total area occupied by urban settlements.
As intensifies urban housing, economic and infrastructure development demand increasing by the urban population, more and more people decide to live in cities, whereas their needs cannot be satisfied within the initial urban area. In 2007, for the first time in history, the global urban population exceeded the global rural population, and the world population has remained predominantly urban thereafter (Figure 1-6). The pressure on housing markets and the growing demand from private investors and the public sector leads to the spatial growth of urban areas (Satterthwaite et al., 2010). In some countries, urbanization is changing the way of life of urban residents and also affect the lives of migrants with a rural background. Urbanization therefore is accompanied by a social transformation that can ideally be summarized as the change from a traditional rural to a modern urban society (Petković, 2007). Thereby, cities themselves become
Other regions 55% Aisa 31% Estern Asia contries 14% Eastern Asia 29% Other region 71%
-1-7-
social constructions and with the manifold metaphors illustrated that exist for urban areas: from body, jungle, and maze to mosaic and organism (Knox and Pinch, 2007).
Figure 1-6. Urban and rural population of the world, 1950–2050
As additional consequences, the impact of cities and urbanization on environmental issues in contemporary concerns are eventually located on human health and wellbeing. The health and welfare of the growing number of people in low and middle income who are living in urban areas has confront the increasing global urbanization which classed as a threat to ‘Public Health Security’ as the unprecedented level of population agglomeration may facilitate the spread of epidemic diseases (The World Health Report 2007: A Safer Future: Global Public Health Security in the 21st Century. Geneva: World Health Organization, 2007). Besides, the environmental issues deriving from land use conversion and anthropogenic activities are gaining increasing attention on the quantities of environmental benefits/effect due to the massive amount of construction arrangement, such as Urban Heat Island (UHI) phenomenon with result in temperature differences up to 8 °C between cities and their surrounding suburban and rural areas; the outdoor comfort evaluate with various physical parameters (air temperature, solar radiation, relative humidity, wind seed and the combination effect on physical well-being) as microclimate modifiers.
Consequently, as parameters replacement for physical environment from original natural to built-up surface, the higher the degree of urbanization, the more institutional settings the built environment been created, which brought much more significant impact om human health. This effect especially relevant to the morphology of the density, materials properties and vegetation characteristics of a city. Opening the discussion on physical environmental parameters change will help gain understanding and awareness for architects and urban developers to realize the bilateral impact of built environment on wellbeing of cities.
-1-8- 1.2.2 Cities of physical size growth
So far, no standardized international criteria exist for determining the boundaries of a city and often multiple different boundary definitions are available for any given city. And how best to define the geographical limits of a city is a matter of some debate. One type of definition, sometimes referred to as the “city proper”, describes a city according to an administrative boundary. Another approach, termed the “urban agglomeration”, considers the extent of the contiguous urban area, or built-up area, to delineate the city’s boundaries. The third concept of the city, the “metropolitan area”, defines its boundaries according to the degree of economic and social interconnectedness of nearby areas, identified by interlinked commerce or commuting patterns, their conceptualization illustrated in (Figure 1-7) and as examples with follows.
“The choice of how to define a city’s boundaries is consequential for assessing the size of its population. In Toronto, Canada, for example, approximately 2.6 million people resided within the “city proper” according to the 2011 census, but the population of the surrounding “urban agglomeration” was almost twice as large, at 5.1 million, and the population of the “metropolitan area” was larger still, at 5.6 million. Furthermore, rates of population growth differed across the three definitions. Between the 2006 and 2011 censuses, the population within Toronto’s “city proper” grew at an average annual rate of 0.9 per cent, compared to 1.5 per cent for the “urban agglomeration” and 1.8 per cent for the “metropolitan area””. (UN 2016: 1)
Figure 1-7. International criteria exist for the boundary definition of a city (Source from: the worlds cities in 2016 data booklet, United Nations Human Settlements Program)
-1-9-
The 2014 revision of World Urbanization Prospects (WUP) endeavoured, wherever possible, given available data, to adhere to the “urban agglomeration” concept of cities. Very often, however, in order to compile a series of population estimates that was consistent for a city over time, the “city proper” or “metropolitan area” concepts were used instead. Of the 1,692 cities with at least 300,000 inhabitants in 2014 included in WUP, 55 per cent follow the “urban agglomeration” statistical concept, 35 per cent follow the “city proper” concept and the remaining 10 per cent refer to “metropolitan areas”.
For the “city proper”, definitions are context-specific and might be based on “administrative, morphological or functional” (Byfuglien 1995: 83) indicators, depending on the perspective of the respective author or institution (Lerner and Eakin 2011; Montgomery 2008). Furthermore, they are “closely bound to historical, political, cultural, and administrative considerations” (UN 2008a: 104). Therefore, a global and universal definition could not be educed.
However, for the “urban agglomeration” and “metropolitan areas” the definition is even more difficult. Most authors have in common the emphasis of the procedural character of urban agglomeration or metropolitan areas with urbanization. While about one quarter of the countries in the world also consider population density (Panel on Urban Population Dynamics et al. 2003), which makes these definitions “policy neutral” (UN et al. 2007: 47) as they no longer depend on artificial administrative denominations, such as “‘urban centres’, ‘major cities’, ‘administrative centres’ or ‘municipalities’” (FAO 2005: 3).
The spatial expansion of urban areas is probably the most obvious manifestation of the urbanization process. An increasing urban population intensifies the demand for urban housing, economic and infrastructure development. While more and more people decide to live in cities, their needs cannot be satisfied within the initial urban area. The pressure on housing markets and the growing demand from private investors and the public sector leads to the spatial growth of urban areas (Satterthwaite et al. 2010). Subsequently, land traditionally used for non-urban purposes, such as agriculture and forestry, is transformed into built-up land. Many factors influence the way how urban areas are growing: the socio-political context with its traditions and policies, economic conditions, and the topography as a potentially limiting factor (Camagni et al. 2002). Depending on these factors, spatial expansion can occur in different forms, ranging from infillings to leapfrog-development (Table 1-2).
-1-10-
Table 1-2 Form of urban expansion
Spatial
expansion forms
Characteristics Influence factors
Infilling Building activities on open spaces that still exist within the urban area
flood-prone river beds, road and railway, steep hills, potentially contaminated areas
Extension Non-infilling urban growth adjacent to built-up areas
formal urban development plans and housing schemes, infrastructure provision and land price
Linear development Development along important axes of urban transport infrastructure
transport of goods and people, attractive of economic development
Scattered development
Non-contiguous, low-density development in an area adjacent to the built-up urban area.
real estate activities and monetization of land, land use policies and administration
Leapfrog-development
Planned development of large tracts of land
With favors of politicians as prominent symbols of urban development
While most definitions of urbanization imply a “shift in settlement patterns from dispersed to more dense settlement […], much of the expansion of urban land use is the result of a shift from dense to more dispersed settlement” (Satterthwaite et al. 2010: 2810). With increasing economic development and as many cities have reached their limits in terms of population density, many urban dwellers decide to move to the less densely populated rural areas. As a consequence, the spatial growth of these cities is further accelerated.
This leads to manifold conflicts, especially in the rural areas, where most of the urban growth takes place. The increasing consumption of natural resources, such as land, forests, and water caused by the “large-scale conversion of open space and environmentally sensitive lands to urban uses” (Arku 2009: 255) creates new conflicts between those depending on these resources and urban stakeholders
-1-11- 1.2.3 Morphology and urban structure
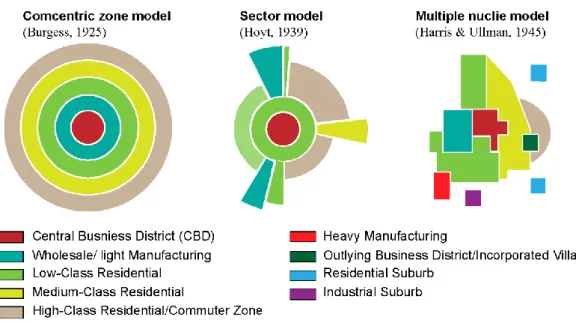
A wide range of sociologists, economists and – most importantly – geographers have developed a large number of models that help generalize the complex morphology of urban areas (Luck and Wu 2002). These models go beyond a simple description of urban structures trying to provide explanations for the abovementioned arrangements in urban contexts. The classical models of urban morphology (see Figure. 1-8) were developed in the first part of the 20th century, yet they still provide a valid entry point for studies on current urbanization.
Figure 1-8 Classical models of urban morphology (based on Park et al. 1925; Hoyt 1939; Harris and Ullman 1945).
The “Concentric zone model” (Park et al. 1925), also known as the Burgess’ model. The model basically transfers by von Thünen (1910) on regional land use to an urban context. The basic assumption of the concentric zone model is the relationship between the socio-economic status of the population and the distance from the city centre, namely the Central Business District (CBD). Hoyt’s (1939) “Sector model” supplemented Burgess’ model with sectors that are oriented along important transportation arteries, such as railways and highways. While the “Multiple nuclei model” by Harris and Ullman (1945) reflected the incorporation of former satellite villages, result a more diversified and more complex urban landscape of locational endogeneity.
The models of urban morphology introduced below have in common the understanding of urban areas as providing the framework for residential, office, manufacturing and infrastructure purposes. These models help understand the drivers of urban development which eventually lead to current urban morphology. While the abovementioned models are of limited validity due to the oversimplification of the complexity of urban environments, they are still helpful in understanding
-1-12- urban structures.
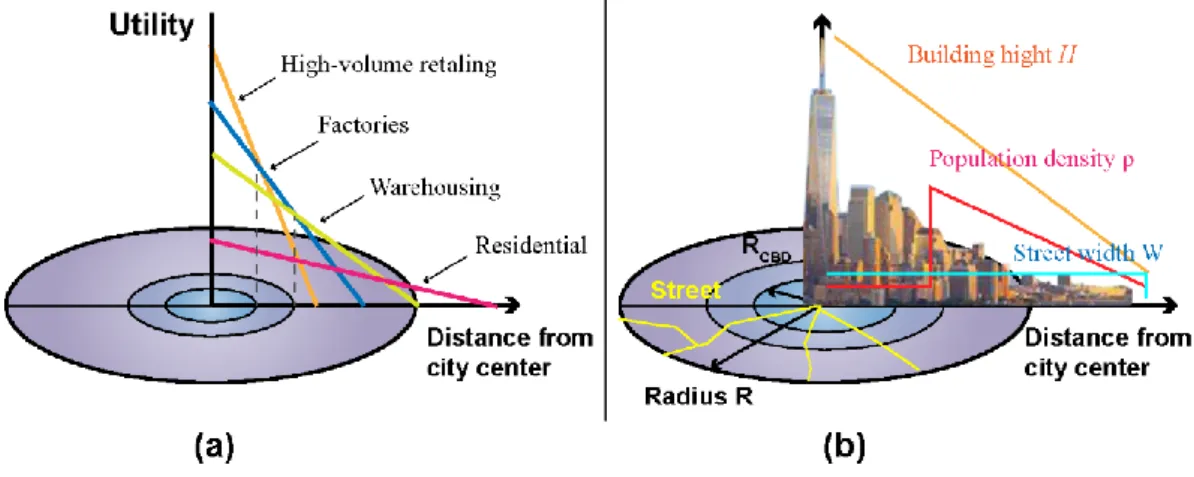
No matter what modeling method is used to simulate the structure of the city, an important point that cannot be ignored is that it has the same central directivity as urban agglomeration. The reason why a city becomes a city is because certain natural geography or social and human characteristics of the area have elements that bring people together, and in the form of a city center, it is manifested by the radius radiation structure from the center to the surroundings morphologically. Therefore, here has a simple radial effect, the simplified city used for the simulations is assumed to be circular with a radius R (Figure. 1-9). It consists of a central business district (CBD) in the city center, with decreasing impact on land use and population densities, including transport cost and central accessibility for central-periphery amenities attributes. Most of the places are located, surrounded by mostly residential buildings, gradually becomes commercial volumes with proportional to the increase of locations distance to the central.
Figure 1-9 Central radius effect in different urban function of structure formation. (a) Relationship between urban utility and radial effect (b) Relationship between multiple
morphology and activity indicators and radial effect.
As shown a long line literature of a monocentric tradition, urban structure has serves as an isotropic surface, which hypothesized a uniform plane representing a city and its use zones. while the accessibility of a location is a function of utility, which decrease steadily with distance from the center. However, the utility itself decrease from the center are at different rates with respect of the land users, since different users endure different rent and trade-off model for various central radius.
1.2.4 City size and urban dynamics affect
From systematic point of view, it seems the quiet life of city`s dweller with respect of spatial living patterns is thus hitting with a double whammy: the bigger the city, the faster life is; but the rate at which life gets faster must itself accelerate to maintain the city as a going concern (Webb, 2007).
-1-13-
This increasing resistance of system mass for population mobilities received the wisdom on examining how different indicators of cities’ activity and infrastructure scale with their size. It indicated a physical statistics population value of the cities and yield a power law scaling for its size various as the form (population)n. In other words, an irreversible process can be found for cities the world over become more hyperactive if the larger they growth. And this attribute cities as the so called self-organized systems for their typical and universal macroscopic geometry properties that generate the proportional growth process through a series of scaling patterns.
At the literature end of systems of cities and the scaling laws, both the empirical and theoretical approaches are mainly focus on describing the macro variables of cities` socio-economic or physical state evolves with their population changes. In the real patterns of settlement and urban hierarchy that possibly lead by people`s interactions, if the statistics urban indicators proved the cities to following some proportional growth process and support in favor of a power-law distribution regularity with at least the upper-tail index approximate to one, then will automatically converge to the Zipf`s law (Zipf, 1949; Gabaix, 1999) (see Figure. 1-10). Despite there still have debate on whether the Zipf`s law can always observe in population agglomeration of most cities as universal city scales been disputes, a common belief from the power-law underlying distribution of city size and its randomly systematic indicators sampling has suggested a ‘coherence’ evolution process of city`s population or areas with valid consequence of size distribute (Cristelli, 2012).
Figure 1-10 The distribution regularity of city size and rank in the United States from 1790– 1940. (sources: Allen, 1997:30)
-1-14-
On examining and characterizing the macro variables of city`s activity and infrastructure scale from empirical evidence, Luis Bettencourt (2007) has makes an outstanding contribution after he use various sets of data to revealing the scaling relationship from population values n of mass as power-laws distribution in different cities` indicators samplings. They find that the economic activity of individual citizens income and total electricity consumption varies with population values n is in the range 1.1–1.3; while the infrastructure indicators such as the lengths of the road and electricity networks, are contrary scales around (population)0.8, suggest that the larger the metropolis, the less
of these things each citizen has at their disposal. Thus, if city growth only driven by wealth creation (n > 1), the urban dynamics then will rapidly become hyper exponential, which effectively reconstruct the original condition of city`s growth. These makes the cities fulfill by two basic needs of modern human society: the facilitating of ideas exchange and wealth creation as expansion; the economies achievement supply by scales of a population’s needs. The only way in this situation to avoid collapse as a population outstrips the finite resources available to it is through constant waves of innovation. But the upcoming investment usually hard to march the greater absolute population, that relatively smaller for return on each such investment, which makes the whole system of cities a much more hyperactive.
1.3 Overview of pre-industrial urban structure in earlier Eastern Asia cities
Urbanization seems to be an indispensable process at present, and existing research reports all support this view, that is, while the city continues to expand outside and outside, its internal structure is becoming more and more complicated. However, one perceptions of cities until quite recently were that they were largely stable in spatial structure over long history periods of time, for centuries, and that is suggested that they were in historical of equilibrium. This phenomenon is also common in East Asia, where the degree of urbanization is the most intense, especially those ancient cities with a long history. They were distributed in large numbers before modernization, but there was no excessive expansion. And as the embryonic state of cities and with static state until it develops into overspread urbanization process of bifurcations. This provides us with an opportunity to peek into the human settlement patterns and urban operating mechanisms before urbanization. In the non-industrial state, the structure model mechanism of the city as a spatial organism, The relatively static and simple relationship between its internal spatial structure and human activity behavior will provide a state similar to equilibrium for the current more complex population distribution and subsequent on commuting patterns, and to help them measure the complexity of the current urban structure.
Wall surrounded formation of ancient cities in East Asian, also by terms ‘Sinology City’ due from its special planning structure for the spatial organization, which on mostly captured a homology features from economic and geographic of urban planning. The land division system in ancient time
-1-15-
usually known its features from the Nine square grid planning on urban facility arrangement, and has been considered effect a lot in processing to construct a Sinology city. As the land dividing system, it practices with a square grid as central of coordinate, multiplies within grid structure consistently and distribute subregions into eight surrounding copies. To categories the sinology network system on theoretical and empirical, two essentials occur as unneglectable process, hierarchy division and land size distribution.
For the first essential, hierarchy division on urban area dimension, which adapt most features on wall shapes` allocation and economic hierarchies` classification, Ionnaides & Zhang (2015) point out the balance between agglomeration economies and diseconomies determines with the physical isolation of walled city. For spatial management, the imperial capital walls were erected to separate different ethnic groups, different functional districts, and to assure civil safety and security. (Sen-Dou Chang,1969), tried explain this spatial structure by applying the theory of ‘Folk-Urban Continuum’ (Redfield,1955; Mote,1977), which the urban decentralized its spatial portion gradient into the approximated regions with different spatial hierarchies surrounded, that analogous the city boundary compose as a consists internal organic of cells, or from (Healey,2000), which indicated the spatial distribution in terms of ‘uniplex city’. Among above researches, Yannis M& Junfu Zhang (2015) after Dittmar (2011) and Desmet & Rappaport (2013) also indicated that some proper size cutoff on physical wall shaped areas follows the power law as city size fundamentals, which realized that there should exist some basic gene for spatial fundamental whose account large portion for space authority, and effect on boundaries` allometry. As consequence, the growing limited for these generators` expansion in different degrees can explained their spatial structure by clustering the size distribution as forms iteration on each subregion. on another hand, this process also be found to coincidence with the statement of the invisible hierarchy hidden on traditional ceremonial orders. For analogue express, the operating from Cantor set also can help to understand this iterative process during the speculation, since they share a similar structure on formulation model.
For the second essential in land division process, Sinology land size distribution as a historical topic on land administration, has frequently been aroused for earlier empirical literature. In order to characterize the microeconomics fundamental from city, many researchers devote their concentrate onto the organic analysis as urban framework studies. By applying morphology analysis as integrate studies on various science, many factors work as space cell in micro levels has been found with the forms. Here, large literature on morphological comparation mentions how to characterize a Sinology urban formation within the grid planning pattern, (Zhang,2008; Heng & Kiang, 2016; Qin & Li, 2017; Shuji Funo,2017) and the classical description of Wangcheng (the royal capital city) in Kaogongji has frequently referred to reference. (He,1985). Indicated from variable studies, conception on urban planning practice most emphasized the utilize of hierarchy system with wall to shape city in square, that within a symmetrical grid street system and North-south orientation, thus
-1-16-
the dimensions can commensurate with the city`s position in urban administrative hierarchy (Whitehand & Kai Gu, 2006) devote this feature as principle to urban generation; while some scholars like (GAUBATZ, 1998; Wang & Wang, 2008) attribute these dividing pattern as schema to train the livelihood space for form regularity at household level. Besides, (Esherick,2000; Smith,2007; Shuji,2017) tried quantify instances respectively for evidence to approach the original model. As brief introduction, such discrimination on spatial organize provides a historical perspective to capture the microeconomic character from sinology planning pattern, which led studies into the empirical field of traditional modular coordination system. To be the crucial in generate a Sinology city at land size, the modular of body-measuring on grid planning have been considerate a lot that attribute the Sino-centralized thinking conducted into city area. Owe to the legitimacy granted from ceremonial order, these size in rules of measurement obtained a property for land authority that can treat the measure unit as a spatial fundamental and to regulate the production activity in various condition.
During this process, many of these literatures inclined to explain the invisible connection hidden on traditional logical of form evolution or its size distribution. Despite these steady upcoming researching intend to approach the crucial model fundamentally, some part still can be easily ignored, that few can recognize the equivalent proxy effect on property of economic which was directly correlated with the size of land, hence the range of activities for body parts occupied the dimension in homogeneity and can shapes the space by square grid as individual economic unit. To the best of our knowledge, only few researches train these empirical conceptions onto principle of land division via the practical case studies on urban scale, like Shuji Funo,(2017) whose focus on basic scale on square unit with sinology measurement system in ancient times, which directly related on elementary patterns of urban size, effect on various forms and layout. The crucial here is, the modularity of these basic squares with traditional unit of vary, not only can helps to resemble the city size through land division, but also provides an important potential to statistic the individual economic unit by algorithm calculation. Correlated research also can seem from Spiro Kostof (1991) who mentioned the availability on Grid planning system that use commonly grid square as basic and stable pattern to curve urban form both in economic hierarchy and typo-morphology of sinology cities.
1.4 Purpose of the study
Based on the abovementioned research background and Problems encountered to date, the objective of this study is to enhance the understanding of spatio-temporal dynamics of city size and internal structures along the central-peripheral continuum with special focus on organizational interaction of cities in Eastern Asia. Configuring the correlation between human activity of its pre-industrial agglomeration potential and pre-industrial human settlement size. Additionally, we purpose a
-1-17-
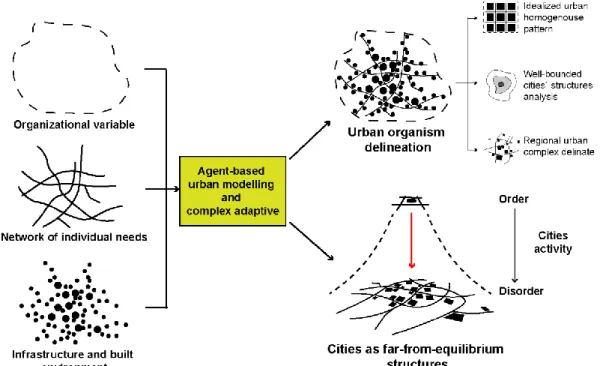
structure model to simulate the expansion and growth mechanism of cities organism evolves from historical or idealized equilibrium to contemporary system complexity. The conceptual framework portrayed below (Figure 1-11) presents the overview of participate objectives and interaction of the urban agglomeration delineate. The conceptualization of proposed mechanism and its pattern formation for cities activities adaption are demonstrated in (Figure 1-12). And the research flow chart of this thesis is described in (Fig.1-13).
Figure 1-11 Research object and delineation problem of urban agglomeration
-1-18-
The following two main research questions were formulated in order to contribute to achieving the objective:
1. How to accurately situate the size of urban population agglomeration with a clear number and scale to the boundary of the fuzzy and discrete urban physical scale?
2. How to implement the orderly and regularly of urban system mechanism into a complex distributed morphology structure?
There are, however, efforts to model individual activities and combine this with geography data using agent-based models. This approach has not been feasible for a city with a large number of urban dwellers up to now because of computing constraints and lack of information about individual behavior. Thus, exposure modeling approaches with intermediate complexity are needed, where the modeling of urban structure and a simplified representation of the populated sites of urban dwellers within the city are combined. With this coupled modeling system, they were able to identify urban morphologies that disturb the overall exposure to city size distribution and delineation.
➢ Motivation and methodology
In the following chapter, a review of the relevant literature is given. Based on empirical analysis evidence, a case study of the historical development trajectory of the city`s delineation confusing has demonstrated in Yahata Eastern, Kitakyushu, Japan, specifically elaborates the gaps that are common existed when depicting urban variables with conventional formation patterns. Then introduced the existing cutting-edge theoretical tools and the modeling methods that expected to across such city definition ambiguity.
➢ Theoretical model analysis of fractal cities pattern
In chapter 3, Firstly, the differences and advantages of the urban space measurement method and the traditional spatial coordinate system in the fractal dimension are described and compared. Then through the analysis of the complexity of the internal structure of the urban space form under the idealized fractal structure, that to evaluate the adaptability of the expression of fractal theory to the urban system. The assessment mainly concerns the complexity of the urban street wind environment under the idealized structure, and the road accessibility of the city center.
➢ Fractal analysis on well-behaved historical city organism
In chapter 4, First, the historical background and composition of the urban structure of ancient East Asian walled cities were analyzed Then, by using the allometric growth scaling method, the obtained spatial structure of the historical walled city is used as an organism to carry out structural simulation and calculation, The effects of the same radius in different urban samples and the same local individual effects were evaluated. The purpose of this step is to evaluate the applicability of the
-1-19-
mono-fractal model to clear and orderly urban boundaries by simulating urban forms with complete boundaries.
➢ Historical cities` variables with human body size adapts
In chapter 5, First of all, the statistics and summary of the body measurement models commonly used in East Asia during the pre-industrial period, Then, the human scale units in different periods are used as the intermediary medium of complexity adaptive, and intervene in the walled city case studied in Chapter 4, in order to observe the size of the human body as the smallest ethnic feature, and with maximum likelihood method to collect and simulate the information of the urban structure with a clear boundary shape.
➢ Innovation and application on natural city of simple modelling
In chapter 6, First, it discusses the feasibility of using standard human body size as a mass point to perform cluster statistical calculation and system complexity intervention on the entire urban physical scale and urban population scale at the same time. Secondly, it discusses the possibility and realization method of watershed algorithm to divide the relationship between urban systems. After that, combining agent-based model and watershed image segmentation method, With the help of the box-counting of fractal dimension calculation method, a set of modeling and calculation methods for the morphological complexity and closeness of the urban building environment based on the size of the human body has been innovated
➢ Conclusion and outlook
In chapter 7, a conclusion of whole thesis is deduced and the future study about simulation and optimization of urban organism has been discussed.
-1-20-
-1-21- Reference
Seto, Karen C., et al. “Global Forecasts of Urban Expansion to 2030 and Direct Impacts on Biodiversity and Carbon Pools.” Proceedings of the National Academy of Sciences of the United States of America, vol. 109, no. 40, 2012, pp. 16083–16088.
Byfuglien, Jan. “On the Search for an Urban Definition at the European Level.” Norsk Geografisk Tidsskrift-Norwegian Journal of Geography, vol. 49, 1995, pp. 83–85.
Lerner, Amy M., and Hallie Eakin. “An Obsolete Dichotomy? Rethinking the Rural-Urban Interface in Terms of Food Security and Production in the Global South.” The Geographical Journal, vol. 177, no. 4, 2011, pp. 311–320.
Montgomery, Mark R. “The Urban Transformation of the Developing World.” Science, vol. 319, no. 5864, 2008, pp. 761–764.
Camagni, Roberto, et al. “Urban Mobility and Urban Form: The Social and Environmental Costs of Different Patterns of Urban Expansion.” Ecological Economics, vol. 40, no. 2, 2002, pp. 199–216. Arku, Godwin. “Housing Policy Changes in Ghana in the 1990s.” Housing Studies, vol. 24, no. 2, 2009, pp. 261–272.
Luck, Matthew, and Jianguo Wu. “A Gradient Analysis of Urban Landscape Pattern: A Case Study from the Phoenix Metropolitan Region, Arizona, USA.” Landscape Ecology, vol. 17, no. 4, 2002, pp. 327– 339.
Chang, Sen-dou. “The Floating Population: An Informal Process of Urbanisation in China.” International Journal of Population Geography, vol. 2, no. 3, 1996, pp. 197–214.
Redfield, Robert. The Little Community and Peasant Society and Culture. 1955. Mote, Frederick W. Imperial China: 900–1800. 1999.
Healey, Patsy. “Planning Theory and Urban and Regional Dynamics: A Comment on Yiftachel and Huxley.” International Journal of Urban and Regional Research, vol. 24, no. 4, 2000, pp. 917–921. Ioannides, Yannis M., and Junfu Zhang. “Walled Cities in Late Imperial China.” Journal of Urban Economics, vol. 97, 2017, pp. 71–88.
Whitehand, J. W. R., and Kai Gu. “Research on Chinese Urban Form: Retrospect and Prospect.” Progress in Human Geography, vol. 30, no. 3, 2006, pp. 337–355.
Ma, Ding, et al. “Understanding Chinese Urban Form: The Universal Fractal Pattern of Street Networks over 298 Cities.” ISPRS International Journal of Geo-Information, vol. 9, no. 4, 2020, p. 192.
-1-22-
Wang, Wei-Ju, and Ming-Hung Wang. “Embedded Schema: Towards a New Research Program of Traditional Chinese House Types.” Journal of Asian Architecture and Building Engineering, vol. 7, no. 1, 2008, pp. 1–7.
Esherick, Joseph, et al. The Chinese Cultural Revolution as History. 2006.
Smith, Michael E. “Form and Meaning in the Earliest Cities: A New Approach to Ancient Urban Planning.” Journal of Planning History, vol. 6, no. 1, 2007, pp. 3–47.
Satterthwaite, David, et al. “Urbanization and Its Implications for Food and Farming.” Philosophical Transactions of the Royal Society B, vol. 365, no. 1554, 2010, pp. 2809–2820.
Petković, Jelena. “Traditional Values and Modernization Challenges in Forming Urban and Rural Culture.” FACTA UNIVERSITATIS - Series Philosophy, Sociology, Psychology and History, no. 1, 2007, pp. 23–39.
Knox, P. L., and Pinch, S. (2007), Urban social geography: An introduction (5. ed., Harlow). Webb, Richard. “The Urban Organism.” Nature, vol. 446, no. 7138, 2007, pp. 869–869. Zipf, George Kingsley. Human Behavior and the Principle of Least Effort. 1949.
Gabaix, Xavier. “Zipf’s Law for Cities: An Explanation.” Quarterly Journal of Economics, vol. 114, no. 3, 1999, pp. 739–767.
Cristelli, Matthieu, et al. “There Is More than a Power Law in Zipf.” Scientific Reports, vol. 2, no. 1, 2012, pp. 812–812.
Allen, Peter M. “Cities and Regions as Self-Organizing Systems : Models of Complexity.” Proceedings of the Brazilian and Ibero- American Congress on Social Housing, 1997.
Bettencourt, Luís M. A., et al. “Growth, Innovation, Scaling, and the Pace of Life in Cities.” Proceedings of the National Academy of Sciences of the United States of America, vol. 104, no. 17, 2007, pp. 7301– 7306.
Funo, Shuji. “Ancient Chinese Capital Models — Measurement System in Urban Planning —.” Proceedings of the Japan Academy. Series B, Physical and Biological Sciences, vol. 93, no. 9, 2017, pp. 724–745.
Zhang,2008, View on Kao Gong Ji's record-related to modular of city planning The fundament unit (Chinese)
Zhang, Ji, et al. “Evaluating Environmental Implications of Density: A Comparative Case Study on the Relationship between Density, Urban Block Typology and Sky Exposure.” Automation in Construction,
-1-23- vol. 22, 2012, pp. 90–101.
Xingrong Qin & Qiang Li, The square field system on city grid of Zhou Dynasity[in Chinese]井田制下 的周代城市格网, Proceedings of China Urban Planning Annual Conference,2017
He Y. A study of system of city Construction in Kaogongji. Beijing: China architecture&building press,1985(in Chinese)
Chapter 2
CHAPTER TWO: MOTIVATION AND METHODOLOGY
2.1 BRIDGING THE GAP BETWEEN POPULATION AGGLOMERATION AND URBAN BUILT-UP ENVIRONMENT ... 2-1 2.1.1 INTRODUCTION OF THE DISREGARDING OF CITIES WITH LOCATIONAL QUANTIFYING ... 2-1 2.1.2 POPULATION DISTRIBUTION APPROXIMATE BY THE URBAN SYSTEM ... 2-2 2.1.3 MORPHOLOGY OBSERVATION OF INTRA-URBAN VARIATIONS ... 2-6 2.2 LOCATIONAL RESPONSIVE OF URBAN MODELLING METHOD ... 2-11 2.2.1 LONG LINE LITERATURE FROM URBAN GEOGRAPHY AND ECONOMIC ... 2-11 2.2.2 FRACTAL UNDERLYING OF URBAN CLUSTER INTEGRATION ... 2-13 REFERENCE ... 2-23
-2-1-
2.1 Bridging the gap between population agglomeration and urban built-up environment
2.1.1 Introduction of the disregarding of cities with locational quantifying
An emerging approach toward the cities research with interdisciplinary science of involvement (Batty, 2013) is encouraging the finding on locational linking between human activities in urban areas and to the form of cities, and correlated environmental consequences and socio-economic benefits. It suggests a locational responsive of the whole organization system of cities with their form patterns, environmental consequences and socio-economic activities in eventually links to the human activities of urban areas. In related research field, a recent surge in interest in the quantifying of the environmental and socio-economic development of cities growth is in active for the material patches with respect of their exact form shapes, especially for the spatial agglomeration of population increase of urban form emergence (Bettencourt, 2013; Leitao et al., 2016). This approach, however, can easily to find the evidence of cities with highly integrated centers of the whole systems organize but few can prove the actual counterpart as the ‘singularity’ from material fabrics and internal structure, which themselves within various driving force from urban dynamics, thus ignoring endogeneity effects or externalist. Moreover, with the accelerated merging of cities agglomerate, it will be more and more difficulty to a coherent and homogenous definition across many different cities of their evolution boundary and urban ontologies. At present, one of the effective response methods is to adapt the urban dynamics in accordance with the scaling relationships analysis of the major influence the cities received (Louf and Barthelemy, 2014; Arcaute et al., 2015).
In this section we taking the Yahata eastern area of Kitakyushu city in Japan, as an example, by studying the urban development from morphology change and city size growth, a localized cases of the temples distribute are used to show and verify the locations regardless of cities at the macro levels of structure integrate.
Since the temples have usually contents lot of meaning with the respecting of environment and its native state in many Eastern country. The location of these monastery usually will choose a subtle place to seek for the balance of the city and nature. As a kind of combination of urban structure, it will develop a typical way to organize a city and become the crucial of this structure. This makes people can easily recognize the interaction boundary of the city and its circumstance by understand the temple`s location. Nowadays, with the past development of industrial, the continuation of this special urban framework still reminds people that the influence of regional and its value orientation, always has effect on the view of social community, and this kind of social consciousness still not can be totally replaced by the universal value currently. Things can be observed in Yahata east area, which Buddhist temple wild spread, and lies many constructions from industrial times. The capacity of traditional structure organized by the temple and its affiliated space already overload. Under such