DOCTORAL DISSERTATION
THE PRETREATMENT OF AMMONIUM AND
MICROPOLLUTANTS IN DRINKING WATER TREATMENT
PLANTS USING NITRIFYING EXPANDED-BED REACTOR
WITH BIOLOGICAL ACTIVATED CARBON MEDIA
DAO THI MINH NGUYET
THE UNIVERSITY OF KITAKYUSHU
GRADUATE SCHOOL OF ENVIRONMENTAL ENGINEERING
THE PRETREATMENT OF AMMONIUM AND
MICROPOLLUTANTS IN DRINKING WATER TREATMENT
PLANTS USING NITRIFYING EXPANDED-BED REACTOR
WITH BIOLOGICAL ACTIVATED CARBON MEDIA
by
DAO THI MINH NGUYET
Februray 2020
This dissertation is submitted for the degree of Doctor of Engineering The University of Kitakyushu 2020. All rights served. No part of this publication may be reproduced without the prior
DECLARATION
This dissertation is the result of my own work and contains no material which has been accepted for the award of any other degree or diploma in my name, in any university or other tertiary institution. It contains no material previously published or written by another person, except where due reference has been made in the text. This dissertation has not been previously submitted, in part or whole, to any university or other tertiary institution for any degree, diploma, or the other qualification.
Author Supervisor
Dao Thi Minh Nguyet Professor Hidenari Yasui February 2020
ACKNOWLEDGEMENTS
The PhD journey is a special and unforgettable experience of a life-time to me. When I write these words to close the journey, I would like to take a moment to thank the people who accompanying me during my PhD works.
First and foremost, I would like to express my deepest appreciation to my supervisor Professor Hidenari Yasui for his dedicated support and guidance. I feel very proud of being your PhD student. Your approach in training independent researchers is not easy to say the least; however, I do gain a lot of knowledge and skills through the trials and errors. Thank you for asking the questions that sharpen my insights and raised my works to a higher level. Your responsive feedbacks and tireless efforts in correcting my manuscripts and thesis are very meaningful to me. I also highly appreciate the opportunity of working in your laboratory where we have everything in hands to satisfy our science curiosity.
I would also like to extend my sincere gratitude to Associate Professor Mitsuharu Terashima for his insight comments throughout my study. Your explanations are always simple and efficient which helped me to overcome the research challenges. Your kind supports and encouragements mean a lot to me.
I am deeply indebted to Professor Kiwao Kadokami, without whom my research would not have been possible. Thank you for allowing me to use your laboratory in most of my experimental works. You do not mind showing me how to proceed the cumbersome analysis properly, or spending time to answer to any of my questions. Your generosity, kindness and warm smiles are always cheering up anyone around you including myself. I am very grateful to Professor Nguyen Viet-Anh in the University of Civil Engineering in Hanoi, Vietnam. He was the one who introduced me to the PhD work, and always give me the advice and encouragement from distance. His analytical thinking, enduring enthusiasm for academic science and perseverance have always been an inspiration to me.
valuable comments on my research.
My gratitude also sends to the Vietnam International Education Development (VIED) for the financial supports which made my PhD oversea possible.
I wish to thank my lab-mates in Yasui-Terashima laboratory for supporting me during my PhD works. We have been working together days and nights, running breathlessly for the weekly and monthly reports. I wish you achieve all your goals and success in your future research career.
I always feel like home in Japan thanks to my surrounding Vietnamese friends whom I could not mention all their names here. I am very happy to be part of our “big family”, to share my joys and sorrows with you. You made my four years in Kitakyushu unforgettable. Words could not express my deepest gratitude to my dearest husband and children, and our families in Vietnam. Your trust and encouragement made me stronger to overcome all the challenges. We have experienced this together, and I am grateful to have your presents in every moment of my PhD journey.
ABSTRACT
At present, the quality of the drinking water supply source is degraded by the pollutants originated from various human activities. Among those contaminants, ammonium and micropollutants are of critical concern due to their toxic and harmful effects to public health and aquatic system, as well as troubles induced in the operation of drinking water treatment processes. Different treatment methods could successfully remove ammonium and micropollutants from water; however, a technology that balanced the treatment efficiency, cost-effectiveness, and sustainability is desirable.
In this regard, a nitrifying expanded-bed reactor using biological activated carbon (BAC) media appeared to be responsive to the demand. Rather than focusing on the adsorption capacity, this process uses exhausted granular activated carbon (GAC) media as the carrier for microbial colonization. This naturally occurring biofilm can biodegrade a wide variety of contaminants such as ammonium, micropollutants, disinfection by-products precursors, and other organic/inorganic substances. In this way, the service life of BAC media could be significantly extended. The up-flow direction also offers advantages, such as improvement of contact between water influent and the biomass in the whole expanded-bed, or reduction of head loss and backwashing frequency.
In the first part, a kinetic model of a nitrifying expanded-bed reactor for the pretreatment of drinking water was developed to analyze its behavior under different concentrations of influent dissolved oxygen, ammonium, and organic substrate. In the laboratory, an up-flow expanded-bed reactor was initially fed with synthetic water containing 1 mg NHx-N/L to
stimulate nitrifiers growth, followed by varied NHx-N loadings (1–2 mg NHx-N/L with a
fixed linear velocity). From tracer tests, the hydraulic regime of the expanded-bed reactor was simulated to be 11 tanks-in-series. To model the even distribution of media in the expended-bed height, a mathematical internal recycle flow allowing the movement of media between the cell tanks was made. The performances were also studied on the pilot-
and full-scale reactors receiving river water in two water treatment plants in Vietnam. A single set of biological kinetic and stoichiometric parameters was elaborated that successfully reproduced the five different datasets over the lab-, pilot- and full-scale reactors. The attachment/detachment specific rates of the biofilm were estimated during filtration cycles and backwash events. The graphical guidance and empirical equation were provided to obtain the reactor treatment efficiency under variable influent and temperature. Additionally, the dissertation summarized the principles of the biofilm and biological model with a focus on the Integrated Fixed-film Activated Sludge (IFAS) object on the GPS-X software. The sensitivity analysis of the numerical calculation and operational parameters on the calculation results was also carried out.
In the second part, the possibility of degrading the pesticides using nitrifying expanded-bed reactor was investigated. The field analysis demonstrated that four pesticides Flutolanil, Buprofezin, Chlorpyrifos, and Fenobucard, were removed at the removal efficiencies of 82%, 55%, 54%, and 52% respectively, while others were not significantly removed. Under controlled laboratory conditions with continuous and batch experiments, the adsorption onto the biological activated carbon media was demonstrated to be the main removal pathway of the pesticides. The contribution of microorganisms to the pesticide removals was rather limited. The pesticide removals observed in the field reactor was speculated to be the adsorption on the suspended solids in the influent water or to the biofilm in the reactor. The obtained results highlighted the need to apply a more efficient and cost-effective technology to remove the pesticides in the drinking water treatment process.
TABLE OF CONTENTS
DECLARATION ... ii
ACKNOWLEDGEMENTS ... iii
ABSTRACT ... v
TABLE OF CONTENTS ... vii
LIST OF FIGURES ... 1
LIST OF TABLES ... 5
CHAPTER 1. INTRODUCTION ... 6
1.1. AMMONIUM OCCURRENCE AND THE NEED OF REMOVAL IN DRINKING WATER TREATMENT ... 7
1.2. MICROPOLLUTANT OCCURRENCE AND THE NEED OF REMOVAL IN DRINKING WATER TREATMENT ... 12
1.3. INTRODUCTION ON GRANULAR ACTIVATED CARBON AND APPLICATION IN WATER TREATMENT ... 17
1.4. BIOFILM MODEL IN ACTIVATED SLUDGE MODEL (ASM1) ... 19
1.5. DISSERTATION STRUCTURE ... 22
CHAPTER 2. EXISTING RESEARCHES ... 24
2.1. REMOVAL OF AMMONIUM IN WATER TREATMENT ... 25
2.1.1. Physico-chemical technologies ... 25
2.2. REMOVAL OF MICROPOLLUTANTS IN WATER TREATMENT ... 33
2.2.1. Physico-chemical technologies ... 33
2.2.2. Biological technologies ... 35
2.3. APPPLICATION OF ACTIVATED CARBON IN DRINKING WATER TREATMENT ... 38
2.3.1. Adsorption onto granular activated carbon process ... 38
2.3.2. Biological activated carbon process ... 40
2.4. CONCLUSION ... 42
CHAPTER 3. MATERIALS AND METHODS (PLATFORM OF BIOCHEMICAL MODEL) ... 43
3.1. INTRODUCTION AND OBJECTIVES ... 44
3.2. PHYSICAL DESCRIPTION OF THE REACTORS AND THE MODEL CONCEPT ... 46
3.3. BIOFILM MODEL IN GPS-X SOFTWARE ... 49
3.3.1. Introduction of the biofilm model in GPS-X software ... 49
3.3.2. The mass balances for soluble and particulate components ... 50
3.4. BIOLOGICAL MODEL WITH TWO-STEP-NITRIFICATION PROCESS ... 56
3.4.1. Introduction of the biological model with a two-step-nitrification process on GPS-X software ... 56
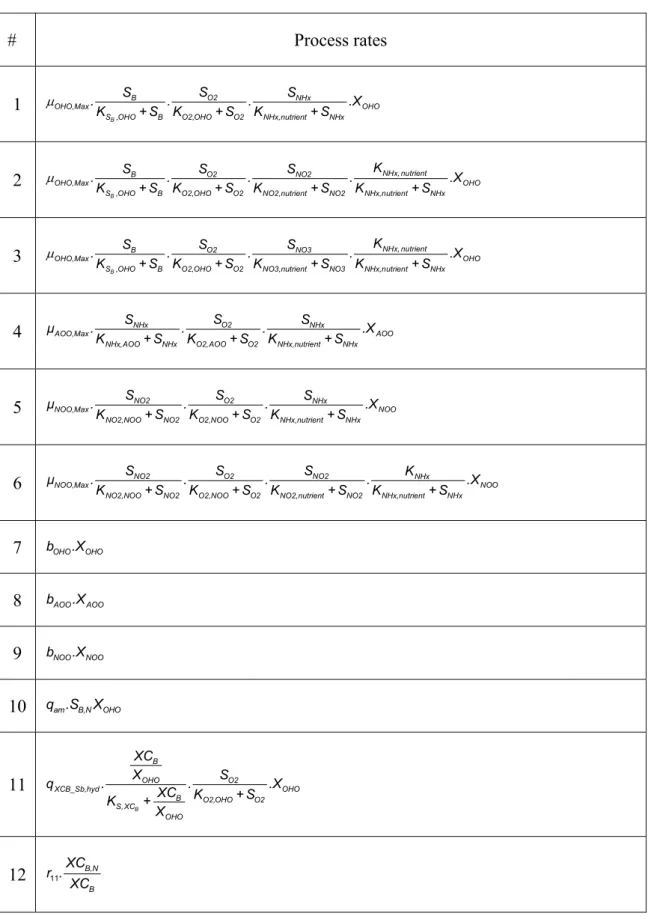
3.4.2. The Peterson matrix and reaction rates for a biological model with two-step-nitrification ... 57
3.4.3. The continuity checking of the proposed model ... 64
3.5. CONCLUSION ... 68
CHAPTER 4. PHYSICAL MODEL OF AN EXPANDED-BED REACTOR WITH GRANULAR ACTIVATED CARBON MEDIA ... 69
4.1. INTRODUCTION AND OBJECTIVES ... 70
4.2. MEDIA FRACTION OF GRANULAR ACTIVATED CARBON IN THE PACKED-BED CONDITION ... 71
4.3. SPECIFIC SURFACE AREA OF GRANULAR ACTIVATED CARBON MEDIA ... 72
4.4. HYDRAULIC REGIME OF THE REACTOR ... 74
4.4.1. The tracer test ... 74
4.4.2. The internal recycle flow and concentration factor ... 76
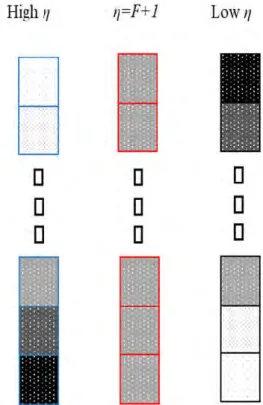
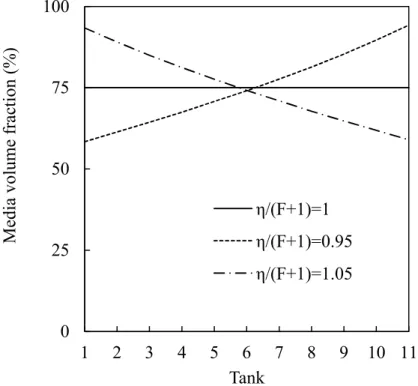
4.5. MODELING MEDIA DISTRIBUTION IN THE EXPANDED-BED... 78
4.5.1. Calibration of internal recycle flow and media concentration factor ... 78
4.5.2. Media distribution in the expanded-bed ... 78
4.5.3. The biomass distribution in the expanded-bed ... 80
4.6. CONCLUSIONS ... 82
CHAPTER 5. COMBINED BIOFILM AND BIOLOGICAL MODEL OF A NITRIFYING EXPANDED-BED REACTOR FOR AMMONIA AND ORGANICS REMOVALS ... 83
5.2. MATERIALS AND METHODS ... 87
5.2.1. Monitoring campaigns for the lab-, pilot- and full-scale reactors ... 87
5.2.2. Analytical procedures ... 90
5.3. RESULTS AND DISCUSSIONS ... 92
5.3.1. Detachment and amount of biomass in the lab-scale experiment... 92
5.3.2. Attachment, detachment and internal solids exchange of the field reactors... 93
5.3.3. Biological kinetic parameters of the biofilm in the nitrifying expanded-bed reactor ... 96
5.3.4. Graphical guidance on the reactor performance at variable influent and temperature ... 109
5.4. CONCLUSIONS ... 113
CHAPTER 6. SENSITIVITY ANALYSIS OF NUMERICAL CALCULATION AND OPERATIONAL PARAMETERS ON THE CALCULATION RESULTS .. 114
6.1. INTRODUCTION AND OBJECTIVES ... 115
6.2. CHARACTERIZATION OF THE INFLUENT COMPOSITION ... 117
6.3. OPTIMIZED PARAMETERS FOR REASONABLE CALCULATION RESULTS ... 122
6.3.1. Physical menu ... 122
6.3.2. Operational Menu ... 126
6.3.4. Kinetic Menu ... 131
6.4. SENSITIVITY ANALYSIS OF NUMERICAL CALCULATIONS TO THE CALCULATION RESULTS ... 132
6.4.1. Unstable convergence of steady-state simulation ... 132
6.4.2. Sensitivity analysis of the maximum biofilm thickness ... 133
CHAPTER 7. REMOVAL MECHANISMS OF PESTICIDES IN THE NITRIFYING EXPANDED-BED REACTOR ... 143
7.1. INTRODUCTION ... 144
7.2. MATERIALS AND METHODS ... 147
7.2.1. Monitoring campaigns for the full-scale and lab-scale reactor ... 147
7.2.2. Studied pesticides ... 148
7.2.3. Analytical procedures ... 150
7.3. RESULTS AND DISCUSSION ... 151
7.3.1. Pesticide removals in the full-scale reactor ... 151
7.3.2. Pesticide removals in the lab-scale reactor ... 155
7.4. CONCLUSIONS ... 163
CHAPTER 8. CONCLUSIONS AND RECOMMENDATIONS ... 164
8.1. MAIN FINDINGS OF THE RESEARCH ... 165
ANNEX ... 178
LIST OF PUBLICATIONS ... 214
LIST OF FIGURES
Figure 1. Principle emission sources of ammonium to water environment ... 7
Figure 2. The fraction of ammonium ion and free ammonia as a function of temperature and pH. ... 8
Figure 3. Typical sources and routes of micropollutants in the environment ... 12
Figure 4. The pathways of pesticides to the aquatic environment ... 15
Figure 5. Biofilm models development over the last 30 years ... 20
Figure 6. Interpretation of Breakpoint Chlorination Curve ... 27
Figure 7. Typical adsorbent materials for ammonium in water treatment ... 29
Figure 8. Conventional drinking water treatment process ... 33
Figure 9. Schematic of the metabolic and co-metabolic biotransformation strategies ... 36
Figure 10. External and internal transport of an adsorbate in activated carbon particle ... 38
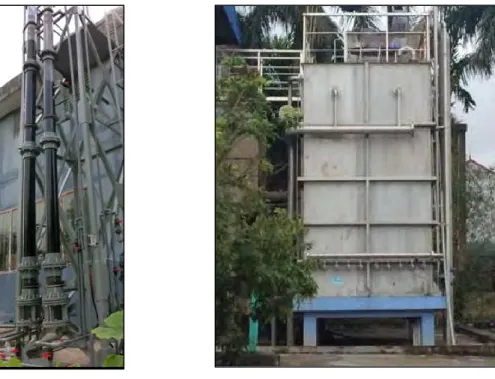
Figure 11. Lab-scale reactor at the University of Kitakyushu, Japan ... 47
Figure 12. Pilot-scale reactor in Hoa Phu WTP (left) and Full-scale reactor in Vinh Bao WTP (right) ... 47
Figure 13. Schematic illustration of the model concept ... 48
Figure 14. Illustration of biofilm processes in the expanded-bed reactor ... 50
Figure 15. Illustration of continuity checking approach ... 57
Figure 16. Determination of media fraction in packed-bed condition ... 71
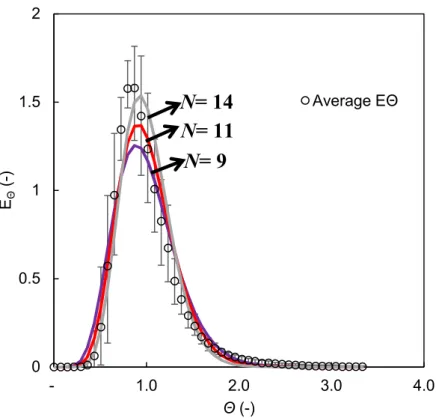
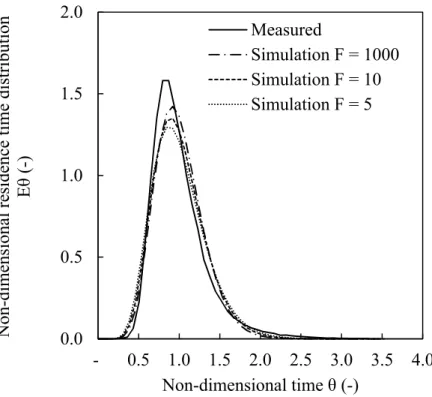
Figure 18. The particle size distribution of the granular activated carbon media ... 73 Figure 19. Tracer test experiment ... 75 Figure 20. Measured and simulated non-dimensional time distribution functions (Eθ) curves
of the tracer ... 76 Figure 21. Non-dimensional residence time distribution curves of tracer test ... 78 Figure 22. Illustration of the media distribution in the expanded-bed with different values of concentration factor ... 79 Figure 23. Media volume fraction distribution in the expanded-bed ... 80 Figure 24. Ordinary heterotrophic biomass distribution in the expanded-bed ... 81 Figure 25. Measured and simulated oxygen uptake batch experiment at different temperature ... 92 Figure 26. Ammonium removal and nitrite accumulation in the initial biofilm formation ... 93 Figure 27. Influent inert inorganic suspended solids and specific attachment rates (a), Estimated amount of biofilm and specific detachment rates (b). ... 94 Figure 28. Measured and simulated influent and effluent total suspended solids for attachment and detachment ... 95 Figure 29. Measured versus simulated outputs in the five datasets ... 102 Figure 30. Ammonium removal and nitrite accumulation due to low dissolved oxygen (Top: Lab-scale reactor in continuous operation, Bottom: Full-scale reactor in Vinh Bao (R)) ... 104
Figure 31. Estimation of the influent readily biodegradable substrate from dissolved oxygen consumption (Top: Full-scale reactor in Vinh Bao (R); Bottom: Pilot-scale reactor in Hoa Phu WTP) ... 106 Figure 32. Biomass fraction in steady-state operation ... 108 Figure 33. Impact of temperature on ammonium removal (Influent DO = 8 mgO2/L and
influent organic substrate = 0 and 5 mgCOD/L). ... 110 Figure 34. Dissolved oxygen requirement for variable influent ammonium and organic substrate at temperature 200C. ... 111 Figure 35. Dissolved oxygen requirement for variable influent ammonium and organic substrate at temperature 350C. ... 112 Figure 36. The model layout of an IFAS object on GPS-X software ... 116 Figure 37. Influent composition input and their cryptic names for IFAS object in CNLIB library ... 117 Figure 38. Relationship between composite and state variables in CNLIB ... 118 Figure 39. Illustration of soluble integration length and period over the simulation period ... 125 Figure 40. Influence of soluble integration length and period parameters to simulation results ... 126 Figure 41. The labels of IFAS object ... 127 Figure 42. Internal Flow Distribution menu ... 127 Figure 43. Definition of labels of Internal Flow Distribution sub-menu on the reactor .. 128 Figure 44. Mass transport menu ... 130
Figure 45. Kinetic menu ... 131 Figure 46. Biofilm thickness calculation ... 135 Figure 47. Impacts of max. biofilm thickness values to the particulates and active biomass concentration and calculated biofilm thickness ... 137 Figure 48. Impact of maximum biofilm thickness to the effluent dissolved oxygen and nitrite concentration ... 139 Figure 49. Impact of maximum biofilm thickness to the volumetric reaction rate ... 140 Figure 50. Influent and effluent dissolved oxygen (a) and ammonium (b) in the full-scale reactor ... 152 Figure 51. Influent and effluent pesticides and removal efficiencies in the full-scale reactor in the rainy season in Vinh Bao WTP ... 153 Figure 52. Influent and effluent dissolved oxygen (a) and ammonium (b) in the lab-scale reactor for pesticide removal monitoring ... 156 Figure 53. Influent and effluent pesticides and removal efficiencies in the lab-scale reactor ... 157 Figure 54. Ammonia concentrations in the batch experiments ... 158 Figure 55. Influent and effluent pesticides and removal efficiencies in the lab-scale reactor ... 160 Figure 56. Pesticide ratios after 4 hours of batch experiment with variations of ammonia and biological activated carbon weight ... 162
LIST OF TABLES
Table 1. Typical examples of chemical pesticides with their definition and applications 13
Table 2. Available simulators for biofilm models and wastewater treatment plants ... 21
Table 4. Classes of organic compounds adsorbed on activated carbon ... 39
Table 5. Comparison of original ASM1 model and the proposed model ... 57
Table 6. Peterson matrix on two-step-nitrification ... 59
Table 7. Process rate in Peterson matrix for two-step-nitrification ... 63
Table 8. Composition matrix of the proposed model ... 64
Table 9. Numerical stoichiometry of the Petersen matrix for two-step nitrification ... 65
Table 10. Continuity checking of the Petersen matrix for two-step nitrification model ... 67
Table 11. Summary of influent water quality and objectives of modeling ... 89
Table 12. Kinetic and stoichiometric parameters and mass transport for oligotrophic biofilm ... 97
Table 13. Influent concentrations for steady-state simulations ... 107
Table 14. List of monitored parameters and objectives of modeling ... 121
Table 15. Some physical properties of the reactors and their calculation formula ... 124
Table 16. Some physical characteristics of targeted pesticides and maximum allowable limits in drinking water regulations ... 149
Table 17 Statistical analysis for pesticide concentrations in triplicated batch experiment. ... 159
1.1. AMMONIUM OCCURRENCE AND THE NEED OF REMOVAL IN DRINKING WATER TREATMENT
At present, elevated concentrations of ammonium (NHx-N) are often encountered in
different surface water sources worldwide. NHx-N is considered one of the most critical
contaminants in freshwater due to its highly toxic nature and ubiquity in the water systems [1]. NHx-N of natural sources is mainly produced from the decomposition of organic
nitrogen, such as animal excrements and dead plants or animals. However, NHx-N of
anthropogenic sources are the primary factors contributing to freshwater degradation. In the industrial sectors, NHx-N is primarily used as the nitrogen source in fertilizers in
agriculture land, with direct application of anhydrous NHx-N being the largest method of
consumption [2]. To a lesser extent, NHx-N is also applied in various industrial activities,
such as plastics, cleaning products, explosives, animal feed, and food additives. In addition, the discharge of untreated domestic and industrial sewage and runoff from areas with intensive animal husbandry are also major sources of NHx-N in the environment [3]. The
principle emission sources of NHx-N to the water environment were illustrated in Figure 1.
The specific origins and fate of NHx-N could be identified by analyzing the stable N
isotopic compositions in water sources [4].
In water, NHx-N is presented in two chemical forms, in which the ammonium ion (NH4-N)
is more abundant than the unionized ammonia (NH3). The concentration of total ammonia,
denoted as NHx-N, is the sum of NH4-N and NH3 concentrations. The ratio of these species
depends on the pH and temperature of the aqueous solution, as shown in Figure 2. At the pH around 7 almost the total ammonia is presented as NH4-N; therefore, the term
ammonium is often adopted for this contaminant in water.
Figure 2. The fraction of ammonium ion and free ammonia as a function of temperature and pH [6].
Annually domestic wastewater released about 20 million tons of NHx-N into the
environment, occupying nearly 10% of the total world emission. The figure is projected to further increase to 35 million tons annually by the middle of 21st century [7]. Consequently, various studies have observed growing trends of NHx-N contaminants in water sources,
especially in developing countries. In Vietnam, the NHx-N concentrations in major rivers
were higher than 0.3 mgN/L, which is the national threshold for drinking water purposes. In particular, very high concentrations of NHx-N of 6.5mgN/L were monitored in Cau River
basin, where industrial wastewater was discharged without proper treatment [8]. In China, the NHx-N pollution issues in freshwater have drawn significant attention in the main river
basins such as Liao River, Yellow River, Songhua River, etc. For instance, the NHx-N
concentrations were ranged from 0.32 to 8.12 mgN/L in winter and 0.91 to 6.95 in summer in Liao River [9]. In another study carried out in Tongshun River, another large and important river in Jianghan Plain in China, the NHx-N concentrations were ranged from
0.07 to 10.25 mgN/L mainly due to the discharge of industrial and municipal wastes [4]. In Mongolia, a very high concentration of NHx-N reached 29.5 mgN/L was recorded in Tuurl
River in the North center of the country due to anthropogenic discharge sources [10]. The NHx-N pollutants in rivers and canals in and around Dhaka City, the capital and the largest
city of Bangladesh, were found to be varied from 6.35 to 34 mgN/L in 2008 and 2009, threatening the water supply source of Saidabad Water Treatment Plant.
Opposing pictures relating to NHx-N pollutants have been drawn in the countries where
adequate wastewater treatment facilities are in place. For example, over 21 years from 1992 to 2012, the average NHx-N concentration in European rivers was decreased by 0.231
mgN/L, which was equivalent to 3.5% per year thanks to implementing the Urban Waste Water Treatment Directive and national legislation [11]. In Canada, the NHx-N
concentrations were found to be lower than 0.1 mgN/L in surface water systems[12]. In Japan, the NHx-N concentrations met the Water Environment Quality Standard, in which
the allowable total nitrogen was ranged from 0.1 to 1 mgN/L, in almost all surface water monitoring sites [13][14]. These examples suggested that the NHx-N pollution situation in
the aquatic environment and supply drinking water sources could be remedied with appropriate integrated water resources management, in which the removal of NHx-N from
water sources played a critical role.
The presence of NHx-N at high concentrations in surface water ecosystems represented one
of the most harmful issues besides oxygen depletion. It could directly impact individual species, typically death, reduced growth rate, or reduced reproduction success. Indirect impacts are those that affect the ecosystem by changing the living conditions of organisms, for instance, eutrophication or acidification [2],[9]. Therefore, the ecology risks assessment caused by NH -N has been carried out worldwide. In Liao River in China, the acute and
chronic water quality criteria of NHx-N based on the toxicity of the Liao River species were
found to be 16.86 and 4.39 mgN/L. In Korea, an acute predicted no effect concentration value of 22 mgN/L for NHx-N was proposed based on short-term toxicity data of Korean
native aquatic species. In the USA, the acute and chronic criteria of 17 and 1.9 mgN/L were updated since 2013 for NHx-N water quality criteria [9]. As for human health, the NHx-N
in potable water is not of significant concern because of its lower concentration than the human capacity to detoxify [15]. Therefore the World Health Organization does not provide health-based guideline value for NHx-N [16]. However, the presence of NHx-N might
induce objectionable taste and odor; therefore, its maximum concentration is regulated in several drinking water standards, such as 0.3 mgN/L in Vietnamese QCVN01-1:2008/BYT [17].
The elevated concentrations of NHx-N at the supply drinking water sources are of particular
concern for the operators of drinking water treatment plants (WTP). In biological nitrification, NHx-N will be decomposed into an intermediate nitrite (NO2-N) and final
product nitrate (NO3-N). In some countries, NO2-N and NO3-N are regulated at strict values.
For instance, Japan requests 0.04 mgN/L as NO2-N and 10 mgN/L for total NO2-N and
NO3-N, while Vietnam requires 0.05 mgN/L as NO2-N and 2 mgN/L as NO3-N. Because
the formation of NO2-N and NO3-N indicates the loss of NHx-N following a ratio of 1:1:1,
their regulated values could be used as a secondary drinking water standard for NHx-N [18].
In particular, when chlorination disinfection is applied in the water treatment process, a large amount of chlorine would be needed to remove the NHx-N. A dose of 8 – 10
mgCl2/mgNHx-N is often recommended to reach the chlorination breakpoint and obtain the
free chlorine residual [19]. Therefore, high influent NHx-N is directly engaged to the
increase in the operational costs. Additionally, in case that the influent dissolved oxygen (DO) is limited, the incomplete removal of NHx-N may result in the accumulation of NO2
-N in the system. The high concentration of -NO2-N in tap water can cause
methemoglobinemia in infants [20]. Consequently, more chlorine should be dosed to oxidize the generated NO2-N.
Therefore, effective technologies to remove NHx-N from water have been extensively
1.2. MICROPOLLUTANT OCCURRENCE AND THE NEED OF REMOVAL IN DRINKING WATER TREATMENT
In addition to the NHx-N contaminants, the micropollutants are of critical concern in the
degradation of freshwater quality. As indicated in Figure 3, the surface and groundwater are being degraded by various due to multiple human activities.
Figure 3. Typical sources and routes of micropollutants in the environment [21]
The release of effluent from wastewater treatment plants to the aquatic environment contributes significantly to the increasing concentrations of contaminants of emerging concern (CECs) in surface water. Those wastewaters originated from domestic, industrial, and hospitals [21]. In developed countries, a high portion of generated wastewater is treated adequately to reduce the harmful effects. However, the discharge of untreated sewage to water bodies occurs in many regions of the world, representing a severe concern to public health and the ecosystem. Conventional wastewater treatment plants were not designed for dealing with these CECs; therefore, they could only be removed to a certain extend. Other
sources of CECs are the leakages from landfills, septic tanks, etc. Additionally, the management of industrial effluents from the production sectors of pharmaceuticals, personal care products, pesticides, and other compounds are not handled properly in some places, which increases the appearance of CECs in water. The runoffs from agriculture and livestock areas are also essential sources of micropollutants [21].
In this study, the concurrence of pesticides in water supply sources was focused. Pesticides are one of the few toxic substances released deliberately into the environment to kill living organisms. Although the term pesticide is often misunderstood to refer only to insecticides, it is also applicable to herbicides, fungicides, and various other substances used to control pests [22]. Several hundred pesticides of different chemical compositions are currently used for agricultural and vector control purposes worldwide [23]. Newer pesticides that are more selective and less toxic to humans and the environment, which require fewer application dosages, are in the trend in developed countries. Meanwhile, significant use of older broad-spectrum pesticides continues in many parts of the world. It was suggested that the mobilization of nutrients might have been surpassed the thresholds that will cause dramatic changes in continental-to-planetary-scale systems, including the pollution of ground and surface waters [24].
The most common way to classify the pesticides is based on their chemical structure, in which the pesticides are divided into four main groups as follows.
Table 1. Typical examples of chemical pesticides with their definition and applications [25]
Pesticide group Definition and applications
Organochlorines Stable compounds are too persistent in the environment and tend to accumulate in fatty tissue. Its primary use is in the eradication of disease vectors such as malaria, dengue, and malaria. They are also used in the cultivation of grapes, lettuce, tomato, alfalfa, corn, rice, sorghum, cotton, and wood, for preservation. Its way of
Pesticide group Definition and applications
exposure is mainly on insects by contact or by ingestion
Organophosphates They are esters derived from phosphoric acid. Organophosphorus compounds are most commonly used in agriculture; most are insecticides and miticides. Their way of joining these organizations is by ingestion and contact. They are used in vegetable crops, fruit trees, grains, cotton, sugarcane, among many others.
Carbamates They are esters derived from acids or dimethyl N-methyl carbamic acid are used as insecticides, herbicides, fungicides, and nematicides. They are less persistent than organochlorines and organophosphates, and likewise, the latter inhibit acetylcholinesterase
Pyrethroids They originate from natural insecticides derived from pyrethrum extract derived from chrysanthemum flowers, known as pyrethrins.
Others Other pesticides are triazine herbicides, ureic, hormonal, amides, nitro compounds, benzimidazoles, ftalamidas, bipyridyl compounds, ethylene dibromide, sulfur-containing compounds, copper or mercury, etc.
The presence of pesticides in surface waters has been reported in many regions in the world, such as in Malaysia, Chile, Canada, India, Japan, Greece, Brazil, China, and Vietnam [26]–[34]. Different stages in which pesticides could reach the aquatic environment are illustrated in Figure 4. Pesticide contaminants in surface water are often generated from diffused pollution sources, such as runoff, leaching, and chemical spilling from agricultural zones.
Figure 4. The pathways of pesticides to the aquatic environment [29]
As pesticides are designed to be toxic to particular groups of organisms, they can have considerable adverse environmental effects on other living creatures as well as diverse media, including air, soil, or water [25]. The hazardous effects of pesticides on human health by direct exposures have been well documented in [22], [29]. However, pesticides in drinking water are often of trace levels; hence the concern is primarily for their potential for causing chronic health problems. To the best of our knowledge, there is no scientific publication on the non-carcinogenic health risk, defined as the pesticide thresholds below which the effect does not occur, due to the human ingestion of pesticides in the finished water from WTPs [26]. The studies on the chronic exposure of pesticides were often based on laboratory animals for the measurement of incidence of cancer, birth defects, genetic mutations, or other problems such as damage to the liver or central nervous system. The information were interpreted in the context of its potential hazard under actual field conditions, providing the health-based data for the policy makers [35].
The drinking water guidelines are aimed at keeping pesticides at levels below those that are considered to cause any health effects in humans [35]. In 2017, the World Health
drinking water, which were of health significance [16]. In Europe, a proposal for a revised drinking water directive has been adopted since 2018, in which a maximum concentration of 0.1 μg/L for individual pesticide and 0.5 μg/L for total pesticides were regulated [36]. In the United States, the Environmental Protection Agency has identified 18 types of pesticides and herbicides with their maximum contaminant levels and potential health effects from long-term exposure in the National Primary Drinking Water Regulations [37]. In Japan, pesticides were not listed in the Drinking Water Standards but referred to the category of “Complimentary Items to Set the Target for Water Quality Management” [38]. In Vietnam, the Ministry of Health has recently listed 27 pesticides with their maximum limits in the National Technical Regulation on Drinking Water Quality (QCVN01-1:2018/BTY) [17].
Therefore, effective technologies to remove the pesticides from drinking water sources are beneficial to improve the finished water quality and fulfill the drinking water standards.
1.3. INTRODUCTION ON GRANULAR ACTIVATED CARBON AND APPLICATION IN WATER TREATMENT
Activated carbon (AC) is produced from rich-carbonaceous precursors, such as wood, coal, coke etc., via two main processes, which are thermal activation and chemical activation. Thermally activated carbon has high reactivity towards oxygen, which can induce catalytic reaction to convert the nonbiodegradable substances into biodegradable ones. On the other hand, chemically activated carbon showed better desorbability than thermally AC and resulted in enhanced adsorption capacity of AC for nonbiodegradable compounds. Therefore, the selection of AC types significantly affected the treatment performance purposes and could help to extend the service life of AC [39].
AC is manufactured in three main forms of powder AC (PAC), granular AC (GAC) and pelletized AC, which are differentiated by the particle size. GAC is more often adopted in water treatment due to its cost-effectiveness in continuous and extensive scale-systems. Typically, GAC's effective sizes in water treatment ranged from 0.5 to 0.7 mm, and 0.8 to 1 mm [40]. The pore size distribution of GAC significantly affects its specific surface area and adsorption capacity. The pore diameters could be categorized as primary micropores (<0.8 nm), secondary micropores (0.8-2 nm), mesopores (2 – 50 nm), and macropores (>50 nm) [41]. GAC' irregular crevices and porous particle shape offer an extremely high number of adsorption sites for the adsorption of various water contaminants.
GAC was firstly used in drinking water treatment in the late 1920s to remove the taste and odor in finished water. The undesirable taste and odor in drinking water were mainly attributed to the presence of chlorophenol formed in water as a result of the chlorination of phenols at the disinfection stage. Currently, problems in drinking water treatment extend beyond the scope of taste and odor control [42]. CECs appear to be one of the most problematic issues as the quality of drinking water supply sources is gradually degraded. Additionally to the GAC adsorption, which has been employed for decades, the biological activated carbon (BAC) process, which uses exhausted GAC media for microbial
biodegrade a wide variety of contaminants such as organic carbon, organic/inorganic substances, and disinfection by-products precursors [39], [43], [44]. Detailed on AC’s technologies adopted in water treatment will be presented in section 2.3.
1.4. BIOFILM MODEL IN ACTIVATED SLUDGE MODEL (ASM1)
The development and application of the International Water Association (IWA) Activated Sludge Models (ASMs) have created fruitful transformation and achievement in water and wastewater treatment research and practice. The models offer efficient means to combine the knowledge of science, engineering, and practice into an executable tool. The design criteria of a model are to keep the complexity as low as possible while encompassing crucial components and processes. Their application progress relies on the continuous accumulation of successful and failure experiences. Additionally, their widespread application has created a common language between the researchers and practitioners [45], which pave the way for further model development and improvement.
While the mathematical model of suspended-growth processes has been soundly investigated in various publications [46]–[48], the model of biofilm-based processes is more complicated due to increased complexity in describing the fate of wastewater constituents (i.e. particulate versus soluble substrate), differences in biofilm reactor configuration and operation, the impact of bulk-liquid hydrodynamics, and diffusional biofilm resistances. Over the last 30 years, the biofilm models have become more complex and more computationally intensive [49], with the model resolutions range from 1-dimension (1-D) to 3-1-dimension (3-D), as indicated in Figure 5. A 1-D model allows property gradients in one direction, usually over the biofilm depth, i.e., from the bulk liquid to the substratum. Meanwhile, the 2-D and 3-D models are needed to reproduce complex spatial distributions of the components, complex biofilm geometries, etc. [50]; however, they also demand heavy computing resources and deep programming expertise [45]. The 1-D model can capture the dominant processes of microbial reactions and mass transport [45]; therefore, it has been widely adopted in water treatment engineering,
At present, different process simulators are offered for biofilm modeling, as listed in Table 2. Among the available simulators, the GPS-X software was selected for the biofilm model in this study.
Table 2. Available simulators for biofilm models and wastewater treatment plants [51]
Name Source Model type and biomass
distribution* AQUASIM EAWAG, Swiss Federal Institute of
Aquatic Science and Technology, Du¨ bendorf, Switzerland
(www.eawag.ch/index_EN)
1-D, DY, N; Heterogeneous
AQUIFAS Aquaregen, Mountain View, California (www.aquifas.com)
1-D, SE, N, Heterogeneous
BioWin EnviroSim Associates Ltd., Flamborough, Canada (www.envirosim.com)
1-D, DY, N, Heterogeneous 1-D,
GPS-X Hydromantis, Inc., Hamilton, Canada (www.hydromantis.com)
1-D, DY, N, Heterogeneous 1-D,
Pro2D CH2M HILL, Inc., Englewood, Colorado (www.ch2m.com/corporate)
1-D, SS, N(A), Homogeneous
Simba ifak GmbH, Magdeburg, Germany (www.ifak-system.com)
1-D, DY, N, Heterogeneous
STOAT WRc, Wiltshire, England
(www.wateronline.com/storefronts/ wrcgroup.html)
1-D, DY, N, Heterogeneous
WEST MOSTforWATER, Kortrijk, Belgium (www.mostforwater.com)
1-D, DY, N(A)
* Note: SS = steady-state, DY = dynamic, SE = semi-empirical, N = numerical, and N(A) = numerical using analytical solutions.
1.5. DISSERTATION STRUCTURE
The dissertation is organized into nine chapters. Each chapter focused on a specific objective as briefly introduced below:
In Chapter 1, the occurrences of ammonium and micropollutants were reported with their harmful effects on public health and the aquatic system. The granular activated carbon offered the capacity of adsorption and biodegradation that could respond to the treatment purpose. The mathematical biofilm model could provide insights on the biological reactions and mass transport processes that occurred in the attached-growth-process systems.
In Chapter 2, the existing technologies to remove ammonium and micropollutants in drinking water treatment were documented together with their advantages and limitations. The nitrifying expanded-bed reactor using biological activated carbon media appeared to be a promising alternative to respond to the treatment request.
In Chapter 3, a model concept used to simulate the nitrifying expanded-bed reactor was presented. The principles of biofilm and biological models on the platform of Activated Sludge Model 1 (ASM1) were summarized. A combined model with two-step-nitrification was proposed to simulate the nitrifying expanded-bed reactor.
In Chapter 4, a physical model was developed to identify the physical boundaries in which the biological reactions occurred. An internal recycle flow with media was first introduced to simulate the even distribution and moving of media within the expanded-bed.
In Chapter 5, an incorporated physical, biofilm, and biological model was applied to simulate the ammonium and organics removals of the nitrifying expanded-bed reactor on five different datasets of lab-, pilot- and full-scale reactors. A single set of kinetic and stoichiometric parameters were proposed for the oligotrophic heterotrophs and autotrophs. The complex biofilm attachment and detachment were investigated. The reactor performance was also studied under variation of influent water quality and temperature. In Chapter 6, a sensitivity analysis of the numerical calculation and operational parameters
on the calculation results of the Integrated Fixed-film Activated Sludge (IFAS) object was carried out.
In Chapter 7, the possibility of the nitrifying expanded-bed reactor to remove the pesticides were investigated. The removal mechanisms of the pesticides in drinking water biofilm were revealed by the continuous and batch experiments on the full- and lab-scale reactors. In Chapter 8, a summary of the key findings was provided. The recommendations for further studies were also discussed.
2.1. REMOVAL OF AMMONIUM IN WATER TREATMENT
Due to the harmful effects of NHx-N on the aquatic ecosystem, intensive studies have been
carried out to remove NHx-N from water. Various processes have been used for NHx-N
removal from wastewater, such as air/steam stripping, vacuum distillation, chemical precipitation as struvite, membrane filtration, etc. [6]; however, those which are frequently used in drinking water treatment will be focused in this study. In the following sections, a review of these processes with their advantages and limitations will be summarized. 2.1.1. Physico-chemical technologies
2.1.1.1. Breakpoint chlorination
Breakpoint chlorination is a well-known method that has been applied for decades for the removal of NHx-N. In this section, the chemistry of chlorine in water treatment will be
presented [52].
Chlorine is often added to water under gaseous or liquid forms of sodium or calcium hypochlorite. These substances are rapidly hydrolyzed to hypochlorous acid according to the following equations:
Cl2 + H2O → HOCl + H+ + Cl- Eq (1)
Ca(OCl)2 + 2H2O → Ca2+ + 2HOCl + 2OH- Eq (2)
NaOCl + H2O → Na+ + HOCl + OH- Eq (3)
The two chemical species formed by chlorine in water, hypochlorous acid (HOCl) and hypochlorite ion (OCl-) are commonly referred to as free available chlorine. Hypochlorous acid is a weak acid and will disassociate to H+ and OCl-. In waters with a pH between 6.5 and 8.5, the reaction is incomplete, and both species (HOCl and OCl-) will be present. As a relatively strong oxidizing agent, chlorine can react with a wide variety of compounds. As indicated in Figure 6, after adding chlorine to the water, the following processes will
happen [18] :
Zone 1: Initial chlorine demand is caused by reducing agents (Fe+2, Mn+2, H 2S,
NO2–) that consume most of the chlorine applied prior to forming combined
residuals.
Zone 2: Additional chlorine combines with available total ammonia and reactive organics until forming maximum monochloramine residual. At the same time, uncombined free NH3 is being depleted until it reaches zero [52]:
NH3 + HOCl → NH2Cl (monochloramine)+ H2O Eq (4)
Zone 3: More chlorine dosage converts monochloramine into odorous dichloramine and nitrogen trichloride. Total combined chloramine residual decreases, and total NHx-N concentration approaches zero at the breakpoint.
NH2Cl + HOCl → NHCl2 (dichloramine)+ H2O Eq (5)
NHCl2 + HOCl → NCl3 (trichloramine) + H2O Eq (6)
Zone 4: True free chlorine residual is obtained and provides the least nuisance odor when free residuals make up 85 % of the total chlorine concentration. Nuisance combined chlorine residuals survive, and the potential for disinfection by-products (trihalomethane and haloacetic acid) formation remains as free chlorine residual develops further. Continuous adding of chlorine after the breakpoint will convert trichloramine to nitrogen gas. The overall reaction for chlorination breakpoint is given as:
Figure 6. Interpretation of Breakpoint Chlorination Curve [18]
The free chlorine residual concentration is regulated in drinking water standards as an indicator for sufficient disinfection, targeting pathogen killing
As shown in Eq (7), the amount of chlorine to entirely oxidize NHx-N is stoichiometrically
7.6 mgCl2 to 1 mgNHx-N. However, in practice, a dose of 8 – 10 mgCl2/mgNHx-N is often
recommended to reach the chlorination breakpoint and obtain the free chlorine residual [19]. The chlorination breakpoint for NHx-N is a simple and well-established technique.
However, in the case of high NHx-N concentrations, an increased dose of chlorine would
be needed to fully oxidize such an amount, leading to high chemical reagent costs. Further, the side-effects of chlorination, such as unpleasant taste and odor, or the formation of harmful and carcinogenic disinfection by-products should be considered.
2.1.1.2. Adsorption
Adsorption is a process in which the substances are accumulated or concentrated at a surface or interface. In water treatment, the removal of NHx-N often occurs between the
NHx-N for the particular solid adsorbents rather than the solvent disliking character. The
adsorption is induced by van der Waals attraction or chemical interaction of NHx-N with
the adsorbent [53]. Hence, the efficiency of the adsorption process depends mainly on selecting suitable adsorbent media. Additionally, recent studies also highlighted the importance of other operational parameters, such as adsorbent dosage, pH, contact time, and coexisting ions [7].
The adsorption of NHx-N onto solid media provided many advantages, including high
removal efficiency, simple operation, and low energy consumption. It is suitable for a wide range of NHx-N concentrations from low-strength categories, such as in fish pond water (~
10 mgN/L), domestic wastewater (~ 40 – 60 mgN/L) to very high NHx-N loadings in
landfill leachate (~ 100 – 1000 mgN/L) [7]. However, adsorption could not be used in the water pretreatment with high influent suspended solids (maximum tolerance of 20 mg/L) due to the blockages or pressure loss [54]. The major limitation of adsorption pertains to the saturation or exhaustion of adsorbent materials in which the breakthrough and exhausted points are reached. Regeneration of adsorbents is needed, including chemical washing, biological regeneration, electrochemical regeneration, mild heating, or electric field [7].
Numerous adsorbents have been studied so far for the adsorption of NHx-N in water
treatment. They could be roughly categorized as conventional materials such as clay and carbonaceous matters, or nanostructured materials such as metal-organic frameworks, as shown in Figure 7. The conventional adsorbents are abundant and cost-effective; however, their bindings with NHx-N are relatively weak. The new materials, such as nanostructured
materials, provides high adsorption capacity and rapid adsorption kinetics; however, they require expensive precursors, tedious preparation, and uncertainty [7]. Additionally, the adsorbents prepared from agricultural wastes or residues, such as strawberry leaf powder, were also studied intensively due to their abundance and cheap price [54]
Figure 7. Typical adsorbent materials for ammonium in water treatment [7]
Among those adsorbents, activated carbon is considered a versatile material due to high specific surface area, porous structure, and rich surface chemistry. However, the bindings between activated carbon and NHx-N are relatively weak due to the lacking of sufficient
surface acidity. Further, it should be noted that the average pore size of activated carbon is much higher than that of NHx-N molecule of 0.3 nm. Therefore, activated carbon is a less
effective adsorbent for NHx-N [7].
2.1.1.3. Ion exchange process
The ion exchange process consists of reversible chemical reactions in which dissolved ions in a solution are replaced with other similar charged ions [54]. In the case of removing NHx-N from water, a cation exchanger using zeolitic minerals such as clinoptilolite,
sepiolite, betonite, and mordenite, is commonly applied.
In the conventional design, the ion exchange column consists of zeolite particles in the packed-bed through which the influent is tricked until a specific NHx-N breakthrough
-N concentration and is responsive to -NHx-N shock loading. However, significant use of
chemical regenerants and rinse water are required to restore and reuse of the exchange column, leading to high operational costs. Further, at least one duplicate column is needed to maintain the continuous operation [54], [55].
Most of the studies on the ion exchange process investigated the primary treatment of wastewater containing high NHx-N loading. Focusing on the low-strength NHx-N
concentrations from 2 to 10 mgN/L, research was carried out using several zeolites of Na-form, such as Na-mordenite, Na-ferrierite, NaZSM-5, Na-Y, and Na-β [56]. The result demonstrated that Na-modernite was an efficient cation-exchanger for the removal of low NHx-N concentration comparing to the remaining materials. The NHx-N uptake on
Na-modernite was neither impacted by the temperature at the range of 278 to 333 K, nor the presence of coexistent K+ and Na+ in water. However, the presence of Ca2+ and Mg2+ significantly reduced the NHx-N uptake.
2.1.2. Biological technologies
Aerobic nitrification consists of two-step microbial processes. In the first step, NHx-N will
be oxidized to NO2-N by ammonium-oxidizing organisms (AOO) following the equation:
2NH4+ + 3 O2 = 2 NO2- + 4H+ + 2H2O Eq (8)
In the subsequent step, NO2-N will be converted into NO3-N by nitrite-oxidizing organisms
(NOO) following the equation:
2 NO2- + O2 = 2 NO3- Eq (9)
The global nitrification reaction is given as follows:
NH4+ + 2 O2 = NO3- + 2H+ + H2O Eq (10)
mgO2 per 1 mgN, respectively. As nitrifying bacteria are obligate aerobes, the dissolved
oxygen (DO) concentration is one of the decisive factors that control the process performance.
On the other hand, NHx-N can be reduced anaerobically by anammox bacteria following
the equation:
NH4+ + NO2 = N2 + 2H2O Eq (11)
When dealing with high NHx-N concentrations as in wastewater treatment, various
technologies have been developed using biological nitrification process, such as anaerobic ammonia oxidation (ANAMMOX), completely autotrophic nitrogen removal over nitrite (CANON), single reactor high activity ammonia removal over nitrite (SHARON), Oxygen-limited nitrification and denitrification (OLAND), “NOX process”, and “aerobic de-ammonification process” [54]. However, these techniques are not in the scope of study and will not be further discussed.
In the drinking water sources where the substrates for microorganism growth are very limited, the oligotrophic bacteria with very low half-saturation coefficients (KS) [57], [58]
such as AOO/NOO are favored. In this regard rather than ordinary heterotrophic organisms (OHO), nitrifiers are known to be sensitive to various environmental factors [59]. Their growth on the carrier might provide a more hospitable environment [60] and nitrifying biomass concentration in the reactor could be significantly increased. Therefore, most of the nitrifying reactors applied in drinking water treatment were of the attached-growth process and are referred to as “biologically active filter” or “biofilter” due to filtration capacity, with variation in the flow direction. Down-flow biofilters were widely used due to their simplicity. However, the high head loss, or uneven distribution of biomass in the bed, and the possible leakages of bacteria-attached particles were the main disadvantages that limited their acceptance in practice [61]. The up-flow or expanded-bed biofilters were proposed to overcome such limitations. In the expanded-bed biofilter, better contact of
water influent and the biomass was maintained in the whole fluidized bed, and bed clogging was reduced due to limited capture of suspended solids particles [62]. In this study, the performance of an expanded-bed nitrifying reactor to remove NHx-N and micropollutants
from the water was investigate.
However, unlike biological wastewater treatment systems, DO competition between nitrifiers and heterotrophs, and each reaction rate in low-strength influent have not been well formulated. Hence, at present, it is difficult to calculate the removable NHx-N and
organic substrates and possible NO2-N accumulation in the pretreatment of WTPs.
Additionally, there is little information regarding the kinetic and stoichiometric parameters of the AOO/NOO/OHO in drinking water treatment, which might be considerably different from those applied in wastewater treatment.
The most significant advantage of the conventional nitrification process is the low-cost requirement. However, the bio-conversion process is low, and a long start-up period is needed before initiating the treatment [54]. Further, nitrifying bacteria are susceptible to environmental changes, such as DO, substrates, pH, temperature, etc, and are easily outcompeted by the heterotrophs in the presence of organic substrates. Therefore, the biological nitrification process is not responsive to influent variations.
2.2. REMOVAL OF MICROPOLLUTANTS IN WATER TREATMENT
The conventional drinking water treatment process consists of coagulation, flocculation, sedimentation, filtration, and disinfection, as shown in Figure 8. Additionally, some other processes, such as advanced oxidation, adsorption onto activated carbon, or biofiltration, could also be used for micropollutant removals.
Figure 8. Conventional drinking water treatment process
The removal of micropollutants in WTPs depends on various factors, such as configurations of systems, operation schedules, treatment conditions, and influent loadings in the influent source. The removal mechanisms of micropollutants in each treatment process should be studied at both field conditions in WTPs and laboratory-controlled conditions [63].
In this section, the micropollutant removal efficiencies in each process of WTPs will be discussed.
2.2.1. Physico-chemical technologies
2.2.1.1. Coagulation – Flocculation – Sedimentation
The coagulant, flocculation, and sedimentation are subsequent processes to remove colloidal and suspended solids particles from water. Opposing viewpoints have been raised regarding the removal efficiencies of micropollutants in these processes. On the one hand, some researchers investigated the removals of pharmaceutical substances in the coagulation process, and the removal efficiencies reported were ranged from 8 to 30% [64], [65]. On
the other hand, others demonstrated that their removals obtained in the coagulation stage was not only by coagulation itself. In fact, it was reported that adsorption to the particles, direct sunlight photolysis, and hydrolysis are the main micropollutant removal mechanisms that operate during the coagulation process in a WTP. A broad range of removal efficiencies from 9 to 100% was observed when the turbidity of influent water was higher than 10 NTU [63].
2.2.1.2. Sand filtration
The sand filtration is designed to remove the remaining residual particles from the sedimentation process. Previous studies suggested that adsorption can be the dominant mechanism in accordance with the hydrophobicity of the compound during sand filtration. It was reported that compounds with logKow less than 1 had lower removal efficiencies
(<50%) while hydrophobic compounds with log Kow higher than 2.5 had higher removal
efficiencies (>80%). Hydrophobicity is a controlling factor in the removal of micropollutants during the sand filtration stage. However, some micropollutants, even with log Kow higher than 2.5, showed inefficient reductions during the filtration stage and
sometimes negative removal efficiencies. Negative removal during sand filtration can be explained by the timing differences or desorption of accumulated pollutants in the filter bed. The filter bed could only temporarily capture the micropollutants by partitioning during filtration [63].
2.2.1.3. Advanced oxidation and disinfection
Depending on the quality of the source water as well as on the requirements of the finished drinking water, drinking water treatment is often completed with one or more final polishing steps prior to distribution. Disinfection and oxidation processes are often employed to stabilize the biological quality of the finished water, remove color and odor, or to inactivate pathogens. These processes rely on the addition of either chemical oxidants such as hydrogen peroxide, free chlorine, chloramines, or ozone or UV radiation. The chlorination was previously presented in section 2.1.1.1. Ozonation or other advanced
oxidation techniques (e.g., combining ozonation with hydrogen peroxide and/or UV radiation to produce a high yield of reactive hydroxyl radicals) are popular alternatives to chlorination. However, both techniques have been shown to create a variety of persistent oxidation products that may have equal or more significant toxicity as the parent chemical [66].
2.2.1.4. Adsorption onto granular activated carbon
The adsorption onto granular activated carbon process is presented in detail in 2.3.1. 2.2.2. Biological technologies
Based on the above background, it was shown that the contribution of conventional drinking water treatment process to micropollutant removals was rather limited and uncertain. Some techniques might be useful in removing these compounds, such as adsorption onto activated carbon, however expensive operational costs are needed [66]. In this regard, the biotransformation approach emerges as a cost-effective and sustainable alternative targeting the persistent chemicals in drinking water sources.
In biological technologies, single strains or microbial consortia that have the ability to degrade or mineralize target micropollutants partially were employed [66]. Their metabolic and co-metabolic strategies were illustrated as follows:
Figure 9. Schematic of the metabolic and co-metabolic biotransformation strategies [66]
In the metabolic strategy, microorganisms interact with target micropollutants in growth-linked processes that result in the mineralization of the micropollutants. In the co-metabolic strategy, microorganisms interact with non-target micropollutants in biochemical processes that result in the formation of oxidized metabolites. These oxidized metabolites can then be used as primary for heterotrophic members of the population [66].
As mentioned above, the raw drinking water sources are of oligotrophic conditions where the substrates are found at trace levels. Their concentrations are very low compared to that of the primary substrates; therefore, cometabolic might be the degradation pathway [67].
The attached-growth process was often adopted with various kinds of carriers, such as sand, activated carbon or anthracite. Several studies have reported the possibility of removing micropollutants using biologically active filters with varying removal efficiencies depending on the characteristics of micropollutants [61], [67]–[70]. Empty bed contact time, pH and DO, backwashing regime are among the parameters that influence the performance of biologically active filters [39]. Additionally, the association between nitrification rate and micropollutant removals has been documented in nitrifying activated sludge systems of wastewater treatment [71]–[74]. Nevertheless, there is still questionable if the nitrifying biofilms could remove the pesticides in drinking water treatment. The pesticide removals using biological activated carbon process were reported in [75], [70], [76], [77], in which the removal mechanism was thought to be simultaneous adsorption and biodegradation. However, because the removal mechanism is affected by various factors such as configurations of systems, operating conditions, and influent loadings in influent water, the examination and comparison should be carried out to reveal the removal pathways [63].
2.3. APPPLICATION OF ACTIVATED CARBON IN DRINKING WATER TREATMENT
2.3.1. Adsorption onto granular activated carbon process
Adsorption is considered to be an important phenomenon in most natural physical, biological, and chemical processes, and GAC is the most widely used adsorbent material in water treatment. In GAC adsorption process, the adsorption occurs between two phases, which are the GAC adsorbent in solid and the adsorbate compounds in liquid. In an adsorption system, equilibrium is established between the adsorbent and the adsorbate in the bulk phase. The transport mechanisms consist of four stages, including the bulk solution transport, external diffusion, internal diffusion, and adsorption, as illustrated in Figure 10 [53]:
Figure 10. External and internal transport of an adsorbate in activated carbon particle [53]
The irregular and porous shape of GAC provides an extensive network of adsorption sites. Various studies have focused on the ranges of pollutants that can be adsorbed onto the GAC surface, as shown in Table 3.
Table 3. Classes of organic compounds adsorbed on activated carbon [42]
Organic chemical class Examples
Aromatics Benzene, Toluene, Ethylbenzene, Xylene
Polynuclear Aromatics Naphthalene, Anthracenes, Biphenyls Chlorinated Aromatics Chlorobenzene, Polychlorinated biphenyls
Phenolics Phenol, Cresol, Chlorophenols, Nitrophenols
High-molecular-weight hydrocarbons Gasoline, Kerosene
Chlorinated aliphatics Trichloroethylene, Carbon tetrachloride Aliphatic and aromatic acids Tar acids, Benzoic acids
Ketones, esters, ethers, and alcohols Hydroquinone, Polyethylene glycol
Surfactants Alkyl benzene sulfonates
Soluble organic dyes Methylene blue, Indigo carmine
The factors affecting the adsorption capacity are as follows [41], [42]:
Specific surface area of GAC: which is proportional to the extent of adsorption, Physical and chemical properties of the adsorbate: the adsorbability of a compound
increases with increasing molecular weight and increasing number of functional groups such as double bonds or halogens. Additionally, hydrophobic and non-polar molecules adsorb better on GAC,
Temperature: The extent of adsorption should increase with decreasing temperature because the adsorption reactions are exothermic. However, increased temperature also increases the rate of diffusion of the solute through the liquid to the adsorption sites, which eventually leads to increased adsorption,
Porosity of GAC: The adsorption performance is dependent on the condition of internal surface accessibility, defined as the pore size distribution,
Chemical Surface Characteristics of GAC: depends on their heteroatom content (oxygen, sulfur, and nitrogen), and mainly on their oxygen complex content. Heteroatoms are brought during the activation, providing charged groups with stronger valence forces in the carbon structure at which chemisorption may occur. Adsorption on GAC process has been used for decades due to its effectiveness and simplicity. Additionally, the adsorption process does not add undesirable by-products to drinking water [41]. However, the main limitation of GAC adsorption pertains to its saturation and exhaustion over time. In this regard, regeneration or frequent dosing is needed to reuse the materials, leading to high operational costs.
2.3.2. Biological activated carbon process
The introduction of the biological activated carbon (BAC) process could overcome the limitation of GAC adsorption. This process uses GAC as filtration media to physically remove undesired matters. As the GAC media is gradually exhausted, microbial colonization is developed on the surface of the media [43]. This naturally occurring biofilm can biodegrade a wide variety of contaminants such as organic carbon, organic/inorganic substances, and disinfection by-products precursors [39], [43], [44]. Among the targeting contaminants, organic micropollutants and NHx-N are of top concerns for WTP operators,
and their removal efficiencies in the BAC process needed to be investigated.
The macro-porous structure and irregular surface of GACs are suitable sites for bacterial attachment, providing good protection from shear stress. Meanwhile, microporous GACs may not be adequate for microorganisms penetration due to because of their larger size
![Figure 2. The fraction of ammonium ion and free ammonia as a function of temperature and pH [6]](https://thumb-ap.123doks.com/thumbv2/123deta/8003963.1250227/21.892.310.609.377.726/figure-fraction-ammonium-ion-free-ammonia-function-temperature.webp)
![Figure 3. Typical sources and routes of micropollutants in the environment [21]](https://thumb-ap.123doks.com/thumbv2/123deta/8003963.1250227/25.892.141.762.361.787/figure-typical-sources-routes-micropollutants-environment.webp)
![Figure 9. Schematic of the metabolic and co-metabolic biotransformation strategies [66]](https://thumb-ap.123doks.com/thumbv2/123deta/8003963.1250227/49.892.140.738.147.625/figure-schematic-metabolic-metabolic-biotransformation-strategies.webp)
![Figure 10. External and internal transport of an adsorbate in activated carbon particle [53]](https://thumb-ap.123doks.com/thumbv2/123deta/8003963.1250227/51.892.240.683.583.1045/figure-external-internal-transport-adsorbate-activated-carbon-particle.webp)