博 士 学 位 論 文
Structure-function relationships of lysin motifs
derived from an alga, Volvox carteri
平成 30 年 1 月 10 日
近畿大学大学院
農学研究科 バイオサイエンス専攻
ABBREVIATIONS
(GlcNAc)n β-1,4 linked N-acetyl-D-Glucosamines with DP = n
A280 Absorbance at 280 nm
BMRB Biological Magnetic Resonance Bank
CBM Carbohyrate-Binding Module
CD Circular Dichroism
GH Glycoside Hydrolase
HIC Hydrophobic Interaction column Chromatography
HSQC Heteronuclear Single Quantum Coherence transfer
IC50 Inhibition Constant at 50 % inhibition activity
IPTG Isopropyl β-D-1-thiogalactopyranoside
ITC Isothermal Titration Calorimetry
LB Luria-bertani Broth
NMR Nuclear Magnetic Resonance spectroscopy
O.D.600 Optical Density at 600 nm
DP Degree of polymerization
RMSD Root Mean Square Deviation
SDS-PAGE Sodium Dodecyl Sulfate Poly-Acrylamide Gel Electrophoresis
CONTENTS
CHAPTER I Introduction 1
CHAPTER II LysM from an alga, Volvox carteri 12
CHAPTER III Structure-function relationship of LysM1 and LysM2 from VcChi
28
CHAPTER IV Concluding remarks 51
REFERENCES
Chapter I
Introduction
Chitin
Chitin is a secondary most abundant polysaccharide next to cellulose, and a linear polysaccharide, which is composed of N-acetylglucosamine (GlcNAc) linked by β-1,4-glycosidic linkages (Fig.I-1). Chitin and the N-deacetylated form, chitosan, naturally occur in exoskeletons of crustaceans, cuticle of insects, fungal cell wall and alga. Chitin and modified chitinous materials play roles of structural scaffold of tissue cells and support the structure against mechanical stresses.
Crystalline chitin found in nature takes different three forms having same chemical structures, but having different packing in the crystals called α-, β- and γ-chitin (Jang et al. 2004). α-chitin, which is mainly found in exoskeleton of crustaceans, has anti-parallel arrangement of single chitin chains (Carlstrom 1957). β-chitin, which is found, for example, in pen of Loligo, has parallel arrangement of single chitin chains (Blackwell 1969). γ-chitin is relatively minor form of chitin, which can have been found in cocoon fiber of Ptinus beetle and stomach of Loligo (Jang et al. 2004). γ-chitin is composed of two parallel and one anti-parallel chitin chain. Anti-parallel arrangement of α-chitin gives rise to the close packing of each chain and α-chitin as the most stable structure among these three.
Since fungal cell walls contain chitin to some extents, the degradation products, chitin-oligosaccharides, play roles on plant defense responses against pathogenic fungi (Kim et al. 2000). Similar interactions have been reported for plant-bacteria interactions through the cell wall component, peptidoglycan, and the degradation products (Willmann et al. 2011). Peptidoglycan is a co-polymer of N-acetylglucosamine and
N-acetylmuramic acid cross-linked by oligopeptides. Cell wall fragments released by
constitutively expressed lytic enzymes are perceived by receptors initiating intracellular signaling cascade and bringing about the change in expression level of genes, ion flux, accumulation of callose and etc (Vidhyasekaran 2014). Taken together, chitin and the derivatives intermediate the processes on plant-microbe interactions. Recently, Chitin- and chito-oligosaccharides, which are oligomer of chitin and chitosan, respectively, are reported to help wound healing and to have antimicrobial activity. As such, these oligosaccharides are gaining interests attribute to the potential for medical applications.
Figure I-1. Chemical structure of chitin.
Chitinases
Chitinases (E.C. 3.2.1.14) are hydrolytic enzymes, which degrade chitin. Chitinases can be classified into two families, glycoside hydrolases family 18 (GH18) and family 19 (GH19), based on their amino acid sequences (CAZy: http://www.cazy.org/Glycoside-Hydrolases.html). GH18 chitinases are commonly found in wide range of organisms from bacteria to vertebrates. On the other hand, GH19 chitinases are mainly found in plants and only limited species of bacteria. GH18 and GH19 do not share any sequence similarity and the three-dimensional (3D) structures are completely different from each other.
Two groups reported the first 3D structures of GH18 chitinases in the journal, “Structure”, in 1994 as contiguous two reports (Perrakis et al. 1994; Terwisscha van Scheltinga et al. 1994). One of them was from a gram-negative bacterium, Serratia
marcescens, and the other was from a rubber tree, Hevea brasiliensis. These reports
showed that GH18 chitinases have (β/α)8-barrel fold (Fig. I-2). As clearly seen from the
figure I-2, GH18 chitinases are varied in domain composition. Some of them have an additional ligand-binding domain, and the others do not. Some of them have an insertion domain composed of α/β secondary-structural units, and the others do not. Ohnuma et al. suggested that the variation in the domain composition is derived from the natural selection during the molecular evolution processes (Ohnuma T. et al. 2014).
Figure I-2. Crystal structures of hevamine and SmChiA. β-strands are colored as magenta, α-helices are as cyan and loop regions are colored as pink. A catalytically important DxDxE motif is indicated by red and the side chains are depicted as stick model.
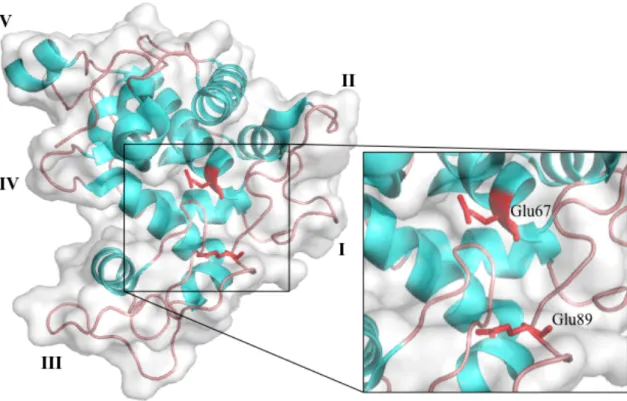
The first 3D structure of GH19 chitinases was reported in 1993 and was from barley, Hordeum vulgare. This report showed that GH19 chitinases have α-rich lysozyme-like fold (Fig. I-3) (Hart et al. 1993). The structure of this barley chitinase was composed of two lobes containing six loop structures. Based on the nomenclature of the previous reports, these loop structures can be denoted as loop I-V and C-terminal loop (Taira et al. 2011). Since chitinases lacking some of these loop structures had been reported, the barley chitinase was designated as a “loopful” chitinase in the previous reports (Ohnuma et al. 2013). The loop structures have been reported to participate in substrate binding. However, the functionalities of each loop structure have not yet been fully understood.
Figure I-3. The first GH19 chitinase structure (PDB ID: 2BAA). The loop structures (loop I-V) are indicated by roman numerals. Catalytic acid and base residues are colored as red and the stick models of the side chains are depicted.
Carbohydrate binding modules
Carbohydrate binding modules, CBMs, are classified into 83 families in CAZy database (http://www.cazy.org/) to date, based on the amino acid sequence similarity. CBMs can also be classified into three types, i.e. Type A, B and C, based on the shape of binding site (Boraston et al. 2004). Type A CBMs have flat ligand-binding site, which is mainly composed of aromatic side chains and are specific to insoluble crystalline ligands. Prevalence of aromatic side chain in ligand binding site is common for carbohydrate binding proteins. However, the platform-like architecture is characteristic for this type of CBMs. This planer architecture of the Type A CBMs is thought to be complementary to the planer architecture of crystalline polysaccharides to which the Type A CBMs are specific. Since aromatic side chains comprising carbohydrate-binding surface are thought to form CH-π stacking interactions with pyranose rings of sugar moieties of crystalline polysaccharides, complementarity of the surface architecture is advantageous to simultaneously form two or more interactions
(Ramírez-Gualito et al. 2009). This rather promiscuous binding mode sometimes enables sliding of ligand upon degradation of substrate by the attached catalytic domain. Type B CBMs have binding sites, which can accommodate a single glycan chain (Boraston et al. 2002). Hence, the Type B CBMs have cavities to accommodate glycan chain, which are often described as grooves or clefts. Type B CBMs generally show significant affinity to oligosaccharides with degree of polymerization (DP) of four or larger, but show weak or negligible affinity to oligosaccharides with DP of three or shorter. In contrast to the cases of Type A CBMs, binding-sites of Type B CBMs are generally composed of several ligand-binding subsites, where individual subsites accommodate monosaccharide units of polymeric ligands. Thus, the binding affinity elevates as DP become longer. Aromatic side chains also play important roles in ligand binding, as in the case of Type A CBMs. In contrast to Type A CBMs, however, a key role of direct hydrogen bonds upon lignad binding is characteristic for Type B CBMs. Type C CBMs lack extended binding site and accommodate only mono-, di- and tri-saccharides (Shinya et al. 2013). Distinction between the Type B and C is subtle as some CBM has both characteristics. As in Type B CBMs, a hydrogen-bonding network plays a key role on binding but seems to be more intensive.
Lysin motif
In 1986, Garvey and coworkers reported C-terminal repetitive sequence in a viral lysin (Garvey et al. 1986). Nowadays, this sequence is known to act as a binding module and reported to exist in various kinds of organisms ranging from bacteria to human (Buist et al. 2008). This protein module is called lysin motif or its abbreviation, LysM, as many of them had been found in lytic enzymes.
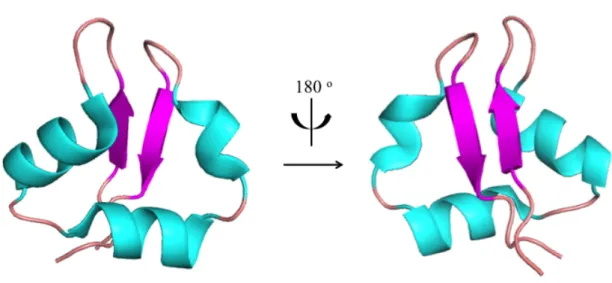
Bateman and Bycroft reported the first solution structure of LysM of bacterial lysin (MltD) using NMR in 2000, revealing that LysM has a core structure comprising ca. 40 amino acids and folded into antiparallel two stranded β-sheet connected to two α-helices on the opposite side, so called βααβ-fold (Bateman and Bycroft 2000). Six years later, Bielnicki and coworkers reported the first crystal structure and verified that the βααβ-fold is shared among LysMs (Bielnicki et al. 2006). Ohnuma and coworkers analyzed the thermodynamic character and the binding site of chitin oligosaccharides on LysM of a chitinase derived from a fern, Pteris ryukyuensis and identified the binding
cleft located on the α-helical surface based on NMR chemical shift perturbation and docking simulation (Ohnuma et al. 2008). Liu et al. reported crucial evidence for binding mode of LysM by showing crystal structure of LysM of Chitin Elicitor
Receptor Kinase (CERK1) in complex with (GlcNAc)4 (Liu et al. 2012). In this
complex structure, binding cleft extends from the loop structure connecting β-sheet and α-helices to the end of α1. As Ohnuma et al. showed the LysMs acting as subdomains in Carbohydrate-Active enZymes (CAZymes), LysM is classified as CBM50 in CAZy database.
Figure I-4. The first structure of LysM determined by NMR. β-strands are colored as magenta, α-helices are as cyan and loop regions are colored as pink. The right figure is a
180 o rotated image of the left.
Plant chitinases
Based on the structures and domain compositions, plant chitinases were classified by a different system from CAZy. According to the review of Taira (Taira 2010), plant chitinases are classified into five classes and two additional subclasses, class I-V and class IIL, class IIIb, respectively. Class I, II, IIL and IV belong to the GH19 family, though Class III, IIIb and V belong to the GH18 family.
Class I and II chitinases have homologous catalytic domain, though Class I chiitnases have additional CBM18 domain. In analogy to Class I and II chitinases, Class
IV and Class IIL chitinases also share analogous catalytic domains, but have different domain structures. Class IV chitinases have additional CBM18 domain like Class I chitinases, while Class IIL chitinases are composed of a single domain like Class II chitinases.
Class III and IIIb chitinases share similar domain composition, but have poor sequence similarities to each other (<20 %). Class IIIb chitinases lack disulfide bridges conserved in Class III chitinases, but have an inserted loop structure comprising substrate-binding site. Class V chitinases lack disulfide bridges but have insertion domain mentioned above in the section of “Chitinases”.
LysM containing plant chitinase, PrChiA
PrChiA is a chitinase derived from a fern, Pteris ryukyuensis. Onaga et al. first reported the cloning of the gene, construction of the heterologous expression system in
E.coli and characterization of the recombinant PrChiA in 2008. They showed that the
chitinase is composed of N-terminal two LysM domains (PrLysM1, PrLysM2) linked in tandem (PrLysM tandem) and C-terminal Class IIIb catalytic domain (PrChiA cat). Each domain is linked by proline, serine and threonine-rich linker region. Degradation pattern of chitin oligosaccharide by PrChiA was characteristic to the Class IIIb
chitinases, i.e. typical Class III cleaved (GlcNAc)5 mainly into (GlcNAc)4 and GlcNAc
though PrChiA cleaved (GlcNAc)5 mainly into (GlcNAc)3 and (GlcNAc)2 as was
reported for previous studies about PrChiA (Onaga and Taira 2008). Sequence analysis of PrChiA also showed strong homology to Class IIIb chitinases, but showed weak homology to Class III chitinases. They also performed LysM truncation experiments and revealed the role of LysM domains of PrChiA in this chitinase action. Truncation of LysM domains decreased not only chitin-binding affinity, but also chitin-degradation ability of PrChiA. Truncation of LysM and mutation in catalytic center got rid of antifungal activity of PrChiA indicating that the LysM domain and catalytic activity is essential for exhibiting the antifungal activity.
Ohnuma et al. cloned the genes of PrLysM2 and PrLysM tandem, constructed the heterologous expression system in E.coli as single domain proteins and characterized based on spectroscopic and thermodynamic methods, revealing that the binding mode and thermodynamics of PrLysM2 toward chitin oligosaccharides. Although several
reports about PrChiA had been elucidating enzymatic character and the binding mode of attached LysM domain, structure-function relationship of PrChiA cat have not yet been clarified. Hence, we reported the structure and function of PrChiA cat at molecular level.
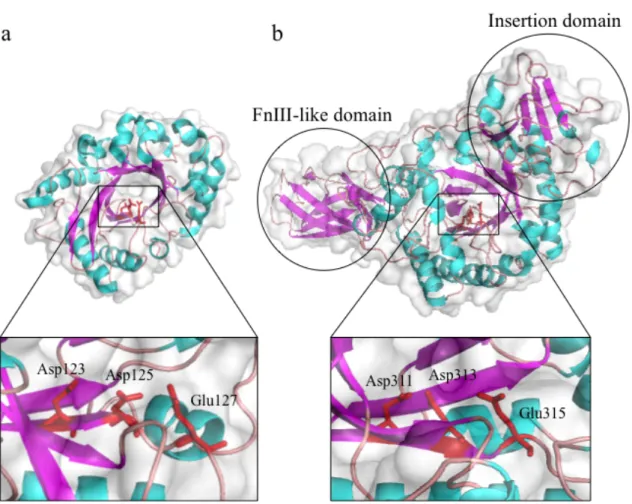
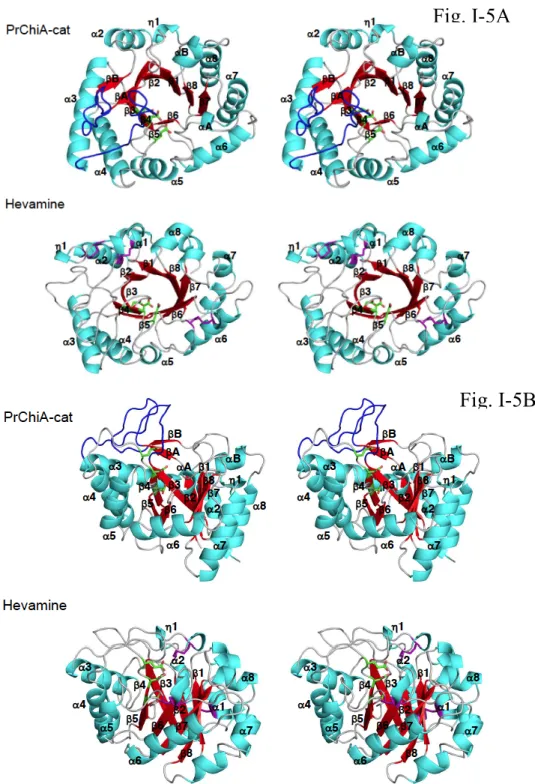
Firstly, we determined the crystal structure of PrChiA cat and compared the structure with that of a Class III chitinase from hevea brasiliensis, hevamine. Comparison of structures of these two chitinases is shown in the Fig. I-5. Detailed inspection revealed the differences in orientations of α1, α5 and α7 and also in the length of β6. The most striking difference of PrChiA was the extruded loop structure and an additional antiparallel β-sheet structure supporting the loop structure, which was not found in Class III chitinases. Chitin oligosaccharide degradation experiments showed that PrChiA cat degrade chitin oligosaccharides in a similar manner to those of the other Class IIIb chitinases, which were different from the degradation profiles of Class III chitinases suggesting that the substrate recognition mode of Class IIIb chitinases are clearly different from those of Class III chitinases. Thermal unfolding experiments in the presence and absence of chitin oligosaccharides and titration experiments by isothermal titration calorimetry (ITC) using inactive mutants of PrChiA
cat showed it can bind to (GlcNAc)3 and longer, but not to (GlcNAc)2. Thermodynamic
analysis of binding showed that the favorable enthalpy drove the binding to (GlcNAc)3
and (GlcNAc)4 accompanied with a smaller entropy loss. We also analyzed binding of
allosamidin, a well-known GH18 inhibitor, to PrChiA cat based on ITC titration experiment, inhibition assay and docking simulation. These results showed that PrChiA bound allosamidin with relatively weak affinity and was comparable to chitin
oligosaccharides. Inhibition assay of allosamidin upon degradation of (GlcNAc)4
showed more than 10-fold higher IC50 value (172±16 µM) than typical GH18 chitinases
(0.04-10 µM). Docking simulation showed that the binding site of PrChiA to allosamidin was similar to hevamine’s binding site (Fig. I-6). The extruding loop region, which is absent in hevamine, seems to make a wall on the binding site. This may interfered the correct binding to allosamidin and resulted in weaker binding affinity than typical GH18 chitinases.
Figure I-5. Stereo views of the crystal structures of PrChiA-cat and hevamine. A: views
from the top of the (β/α)8 barrel. α-Helices and a 310 helix are colored in cyan, while
β-strands are colored in red. The catalytic motif DxDxE (Asp243-Asp245-Glu247) is highlighted by astick model colored in green. The disulfide bonds found in hevamine
are colored in purple. B: Views from the side of the (β/α)8 barrel. Loop structures found
only in PrChiA are colored in blue.
Fig. I-5B
Fig. I-5A
Figure I-6. A: Crystal structure of hevamine in complex with allosamidin (PDB code: 1LLO). B: Modeled structure of PrChiA-cat in complex with allosamidin. A docking simulation was performed using AUTODOC software.
Volvox carteri
Volvox carteri is a spherical multicellular green alga comprising many small
Chlamydomonas-like biflagellate somatic cells with few large non-motile reproductive
cells called gonidia at surface area and filled with Extra Cellular Matrix, ECM (Kirk 2004). Somatic cells form monolayer surface and face the biflagellate side out and cooperatively work to swim with a characteristic rolling motion. Gonidia just lie under the layer of somatic cells and the layer comprising somatic cells and gonidia is called cellular zone in the ECM. V. carteri reproduces in an asexual reproduction cycle in haploid and a sexual life cycle is normally not utilized. Single cycle of asexual reproduction process takes 48 h and is controlled by light and dark periods. On the other hand, sexual life cycle is used only for making dormant, diploid zygotes, which can overcome harsh dryness in summer hot. Sexual reproduction process is under control of the sex-inducing pheromone, which is one of the most competent pheromone working at sub-femto molar (Starr and Jaenicke 1974).
In 1986, Kirk et al. reported the sexual reproduction is elicited by a heat shock (KirK et al. 1986). Although the molecular mechanism of the induction of the sexual
pheromone is still unclear, the mechanism of pheromone induced activation process of the sexual reproduction was suggested by Sumper et al. and is as follows; Positively charged pheromone is attracted by the negatively charged ECM and accumulated on the surface of the spheroid. Somatic cells exposed on the spheroids detect pheromone molecule and induce secretion of a protein called pherophorin II, which have 42 kDa fragment in the sequence and homologous to pheromone. Secreted pherophorin molecule is proteolytically cleaved and releases the homologous region to the pheromone into ECM. This process further amplifies the signal and the accumulated signaling molecules induce cleavage of gonidia and initiate development of reproductive sexual cells.
A chitinase derived from V. carteri, VcChi
Amon and coworkers cloned the genes of two sex-inducing pheromone inducible proteins in 1998 (Amon et al. 1998). Both clones were multi-modular and had N-terminal repetitive sequences homologous to chitin-binding proteins. One of these two clones showed homology to protease family. On the other hand, the other clone didn’t show any homology to any other protein families, but the N-terminal repetitive sequence showed similarity to repetitive sequences attached to chitinases and lysozymes including the lysozyme from Bacillus phage ϕ29, i.e. LysM. This fact led them to perform chitinase assay and showed the activity on glycol chitin.
There had been no reports following result above and no detailed analysis of this chitinase. Hence, we decided to study on this protein. Initially, we tried to characterize the N-terminal LysM domains in depth. Based on previous reports about LysMs from proteins with different functionalities, functionality of VcChi was discussed.
Chapter II
LysM from an alga, Volvox carteri
Introduction
LysM is a carbohydrate-binding module family, which can bind to saccharides containing GlcNAc as the component, such as chitin, peptidoglycan, their oligomers, lipo-chitooligosaccharides and etc. LysMs are composed of ca. 50 amino acid residues having canonical βααβ fold comprising anti-parallel 2-fold β-sheet on one side and triangular two α-helices and loop on the other side. The first complex structure of LysM binding to chitin oligomer was reported on 2012. (T. Liu et al. 2012). Chitin tetramer was accommodated by the shallow cleft on the α-helical surface.
LysMs have been found in various organisms ranging from bacteria to human. Since LysMs are specific to chitin and the related compounds, which are found as a structural element of cell walls, functionalities of LysM attached proteins involved in degradation of bacterial and fungal cell walls and perception of molecular signals have also been reported so far.
Amon et al. reported that Volvox carteri secretes a chitinase containing LysMs (VcChi) into ECM (Amon et al. 1998). We decided to characterize the LysMs attached to the VcChi (Fig. II-1). In this study, functionality of second LysM from the N-terminus (VcLysM2) was discussed.
Fig. II-1 Domain organization of a chitinase from Volvox carteri (a) and amino acid sequences of LysMs and the linker region (b). Secondary structures of VcLysM2 revealed by the crystal structure are aligned as β1, α1, α2, and β2 below the sequence. Amino acids shaded in grey are amino acid substitutions between VcLysM1 and VcLysM2.
Materials and Methods
Plasmid construction
VcChi LysM2 gene sequence was optimized and the gene was synthesized by the gene synthesis service of Thermo Fisher Scientific Inc. Yokohama, GeneArt, for E. coli expression system. The optimized gene fragment was amplified by polymerase chain reaction using forward primer (5’-ATGGGCTGCACATATACAATTCAACCG-3’) and reverse primer (5’-TTAACACGGCACGTTGATCACCTGG-3’). The amplified gene fragment was inserted into pETBlue-1 AccepTor vector (Novagen) by TA-cloning according to the instruction manual. The recombinant plasmid was designated pET-VcLysM2.
Site-directed mutagenesis
Mutation at Trp96 to Ala was introduced by Quikchange site-directed mutagenesis kit (Stratagene). Forward (5’-GGGTGACACATTCGCGGCGATCGCGCAG-3’) and reverse (5’-CTGCGCGATCGCCGCGAATGAGACACCC-3’) (mutation sites should be underlined) primers were used to amplify the mutated pET-VcLysM2 gene. The mutated sequence was verified by sequencing. Mutated plasmid was named
pET-VcLysM2 W96A.
Protein expression and purification
SHuffle T7 (NEB) harboring placI and pETBlue-1 containing VcLysM2 gene (pET-VcLysM2) and the mutant were used to express VcLysM2. Cell culture was prepared in 1 L of Luria-Bertani Broth (LB) media containing 50 µg/mL ampicillin
sodium. Cells were grown at 37 oC until it reaches O.D.600 ≈ 0.6. Then, protein
expression was induced by adding 1 mM Isopropyl β-D-1-thiogalactopyranoside
(IPTG) and the cell culture was shaken at 25 oC for 24 h. Cell culture was collected and
centrifuged at 6,500 rpm at 4 oC for 15 min. Cell pellets were re-suspended in 20 mM
Tris-HCl, pH 7.5 and lysed by sonication. Cell lysate was disrupted by sonication and the supernatant was used for further purification.
Protein solution was dialyzed against 10 mM sodium acetate, pH 4.0 for overnight.
The precipitation was removed by centrifuge at 12,000 rpm and 4 oC for 15 min. pH of
the supernatant was adjusted to 5.0 by dialyzing against 10 mM sodium acetate, pH 5.0. To perform hydrophobic interaction column chromatography, 1.5 M ammonium sulfate was directly dissolved in the protein solution. The sample was applied to TOYOPEARL Butyl-650 M (TOSOH) equilibrated with the dialysis buffer with the same concentration of ammonium sulfate to the sample. Protein adsorbed column was washed twice with the equilibration buffer. Protein adsorbed on the column was eluted by the dialysis buffer without salt. Eluted protein was fractionated into 2 mL fractions. Protein
amounts of fractions were estimated based on A280. Fractions containing protein were
collected and applied to size-exclusion column chromatography (SEC). Hiprep Sephacryl S-100 HR column equilibrated with 10 mM sodium acetate, pH 5.0, 0.1 M sodium chloride was used for SEC. After loading the sample, protein was eluted isocratically by the equilibration buffer. Purity of the protein was verified by tricine SDS-PAGE.
Crystallization and NMR sample was prepared using non-labeled and labeled M9 media instead of LB. Purification was performed in a similar manner to that used for other protein preparations.
Crystallization and data collection
Purified VcLysM2 was dialyzed twice with distilled water. Sample was concentrated to 6.0 mg/mL by Amicon Ultra-15 (Merck Millipore). Crystallization condition was screened at 480 conditions from Crystallization screens (Hamplton research). Crystallization drops were composed 1 µLs of protein sample and reservoir solution. Droplets were set up on each stage of 96-well crystallization plate (Crystalquick plate, Greiner bio-one) and equilibrated against 90 µL of reservoir solution at 293 K. X-ray diffraction experiments were performed at the beamline, BL-17A of Photon Factory (Tsukuba, Japan). Crystal grew in 0.2 M sodium citrate and 20 % PEG 3,350 was cryoprotected with 0.08 M sodium citrate, 10 % PEG 3,350 and 20 % ethylene glycol and mounted within a nylon loop. Mounted crystal was set on the goniometer, frozen by flash cooling and irradiated by X-ray with 0.98 Å wavelength. Diffraction data set was collected with PILATUS3 S 6M (DECTRIS) under the 0.1 s exposure of X-ray beam during 0.1 ° oscillation of crystal. Diffraction images were analyzed by HKL2000 (Otwinowski and Minor 1997). Statistics of diffraction data were summarized in Table II-1.
Determination and refinement of crystal structure
Molecular replacement was exploited to make the initial phase estimation using Phaser (McCoy et al. 2007) in CCP4 program suite (Collaborative Computational Project, Number 4 1994). A-chain of crystal structure of a LysM domain of PrChiA (PDB ID, 4PXV) was used as the search model. Refinement was performed using REFMAC (Murshudov et al. 1997) and Phenix.refine (Afonine et al. 2012). Molecular model was modified each step of refinement using COOT (Emsley and Cowtan 2004).
Finally, Rwork/Rfree reached to 13.9/18.0 for the structure of VcLysM2 with the highest
reslution of 1.20 Å. On the Ramachandran plot, dihedral angles of 97.9, 2.1 and 0 % of the residues were at favored, allowed and disallowed regions, respectively. Refines structure was deposited in PDB under the PDB code, 5K2L. Refinement statistics are summarized in Table II-1.
Table II-1 Data collection and refinement statistics.
Sequential assignment of backbone and partial side chain resonances
0.2 mM of 13C, 15N-labeled VcChi LysM2 dissolved in 20 mM sodium acetate, pH
5.0 (90 % H2O/10 % D2O) were used to obtain NMR spectra. Two-dimensional
(1H-15N HSQC) and three-dimensional (HNCO, HNCACO, HNCACB, CBCACONH) spectra were measured at 300 K on Bruker AVANCE III 500 MHz spectrometer equipped with a triple-resonance pulsed-field-gradient cryo-probe head under the control of TopSpin 2.1. Raw FID data were processed on NMRPipe (Delaglio et al. 1995) and the resulting spectra were analyzed by Sparky. Assignment data for VcLysM2 were deposited in the BMRB database as the accession code, 12002.
Chemical shift perturbation upon binding to (GlcNAc)n (n = 3-6)
(GlcNAc)3 (0-4.8 mM), (GlcNAc)4 (0-0.7 mM), (GlcNAc)5 (0-0.6 mM) and
(GlcNAc)6 (0-0.5 mM) were titrated into 15N-labeled VcLysM2 (62 µM) dissolved in
the same buffer used for resonance assignment. Chemical shift perturbation was
observed on 1H-15N HSQC spectra and the degree of signal migration, Δδ, for each
residue was calculated by the following equation, Δδ = |ΔδH| + |ΔδN/5|
where ΔδH and ΔδN represent chemical shift migration on 1H- and 15N-axis, respectively.
Amino acid residues corresponding to the signals migrated more than Δδ = 0.25 or broaden and hard to be followed were mapped on the surface model of the crystal structure of VcLysM2 to estimate the ligand binding sites.
Thermodynamics of VcLysM2 and W96A mutant
VcLysM2 (130 µM) and VcLysM2-W96A (112 µM) dissolved in 20 mM sodium acetate, pH 5.0 were used for titration experiments using iTC200 (MicroCal) controlled
by the operating software. Experimental data were analyzed by Origin 7. (GlcNAc)n (n
= 2-6) dissolved in the dialysis buffer used to prepare protein samples were titrated into the protein solution in the sample cell (202.8 µL). Energy applied to keep constant the temperature of cells in the adiabatic jacket was recorded every five seconds and were plotted against the experimental time (µcal/sec). Thermogram obtained was baseline-subtracted, and the individual responses were integrated and plotted against the molar ratio of ligand to protein. Using One Set of the Sites model defined in the Origin software, thermodynamic parameters were optimized by fitting theoretical curves to the experimental data.
Results
Crystal structure of VcLysM2
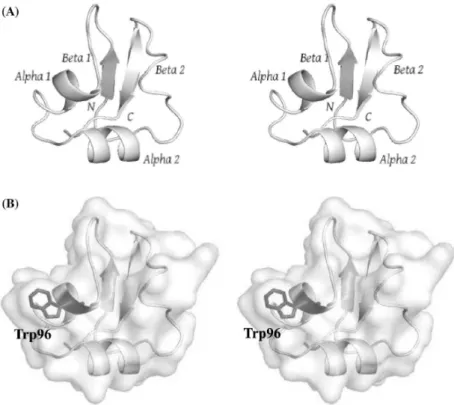
Crystal structure of VcLysM2 was successfully determined at 1.2 Å resolution. One VcLysM2, eighty-nine water molecules and one ethyleneglycol molecule were found in the asymmetric unit. VcLysM2 adopted βααβ fold canonical for LysM domains as is shown on the Fig. II-2. The first strand (β1), the first helix (α1), the second helix (α2) and the second strand (β2) were ranging from Thr86 to Ile89, Phe95 to Ala99, Val106 to Leu112 and Gly124 to Asn128, respectively. A disulfide bridge formed between Cys85 and Cys131 tied N- and C-termini. On the surface model of the structure, we found a shallow cleft comprising the loop between β1 and α1, α2 and the loop between α2 and β2. Ethyleneglycol molecule was accommodated in a cavity on the shallow cleft and forming indirect hydrogen bonding to VcLysM2 molecule through water molecules.
Fig. II-2 Stereo views of the crystal structure of VcLysM2. Ribbon representation of the main chain structure (a) and the surface model of the entire structure (b). The Trp96 side chain involved in GlcNAc residue binding is highlighted by a stick model.
To determine the (GlcNAc)n interaction site, we attempted to co-crystallize
VcLysM2 with ligand or to soak the crystal with ligand solution. However, the trials were unsuccessful. Since VcLysM2 molecules were tightly packed in the asymmetric unit, we concluded that the tight packing of VcLysM2 molecules resulted in the difficulties to obtain ligand bound crystals. Therefore, we tried to estimate the ligand-binding site by NMR.
Backbone resonance assignments
As is shown in Fig II-3 (red), the signals of VcLysM2 on 1H-15N HSQC spectrum
are fully separated. It helped us to almost completely assign backbone and Cβ
resonances. Finally, 90 % of the backbone 1HN and 15N, 100 % of the 13Cα, 100 % of
the 13Cβ and 98 % of the 13C’ resonances were assigned excluding four proline
residues and the N-terminal methionine residue. Corresponding assignments to 1H-15N
correlation signals are labeled nearby in Fig II-3.
Fig. II-3 1H-15N HSQC spectra of 15N-labeled VcLysM2 (red) and VcLysM2-W96A
(green). The main chain resonances of VcLysM2 were assigned as labeled in the spectrum. The resonances designated by arrows are the main chain and side chain resonances of Trp96 of VcLysM2. 10 10 9 9 8 8 7 7 ω2 - 1H (ppm) 130 130 125 125 120 120 115 115 110 110 105 105 ω1 - 15 N (ppm) Q90 N117 V126 C131 I89 T88 V123 Q125 L121 V108 F95 I127 V106 Q122A99 D93 V116 Q110 N128 C85 R101 R120 I98 A119 N113 L112 W96 I109 D107 S111 G124 Q100 T104 R102 G92 V129 G84 T86 T105 G115 G103 T94 Y87 A97
Red: wild type
Green: W96A
(GlcNAc)3-6 binding site
Upon titration of (GlcNAc)3-6 solution into the protein solution, migration of
backbone NH signals were observed. Thus the degrees of signal migrations, Δδ, for each peak corresponding to residues were calculated and plotted against the residue number (Fig II-4 a-d). Significantly (Δδ > 0.25) titrated residues were mapped on the
crystal structures and are shown as the insets of each bar graph. Along (GlcNAc)3
titration, the backbone NH resonance of Trp96 were broaden and beyond recognition during titration. Signals were gradually migrated suggesting that the exchange rate of binding was fast or intermediate. At saturated a point, backbone resonances of Gly92,
Thr94, Phe95, Ile98, Leu121 and Gln122 were significantly titrated. When (GlcNAc)4
was used for titration experiment instead of (GlcNAc)3, backbone NH signals of Ala99,
Ala119, Arg120 and Gly124 were significantly titrated in addition to the residues
affected by (GlcNAc)3. Additional line broadenings were observed for backbone NH
resonances of Ile98 and Gln100. When (GlcNAc)5 was used as a titrant, Asp93, Ala97
and Leu121 were further affected upon binding. In the case of (GlcNAc)6, the result was
almost identical to those obtained with (GlcNAc)5, but further line-broadening was
observed for backbone NH signal of Asp93. Overall, the binding sites of VcLysM2 to chitin oligosaccharides are located on the shallow binding groove formed by the loop connecting β1 and α1 and that connecting α2 and β2. Broadening of several residues may be due to the change in the dynamic state of the α1-helical region.
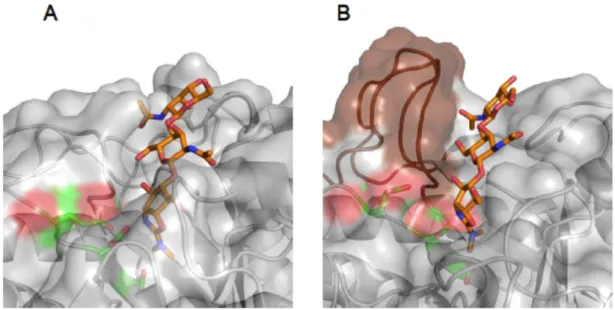
Fig. II-4 Ligand-binding site of VcLysM2 estimated by NMR-based titration experiments. Histograms of chemical shift changes (green) or line broadening (magenta) of the individual main chain resonances of VcLysM2 induced by the binding
of (GlcNAc)3 (a), (GlcNAc)4 (b), (GlcNAc)5 (c), and (GlcNAc)6 (d) at the saturated
conditions. Insets are the surface model of the crystal structure of VcLysM2, in which
amino acid residues, the resonances of which were affected by (GlcNAc)n binding, are
highlighted in the same colors as in the histograms. (e) Crystal structure of
(GlcNAc)6-bound LysM from a putative NlpC/P60 D,L endopeptidase from T.
thermophilus (PDB code, 4UZ2).
0" 0.1" 0.2" 0.3" 0.4" 0.5" 0.6" 0.7" 0.8" 0.9" 1" 84" 94" 104" 114" 124" C h em ic al s h ift d iffe re n ce
Amino acid number
(A) GlcNAc)3 Trp96 Ile98 Phe95 Thr94 Gly92 Gln122 Leu121
Amino acid number
C h emi cal s h ift c h an ge 0 84 0.1 0.2 0.3 0.4 0.5 0.6 0.7 0.8 0.9 1.0 94 104 114 124 0" 0.1" 0.2" 0.3" 0.4" 0.5" 0.6" 0.7" 0.8" 0.9" 1" 84" 94" 104" 114" 124" C h em ic al s h ift d iffe re n ce
Amino acid number
(B) (GlcNAc)4 Trp96 Ile98 Phe95 Thr94 Gly92 Ala99 Gln100 Ala119 Arg120 Gln122 Gly124
Amino acid number
C h emi cal s h ift c h an ge 0 84 0.1 0.2 0.3 0.4 0.5 0.6 0.7 0.8 0.9 1.0 94 104 114 124 0" 0.1" 0.2" 0.3" 0.4" 0.5" 0.6" 0.7" 0.8" 0.9" 1" 84" 94" 104" 114" 124" C h em ic al s h ift d iffe re n ce
Amino acid number
(C) (GlcNAc)5 Trp96 Ile98 Phe95 Thr94 Asp93 Gly92 Ala99 Gln100 Ala119 Arg120 Leu121 Gln122 Gly124 Ala97
Amino acid number
C h emi cal s h ift c h an ge 0 84 0.1 0.2 0.3 0.4 0.5 0.6 0.7 0.8 0.9 1.0 94 104 114 124 0" 0.1" 0.2" 0.3" 0.4" 0.5" 0.6" 0.7" 0.8" 0.9" 1" 84" 94" 104" 114" 124" C h em ic al s h ift d iffe re n ce
Amino acid number
(D) (GlcNAc)6 Trp96 Ile98 Phe95 Thr94 Gly92 Ala99 Gln100 Ala119 Arg120 Leu121 Gln122 Gly124 Asp93
Amino acid number
C h emi cal s h ift c h an ge 0 84 0.1 0.2 0.3 0.4 0.5 0.6 0.7 0.8 0.9 1.0 94 104 114 124 (E)
Effect of mutation of Trp96
Figure II-4e shows the crystal structure of LysM from putative D,L-endopeptidase,
NlpC/P60, in complex with (GlcNAc)6. Wong and co-workers reported that the Tyr28
of the LysM are interacting with GlcNAc residue at the reducing end through stacking interaction. Since VcLysM2 also has Trp96 at the similar position, we assume that the residue can be involved in the interaction. In order to investigate the contribution of
Trp96 to the interaction with (GlcNAc)n, we mutated Trp96 to alanine
(VcLysM2-W96A) and characterized the mutant. As is shown in Fig. II-3, the backbone
NH signal of Trp96 in the 1H-15N HSQC spectrum of VcLysM2 (red) disappeared in the
spectrum of VcLysM2-W96A (green) as predicted previously. Backbone NH signals of other residues around Trp96 were also shifted, but we assumed it was due to the lack of aromatic ring. Therefore, we assumed the mutation doesn’t entirely affect the whole structure of the protein. We assigned the characteristic resonance at 10.15 ppm of the
1H-axis and 130 ppm of the 15N-axis in 1H-15N HSQC of VcLysM2 (Fig. II-3, red) as
the indole NH of Trp96 since VcLysM2 contain only one Trp residue. This resonance is absent in the spectrum of VcLysM2-W96A (Fig. II-3, green) indicating that the
assignment was correct. Titration of (GlcNAc)3 to VcLysM2 shifted the side chain
signal of Trp96 to higher field a bit (Fig. II-5a), but was markedly different response to
the cases of (GlcNAc)4, (GlcNAc)5 and (GlcNAc)6 (Fig. II-5b-d), in which large
migrations to lower field were observed. This indicate the major contribution of this
Fig. II-5 Overlays of 1H-15N HSQC spectra of 15N-labeled VcLysM2 in the absence or
presence of (GlcNAc)3 (a), (GlcNAc)4 (b), (GlcNAc)5 (c), or (GlcNAc)6 (d). NMR
titrations of the individual ligands were conducted in 20 mM sodium acetate pH 5.0.
The molar ratios of (GlcNAc)n:protein were 0:1 (red), 5:1 (green), 23:1 (cyan), and 96:1
(blue) for (GlcNAc)3 (a); 0:1 (red), 1:1 (green), 4:1 (cyan), and 14:1 (blue) for
(GlcNAc)4 (B); 0:1 (red), 2:1 (green), 4:1 (cyan), and 11:1 (blue) for (GlcNAc)5 (c); and
0:1 (red), 1:1 (green), 2:1 (cyan), and 12:1 (blue) for (GlcNAc)6 (d)
Thermodynamics of (GlcNAc)3-6 binding to VcLysM2 and VcLysM2-W96A
Fig. II-6 shows thermograms and binding isotherms of (GlcNAc)3-6 binding to VcLysM2 VcLysM2 and VcLysM2-W96A. All bindings were exothermic and the heat
evolutions increase as the degrees of polymerization increase.GlcNAc)2 was also
titrated, but thermogram didn’t show any characteristic profile for bindings. Therefore,
the thermodynamic parameters were analyzed only for (GlcNAc)3-6. Thermodynamic
parameters were determined by data-fitting, based on One set of the sites model in the Origin software. Binding stoichiometry of weak bindings were fixed at one as was
observed in VcLysM2-(GlcNAc)3 and VcLysM2-W96A-(GlcNAc)3 and (GlcNAc)6
binding data. Resulting thermodynamic parameters are summarized in the Table II-2. All in all, thermodynamic parameters were driven by favorable enthalpy changes accompanied with smaller unfavorable entropy changes. Although binding of VcLysM2
to (GlcNAc)4, (GlcNAc)5 and (GlcNAc)6 showed tendencies that longer oligomers have
larger enthalpy gain accompanied with larger entropy loss, binding to (GlcNAc)3
showed largest enthalpy and entropy contributions in all oligosaccharides tested. When we used VcLysM2-W96A instead of VcLysM2, smaller contributions of both enthalpy and entropy changes were observed among oligosaccharides tested. Resulting free
energy change showed moderate difference in affinities between (GlcNAc)3 and
(GlcNAc)6 with -1.0 kcal/mol for VcLysM2-W96A, whereas marked difference in
affinities between these oligosaccharides by -2.9 kcal/mol for VcLysM2. This suggests that VcLysM2-W96A has shortened ligand-binding site.
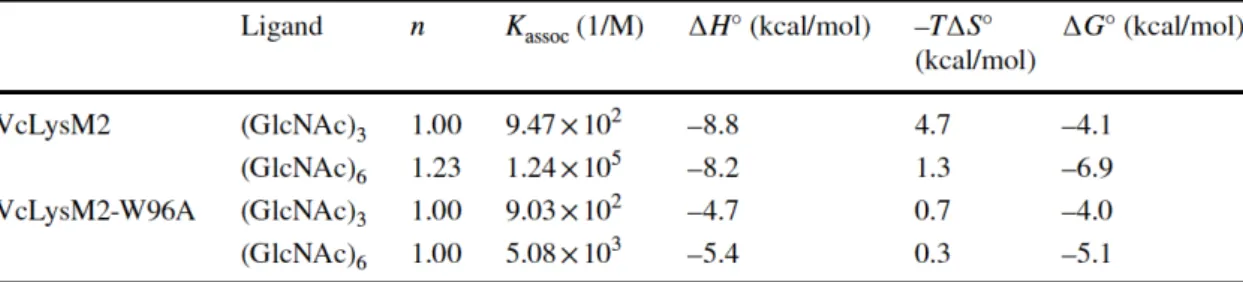
Table II-2 Thermodynamic parameters obtained for chitin oligosaccharide binding to VcLysM2 and VcLysM2-W96A
Fig. II-6 ITC thermograms and theoretical fits for the binding of (GlcNAc)3 and
(GlcNAc)6 to VcLysM2 and VcLysM2-W96A. Titrations were conducted in 20 mM
sodium acetate pH 5.0. Thermodynamic parameters obtained from individual experiments are listed in Table 1.
0 20 40 60 80 100 -0.80 -0.60 -0.40 -0.20 0.00 -1.20 -1.00 -0.80 -0.60 -0.40 -0.20 0.00 0 50 100 150 Time (min) !" #$ %& '" Molar Ratio (" #$ )* +$ ,-)+ .)/ 01 '" 2# 02 VcLysM2 (GlcNAc)3 (GlcNAc)6 0 20 40 60 80 100 -0.40 -0.35 -0.30 -0.25 -0.20 -0.15 -0.10 -0.05 0.00 0.05 -1.00 -0.80 -0.60 -0.40 -0.20 0.00 -10 0 10 20 30 40 50 60 70 80 90 Time (min) !" #$ %& '" Molar Ratio (" #$ )* +$ ,- )+ .)/ 01 '" 2# 02 0 5 10 15 20 25 30 -1.40 -1.20 -1.00 -0.80 -0.60 -0.40 -0.20 0.00 -0.50 -0.40 -0.30 -0.20 -0.10 0.00 -10 0 10 20 30 40 50 60 70 80 90 100 110 Time (min) !" #$ %& '" Molar Ratio (" #$ )* +$ ,- )+ .)/ 01 '" 2# 02 VcLysM2-W96A (GlcNAc)3 (GlcNAc)6 0 1 2 3 4 5 6 7 8 9 -8.00 -6.00 -4.00 -2.00 0.00 -1.80 -1.60 -1.40 -1.20 -1.00 -0.80 -0.60 -0.40 -0.20 0.00 0.20 0 20 40 60 80 100 120 Time (min) !" #$ %& '" Molar Ratio (" #$ )* +$ ,- )+ .)/ 01 '" 2# 02
Discussion
Chitinases expressed in higher plants are induced by various biotic and abiotic stresses and thought to act in host-defensive reaction against pathogens. In the case of VcChi, the expression is induced by wounding and sex-inducing pheromone as was reported by Amon et al. Sex-inducing pheromone of V. carteri is induced by heat stresses and result in formation of dormant zygotes, which are considered to work for overcoming dryness of ponds in the summer heat (Kirk and Kirk 1986; Amon et al. 1998). Therefore, the VcChi expression seems be directly or indirectly induced by abiotic stresses. However, the expression of VcChi can also be induced by mechanical stresses caused by biotic stresses. VcChi doesn’t show any similarities to chitinases from other higher plants. In this context, the structural and functional study of the enzyme is highly desired.
Boraston proposed a classification of CBMs into three types based on the carbohydrate-recognition mechanisms, i.e. Type A, Type B and Type C(Boraston et al. 2004). Type A CBMs have planer binding surface, which is mainly composed of aromatic residues and bind to insoluble ligands(Tormo et al. 1996). Type B CBMs have relatively opened binding cleft, which can accommodate various degrees of carbohydrates (Boraston et al. 2002), but not planer ligand binding site. Type C CBMs have relatively short binding site, which can accommodate only mono-, di, or trisaccharides (Shinya et al. 2013). VcLysM2 can be classified as Type B, based on the fact that the protein showed specificities toward various degrees of oligosaccharides with different affinities through the shallow binding cleft.
The disulfide bridge connecting the N- and C-termini was found in the crystal
structure. Thermal denaturation experiments showed Tm more than 90 °C for VcLysM2
(data not shown). Thermal stability of LysM domains have been reported for PrChiA LysM2 containing two disulfide bridges and the melting temperature was at 89.9 °C (Ohnuma et al. 2008). One of the covalent cross-linkages bridges almost same position as VcLysM2 and the other bridges the beginning of α1 and the loop between α2 and β2. VcLysM2 has Phe95 corresponding to the second disulfide bridge and the residue seems forming the hydrophobic core. This can potentially contribute to the thermal stability.
Mutational analysis of VcLysM2-W96A partially elucidated the ligand-recognition mechanism of VcLysM2. Aromatic side chains of amino acid residues are known to
have ability to form CH-π stacking interaction with the pyranose ring. The combination of crystal structure, NMR and ITC binding analyses showed that the stacking interaction is also the case for VcLysM2. Crystal structure showed that VcLysM2 has surface-exposed aromatic side chain on Trp96, which is able to interact with the ligand. Titration experiments using NMR showed that Trp96 residue form the binding site on
VcLysM2. In the ITC experiments, binding affinities for (GlcNAc)4, (GlcNAc)5 and
(GlcNAc)6 were significantly different from each other (0.9, 1.3 and 1.9 kcal/mol,
respectively), though almost no difference in the binding affinities to (GlcNAc)3 were
observed between VcLysM2 and VcLysM2-W96A (0.1 kcal/mol). As was also
suggested from signal migration of aromatic NH of Trp96 upon binding to (GlcNAc)3,
(GlcNAc)4, (GlcNAc)5 and (GlcNAc)6, Trp96 specifically binds to (GlcNAc)4,
(GlcNAc)5 and (GlcNAc)6 and forms a binding subsite at the end of the chitin-binding
site. Similar effect was also observed for the LysM domains from a putative NlpC/P60 D,L-endopeptidase from Thermus thermophiles reported by Wong et al., who clearly showed that the Tyr28 at the beginning of α1 are located at the edge of binding site and interacting with GlcNAc residue through CH-π stacking (Wong et al. 2015). Taken together, we concluded that Trp96 of VcLysM2 forms GlcNAc binding subsite at the edge of the binding site and interacting through CH-π interaction.
Chapter III
Structure-function relationship of LysM1 and LysM2 from VcChi
Introduction
Biochemical significance of the multi-modularity in proteins has been shown for many kinds of proteins and also for LysM-containing proteins. Mechanisms of taking advantages from the multi-modularity in proteins vary from protein to protein. Plant Receptor-like kinases (RLKs) and receptor-like proteins (RLPs) containing extracellular LysMs as sensor domain cooperatively bind to chitin fragment released from pathogenic microorganisms leading to defense-signaling cascade (Liu et al. 2012; Liu et al. 2016). Chitin elicitor-receptor kinase 1 (CERK1) and Chitin elicitor- binding protein (CEBiP) are one of the most famous RLK-RLP system that recognize chitin oligosaccharides derived from fungal cell wall through forming intermolecular dimeric structure (Liu et al. 2016). On the other hand, the opponents, fungi, secrete effector protein containing multiple LysMs, which bind to chitin oligosaccharides with much higher affinity than plant-receptor proteins, to escape from plant defense responses. Ecp6 from Cladosporium fulvum is one of such effector proteins comprising three LysMs, which can bind to chitin oligosaccharides with ultra-high (pM) affinity (Sánchez-Vallet, A. et al. 2013). To accomplish the high affinity, Ecp6 forms an intramolecular dimerization using two of three LysMs in the protein. To fit the catalytically active domain to its substrate, bacterial lysin harboring an endopeptidase domain, NlpC/P60 domain, adopts intermolecular dimerization of LysMs to attach the catalytic domain to peptide fragment of peptidoglycan (Wong et al. 2014).
Although the reports on multi-modular LysM containing proteins described above revealed the structural assembly and binding mode on these proteins, the contributions of individual LysMs have not yet been clarified in detail. We then cloned the genes of VcLysM1, VcLysM2 and VcLysMs linked in tandem, purified the proteins, and analyzed the binding modes of individual domains.
Materials and Methods
Plasmid construction
pET-VcLysM2 used for the experiments on the chapter II were also used for the experiments in this chapter. Plasmid containing VcLysM1 was constructed by double mutations of Asn117 and Ala119 of VcLysM2 into asparagine and alanine, respectively, and the genes encoding intermediate proteins between VcLysM1 and VcLysM2, VcLysM2-N117V and VcLysM2-A119T, were also constructed by introducing
mutations into pET-VcLysM2. Mutations were introduced by QuikChange®
Site-directed mutagenesis kit (Stratagene) using the primers on the table III-1. A gene encoding VcLysM tandem was amplified by PCR using the primers listed on the table III-1 and inserted into pETBlue-1 AccepTor vector (Novagen) by TA-cloning.
Table III-1. Primers used for site-directed mutagenesis.
*Single and double underline correspond to N117V and A119T mutations, respectively.
Preparation of protein samples
SHuffle T7 express (NEB) harboring pET-VcLysM1, VcLysM2 N117V, VcLysM1 A119T, VcLysM2 and VcLysM tandem were used to express corresponding genes. Purification procedures were almost the same as the procedure for VcLysM2 described on the chapter II, but 1.5 M ammonium sulfate was used for VcLysM tandem on hydrophobic interaction column chromatography instead.
Primers Primer sequences (5’-3’)
N117V Fwd. GAATCCTGGCGTTGTTCCGGCACGCCTGC
N117V Rev. GCAGGCGTGCCGGAACAACGCCAGGATTC
A119T Fwd. GGCGTTGTTCCGACACGCCTGCAGG
A119T Rev. CCTGCAGGCGTGTCGGAACAACGCC
N117V/A119T Fwd. CTGGCGTTAATCCGACACGCCTGCAGG
N117V/A119T Rev. CCTGCAGGCGTGTCGGATTAACGCCAG
VcLysM tandem Fwd. ATGGGTTGTACCTATACCATTCAGCCTG
All experiments were performed in 20 mM Sodium acetate, pH 5.0.
Determination of protein concentration
Protein concentrations were determined by absorbance at 280 nm. Molar extinction
coefficient, εM, was calculated based on the amino acid sequences. Equation used for
the calculation is as follows:
εM=5,500(#tryptophan)+1,490(#tyrosin)+125(#cystine) (Pace et al. 1995).
Isothermal titration experiments
An iTC200 system (GE Healthcare) was used for titration experiments. The
standard software from the supplier was used to operate the equipment. Ligand solution filled in the syringe was titrated into protein solution in the sample cell for all experiments. Raw data were processed and analyzed by Origin software. Protein and ligand concentrations used for experiments are listed on the table III-2.
Table III-2. Samples used for ITC experiments
Protein Concentration Ligand Concentration
VcLysM1 115 µM (GlcNAc)3 46.0 mM (GlcNAc)4 11.5 mM (GlcNAc)5 4.6 mM (GlcNAc)6 4.6 mM VcLysM1 V53N 97.0 µM (GlcNAc)3 52.0 mM (GlcNAc)4 13.0 mM (GlcNAc)5 4.5 mM (GlcNAc)6 3.8 mM VcLysM1 T55A 130 µM (GlcNAc)3 52.0 mM (GlcNAc)4 26.0 mM (GlcNAc)5 16.0 mM (GlcNAc)6 5.2 mM VcLysM2 94.0 µM (GlcNAc)4 7.0 mM (GlcNAc)5 4.1 mM VcLysM tandem 127 µM (GlcNAc)3 48.0 mM (GlcNAc)4 24.0 mM (GlcNAc)5 15.0 mM (GlcNAc)6 3.6 mM
During titration experiments, sample solution was kept stirred by the syringe tip and the stirring speed was at 1,000 rpm. Data points were collected by titrations every 5 seconds and plotted against the experimental time. Peaks for each titration on the thermogram were integrated and plotted against the molar ratio of ligand to protein (Fig. III-1 and Fig. III-13). Based on the experimental data for VcLysMs, non-linear data fittings were performed by assuming one set of the sites model defined in the Origin
software to obtain the thermodynamic parameters for binding of (GlcNAc)n. A
sequential model was used to fit the data for VcLysM tandem. Resulting thermodynamic parameters are summarized on the table III-3 and table III-6.
Circular dichroism of VcLysMs
Circular dichroism spectra of VcLysM1, VcLysM1 V53N, VcLysM1 T55A at 200-260 nm were recorded by a J-720 (JASCO) equipped with a PTC-423L temperature controller under operation of the Spectra manager software (JASCO). All measurements were conducted with 2 mm quartz cuvette and the temperature was kept at 298 K. Ellipticities of samples at every 0.1 nm were recorded and normalized as molar ellipticity, θ (deg cm2 dmol-1).
Acquisitions of NMR spectra
Bruker UltraShield 500 Plus magnet equipped with a Avance III spectrometer and a triple-resonance pulse-field-gradient cryoprobe head was used to record spectra. All
equipments were operated by Bruker TopSpin 2.1. Finally, one-dimensional (1H),
two-dimensional (1H-15N HSQC, 1H-13C HSQC, NOESY, DQF-COSY) and
three-dimensional (HNCO, HNCACO, CBCACONH, HNCACB, HCCH-TOCSY,
CCH-TOCSY, 15N-edited TOCSY, 15N-edited NOESY, 13C-edited NOESY) spectra
were recorded were collected at 300 K. one-dimensional spectra were processed and analyzed by TopSpin and two-dimensional and three-domensional spectra were processed by NMRPipe (Delaglio et al. 1995) and analyzed by Sparky (Goddard et al.; https://www.cgl.ucsf.edu/home/sparky/).
H-D exchange experiments
1H-15N HSQC spectra were recoded 12 min to 24 hours after exchanging normal
buffer with deuterated buffer. Buffer was exchanged by concentration by Vivaspin®
6-3K and dilution with the deuterated buffer. H-D exchange was observed based on the disappearance of HSQC signals.
Structural calculation by CYANA
Three-dimensional structure of VcLysM1 and VcLysM2 were calculated based on distance constraints obtained from NOE experiments and dihedral angle constraints generated by TALOS+ (Shen et al. 2009) using CYANA (Güntert and Buchner 2015). After several cycles of refinements, distance constraints for hydrogen bonding derived from H-D experiments are combined. Finally, 687 NOE-based distance, 216 dihedral angle, 32 hydrogen bonding based distance and 3 disulfide bonds-based distance restraints were used for structural calculation of VcLysM1, and 721 NOE-based distance, 216 dihedral angle, 32 hydrogen bonds-based distance and 3 disulfide bonds- based distance restraints were used for structural calculation of VcLysM2. Among 100 conformers calculated, 20 conformers were chosen as the representative structure based on the target function. The representative structures are shown on the Fig. III-5.
Chemical shift perturbation experiments of VcLysM1 upon titration of (GlcNAc)6 To define the ligand binding site of VcLysM1, totally 100 µL of 0.5 mM
(GlcNAc)6 were titrated into 500 µL of 50 µM VcLysM1 and the chemical shift
migration was observed for each 1H-15N resonance. Combined chemical shift migration,
Δδ, was calculated as follows: Δδ = |ΔδH|/5 + |ΔδHN|.
Δδs were plotted against the corresponding residue numbers (Fig. III-7). Amino acid
residues representing the 1H-15N resonances with 0.25<Δδ were mapped on the solution
based on the results described in chapter II were also mapped on the solution structure of VcLysM2.
4, 8, 16, 28, 48, 72, 100 µL of 30 mM (GlcNAc)3 was repeatedly titrated into
VcLysM tandem and Δδ were calculated for Gly28/92, Gly51/115 and Gly60/124. Peak position was determined by fitting Gaussian to the partially overlapped peaks using built-in integration script of Sparky. Δδ were plotted against the free ligand
concentration and the association constants, Kas, and corresponding ΔG˚s were
determined by fitting regression curves.
Docking simulation of VcLysM1 to (GlcNAc)6
To estimate the binding mode of VcLysM1 to (GlcNAc)6, docking simulation was
performed using HADDOCK 2.2 web server (Dominguez, C. et al. 2003 and de Vries,
S.J. et al. 2007). Top 20 structures of the solution structure of VcLysM1 and (GlcnAc)6
structure prepared by combination of GLYCAM (Woods group 2005-2017: http://glycam.org) and PRODRG (Schüttelkopf, A.W. et al. 2004) were used for the simulation. Gly28, Asp29, Thr30, Trp32, Gln36, Val53, Thr55, Arg56, Gln58 and
Gly60 of VcLysM1 were selected as the active residues based on the (GlcNAc)6
titration experiment using NMR and accessible surface area calculated by ASA-view (http://www.abren.net/asaview/). Passive residues were selected automatically. Simulated complex structure is shown on the Fig. III-9.
Results
Binding thermodynamics of VcLysMs binding to (GlcNAc)2-6
(GlcNAc)2, (GlcNAc)3, (GlcNAc)4, (GlcNAc)5 and (GlcNAc)6 solutions were
titrated into VcLysM1, VcLysM2-N117V, and VcLysM2-A119T solutions, and
(GlcNAc)4 and (GlcNAc)5 were titrated into VcLysM2. Profiles of heat evolutions were
satisfactorily obtained to determine the thermodynamic parameters for (GlcNAc)3,
(GlcNAc)4, (GlcNAc)5 and (GlcNAc)6 titration into all proteins (Fig. III-1). Since no
significant heat evolution was observed for (GlcNAc)2 (data not shown),
(GlcNAc)5 and (GlcNAc)6 and are summarized on the table III-3. Due to the poor data
points at lower molar ratio, which are important to correctly determine the
thermodynamic paramaters (Turnbull and Daranas 2003), the data for (GlcNAc)3 were
inaccurate when compared with longer chain oligosaccharides. Therefore, discussion
will be based only on the thermodynamic parameters for (GlcNAc)4, (GlcNAc)5 and
(GlcNAc)6.
Figure III-1. Comparison of Chitin oligosaccharide binding experiments of VcLysMs. Upper panels are thermograms and the lowers are binding isotherms of binding of VcLysM1, VcLysM1 V53N, VcLysM1 T55A and VcLysM2 to chitin hexamer from left to right.
Table III-3. Thermodynamics of VcLysM1-(GlcNAc)3-6 binding experiments.
*Thermodynamis of (GlcNAc)3 and (GlcNAc)6 are from Kitaoku et al. (2017)
Protein Ligand N Ka (M-1)
ΔH - TΔS ΔG (kcal/mol) (kcal/mol) (kcal/mol) VcLysM1 (GlcNAc)3 1 3.94 x 10³ -8.67 3.75 -4.92 (GlcNAc)4 1.02 5.30 x 10⁴ -9.21 2.76 -6.45 (GlcNAc)5 1.03 2.10 x 10⁵ -9.93 2.66 -7.27 (GlcNAc)6 0.957 4.67 x 10⁵ -11.0 3.22 -7.78 VcLysM1 V53N (GlcNAc)3 1 1.92 x 10³ -7.17 2.69 -4.48 (GlcNAc)4 1 2.67 x 10⁴ -7.97 1.93 -6.04 (GlcNAc)5 0.968 1.05 x 10⁵ -8.68 1.81 -6.86 (GlcNAc)6 0.904 2.24 x 10⁵ -9.43 2.13 -7.30 VcLysM1 T55A (GlcNAc)3 1 9.05 x 10² -7.61 3.58 -4.03 (GlcNAc)4 1 1.03 x 10⁴ -8.71 3.22 -5.49 (GlcNAc)5 1.04 4.16 x 10⁴ -8.96 2.66 -6.30 (GlcNAc)6 0.996 1.07 x 10⁵ -9.06 2.20 -6.86 VcLysM2* (GlcNAc)3 1 9.47 x 10² -8.76 4.68 -4.08 (GlcNAc)4 1.01 1.13 x 10⁴ -5.95 0.423 -5.52 (GlcNAc)5 0.866 3.39 x 10⁴ -7.51 1.15 -6.19 (GlcNAc)6 1.23 1.24 x 10⁵ -8.24 1.28 -6.95 VcLysM1- (GlcNAc)3 VcLysM2- (GlcNAc)6 VcLysM1 V53N- (GlcNAc)4 VcLysM1 T55A- (GlcNAc)5
All in all, binding stoichiometry converged to 1 indicating the binding of VcLysMs to chitin oligosaccharides tested were 1:1 interaction. Binding reactions were driven by enthalpy accompanied with smaller and unfavorable entropy and both favorable and unfavorable contributions increased as polymerization degree become larger. Binding constants decreased in the order of VcLysM1, VcLysM2-A119T, VcLysM2-N117V and VcLysM2 indicating that the mutants have intermediate affinity between VcLysM1 and VcLysM2. In most cases, VcLysM1 showed largest favorable contributions of enthalpy accompanied with largest unfavorable contributions of entropy among these proteins. VcLysM2-N117V also showed large contributions of favorable enthalpy changes, but unfavorable contributions of entropy resulted in the affinity rather similar to VcLysM2. In comparison with VcLysM2-N117V, A119T mutant showed rather modest contributions of unfavorable entropy changes and resulted in second smallest ΔG˚ values among the proteins used.
To examine more details about the effects of mutations, changes in ΔH˚ and TΔS˚ for individual mutations were calculated and shown on the Fig. III-2. Mutations in VcLysM1 at both Val53 and Thr55 resulted in unfavorable contributions to binding
thermodynamics. When ΔH˚ and TΔS˚ are compared between (GlcNAc)3, (GlcNAc)4,
(GlcNAc)5 and (GlcNAc)6, effects on mutation at Val53 are larger than the mutation at
Thr55 for (GlcNAc)4,5, but are smaller for (GlcNAc)6, indicating certain gap in the
binding modes between (GlcNAc)4,5 and (GlcNAc)6.
Entropy changes for (GlcNAc)4, (GlcNAc)5 and (GlcNAc)6 were plotted against
enthalpy changes on the Fig III-3. No entropy-enthalpy compensation (EEC) was
observed between (GlcNAc)4, (GlcNAc)5 and (GlcNAc)6. However, EEC was observed
between VcLysM1 and VcLysM1 V53N for each oligosaccharide suggesting that the interactions contributing to the binding to VcLysM1 and VcLysM2-A119T are similar from each other.
Figure III-2. Effects of mutations on two mutation sites, 53/117 and 55/119. Difference in affinities are shown as blank, striped and black bar representing differences in
binding affinities against (GlcNAc)4, (GlcNAc)5 and (GlcNAc)6, respectively. From left
to right, these bars represent effects of mutations at the first (Val53), second (Thr55) and both on VcLysM1 and inverse of them on VcLysM2.
Figure III-3. EEC of VcLysMs-(GlcNAc)3-6 binding. Symbols: open rectangle;
VcLysM1, open triangle; VcLysM1 V53N, closed rectangle; VcLysM1 T55A; closed triangle; VcLysM2. Numbers Solid lines represent EEC between VcLysM1 and
VcLysM1 V53N upon binding to (GlcNAc)4, (GlcNAc)5 and (GlcNAc)6
-4 -3 -2 -1 0 1 2 3 4 5 Δ H (k cal mol -1) -3 -2 -1 0 1 2 3 4 5 T Δ S (k cal mol -1) -1.5 -1 -0.5 0 0.5 1 1.5 2 Δ G (k cal mol -1) (A) (B) (C) VclysM1 VclysM2 V53N T55A V53N/ T55A N117V A119T N117V/A119T VclysM1 VclysM2 V53N T55A V53N/ T55A N117V A119T N117V/A119T V53N T55A V53N/ T55A N117V A119T N117V/A119T VclysM1 VclysM2 -4 -3 -2 -1 0 -12 -11 -10 -9 -8 -7 -6 -5 T Δ S (kc al m ol -1) ΔH (kcal mol-1) 4 5 6 4 5 6 4 5 6 4 5 6
Circular dichroism VcLysMs
CD spectra were compared between VcLysMs ranging from 200-260 nm (Fig III-4). All proteins showed peaks around 207 nm and 222 nm, which are characteristic to α-helical structures, as was speculated from βααβ structure conserved for LysMs. Sharp increases at the shorter edges of wavelength indicate correct folding of proteins. Spectra of VcLysM1 and VcLysM2 are deviated from each other and those of the two intermediate mutants were those in between of VcLysM1 and VcLysM2, suggesting that the two mutated residues may be structural factors affecting the binding affinities. Since structural deviations were suggested from CD spectra, we decided to determine the solution structures of VcLysM1 and VcLysM2 to get insights into the structure-function relationship.
Figure III-4. Circular dichroism of VcLysMs. Molar elipticity ranging frpm 200 to 260 nm were plotted against the wave length. Solid ( ), dashed ( ), dashed dotted ( ) and dotted ( ) lines correspond to VcLysM1, VcLysM1 V53N, VcLysM1 T55A and VcLysM2, respectively. -8000 -6000 -4000 -2000 0 2000 4000 6000 8000 10000 12000 200 210 220 230 240 250 260 θ ( deg cm 2 d mol -1) Wavelength (nm) WT N117V A119T N117V-A119T VcLysM1 VcLysM1 V53N VcLysM1 T55A VcLysM2
Solution structures of VcLysM1 and VcLysM2
Solution structures of VcLysM1 and VcLysM2 were successfully determined. Statistics of top 20 structures with lowest target function is shown on the table III-4. As we can see on the Fig III-5, well-converged structures were obtained for both LysMs and the main chain RMSD of VcLysM1 and VcLysM2 were 0.51 and 0.53 Å, respectively. Structural validation with PSVS (Protein Structure Validation Suite) showed that 90.0 %, 10.0 %, 0.0 % and 0.0 % of ϕ-ψ angles of VcLysM1 and 89.1 %, 10.8 %, 0.0 % and 0.0 % of ϕ-ψ angles of VcLysM2 were in most favorable, additionally allowed, generously allowed and disallowed region, respectively. Although all of criteria based on softwares in PSVS showed acceptable Z-scores (-5<Z) for VcLysM1 (-2.57, -0.79, -1.49, -3.49 and -0.39 for Verify3D, ProsaII, Procheck (ϕ-ψ), Procheck (all dihedral angles) and Molprobity Clashscore) and VcLysM2 (-1.93, -0.66, -1.85, -3.96 and -1.55, respectively for the same softwares for VcLysM1), Z-scores for both proteins were deviated from the recommended value (-3<Z). I assumed that these deviations were simply due to the dynamic character of proteins since these criteria are based on crystal structures with relatively high resolution (<1.80 Å) as was also mentioned by Bhattacharya and coworkers. Since the other criteria showed good proximity to the mean values of each data set, these structures were used for further analyzes.
Superposition of solution structures of VcLysM1 and VcLysM2 in Fig. 5 showed high structural homology between these two structures (RMSD=0.53 Å). Backbone traces well overlapped except the loop region between α2 and β2, where Val53 and
Thr55 are located. I also could see the effect of deviation in 1H-15N HSQC spectra, in
Table III-4. Structural statistics of best 20 structures.
VcLysM1 VcLysM2
NMR distance and dihedral restrains
Total unambiguous NOE 687 721
Hydrogen-bond restraints 32 32
Dihedral angle restraints
Phi constraints 108 108 Psi constraints 108 108 Structural statistics Pairwise RMSDs (mean ± SD) Heavy atoms (Å) 0.93 ± 0.10 0.90 ± 0.14 Backbone atoms (Å) 0.51 ± 0.10 0.53 ± 0.16 Ramachandran statistics (%)
Residues in most favorable regions 90.0 89.2
Residues in additionally allowed regions 10.0 10.8
Residues in generously allowed regions 0.0 0.0