Original
Positron Emission Tomography/Computed Tomography before
Treatment as a Predictor of
90Y-Ibritumomab Tiuxetan Response
Ryan Yudistiro
1,2, Yusri Dwi Heryanto
1, Sayaka Kodaira
1, Tetsuya Higuchi
1, Yukiko Arisaka
1,
Azusa Tokue
1, Ayako Taketomi-Takahashi
1, Norifumi Tsukamoto
3, Akihiko Yokohama
4,
Hiroshi Handa
5, Hiromi Koiso
6, Takuma Ishizaki
5and Yoshito Tsushima
11 Department of Diagnostic Radiology and Nuclear Medicine, Gunma University Graduate School of Medicine, 3-39-22 Showa-machi, Mae-bashi, Gunma 371-8511, Japan
2 Department of Nuclear Medicine, MRCCC Siloam Hospital, School of Medicine of Universitas Pelita Harapan, Jakarta, Indonesia 3 Oncology Center, Gunma University Hospital, 3-39-15 Showa-machi, Maebashi, Gunma 371-8511, Japan
4 Blood Transfusion Services, Gunma University Hospital, 3-39-15 Showa-machi, Maebashi, Gunma 371-8511, Japan 5 Department of Hematology, Gunma University Hospital, 3-39-15 Showa-machi, Maebashi, Gunma 371-8511, Japan
6 Infection Control and Prevention Center, Gunma University Hospital, 3-39-15 Showa-machi, Maebashi, Gunma 371-8511, Japan
Abstract
Background and Aims: Radioimmunotherapy (RIT) appears as one of the most effective treatment options for patients with relapsed or resistant non-Hodgkin’s lymphoma (NHL). Our aim was to evaluate the role of pre-RIT 18 F-fluorode-oxyglucose-positron emission tomography╱computed tomography (FDG-PET╱CT) as an early predictor of 90 Y-Ibritum-omab tiuxetan treatment response. Methods: We included consecutive 20 patients with relapsed NHL (10 males; mean age, 58.5±8.9 years old) who were treated with 90Y-Ibritumomab tiuxetan. FDG-PET╱CT was performed before and after treatment. Semiquantitative parameters of all measurable FDG-avid lesions were measured and averaged. A measurable FDG-avid lesion was defined as a lesion that showed FDG uptake higher than liver with a diameter more than 1 cm. Treatment response was determined by visual assessment based on a five-point score criteria from FDG-PET╱CT after treatment. Results: Fourteen patients (70%) were classified as responders and the other six patients (30%) as non-responders. All semiquantitative parameters except for MTV demonstrated significantly lower values in the responders compared with the non-responders (p<0.05). Conclusions: Semiquantitative evaluation by SUVmax, SUVpeak, and TLG before treatment were useful as early predictors of 90Y-Ibritumomab tiuxetan treatment response.
Introduction
Non-Hodgkin’s lymphoma (NHL) is the most
common hematopoietic neoplasm with about 386,000 new cases in 2012 worldwide.1 The majority of NHL arises from B-cell that overexpress CD20 antigen.2 Although lymphomas may be classified or grouped in many ways, based on the growth rate, they may be grouped as indolent (slow growth rate) or aggressive (fast growth rate).
Patients with indolent NHL, including follicular B-cell NHL, tend to suffer relapses and become more resistant to therapy. Currently, chemotherapy,
molecu-lar targeting therapy, and radiotherapy are the standards of NHL treatment. However, unlike in aggressive NHL, treatment options for patients with relapsed or resistant indolent NHL remain complicated.3,4
Radioimmunotherapy (RIT) has appeared as one of the most effective treatment options for patients with relapsed or resistant indolent NHL.5,6 RIT is a combi-nation treatment of radionuclide and immunotherapy and may have better therapeutic outcomes through crossfire and bystander effects.7,8 90Y-Ibritumomab tiuxetan and 131I-tositumomab are the first RITs, which have been approved by the United States Food and Drug Adminis-tration (FDA) for the treatment of relapsed and refrac-tory low-grade, follicular, or transformed B-cell NHL.6,7 Article Information Key words: non-Hodgkin lymphoma, radioimmunotherapy, 90Y-Ibritumomab tiuxetan, FDG-PET╱CT, response predictor Publication history: Received: May 23, 2018 Revised: May 31, 2018 Accepted: June 7, 2018 Corresponding author: Ryan Yudistiro
Department of Diagnostic Radiology and Nuclear Medi-cine, Gunma University Graduate School of MediMedi-cine, 3-39-22 Showa-machi, Maebashi, Gunma 371-8511, Japan Tel: +81─27─220─8401
FDG-PET/CT for RIT predictor Clinical trials of RIT in relapsed or resistant indolent
NHL demonstrated high response rates and durability of remission with well tolerated side effects and toxici-ties.5,9,10 Although the high efficacy of RIT in patients with relapsed or resistant indolent NHL has already been well established, long-term toxicity, high cost, and the availability of RIT are still the potential drawbacks in the clinical setting.11 A pre-treatment predictor of favorable outcomes for RIT would have high clinical utility.
18F-Fluorodeoxyglucose positron emission tomogra-phy╱computed tomography (FDG-PET╱CT) has been widely used and recommended as a main imaging modality in FDG-avid lymphoma. It has been reported that FDG-PET╱CT may improve the accuracy of initial staging, prognostic assessment, treatment planning, and treatment response monitoring of lymphoma.12,13 It has been also reported that FDG-PET╱CT performed after
two cycles of chemotherapy (interim FDG-PET╱CT),
had prognostic value in NHL patients.14,15 However, the role of FDG-PET╱CT before treatment as an early RIT response predictor has yet to be confirmed. The pur-pose of this study was to evaluate pre-RIT FDG-PET╱
CT as an early predictor of 90Y-Ibritumomab tiuxetan treatment.
Materials and Methods
Patients
A retrospective study was performed in twenty patients who underwent 90Y-Ibritumomab tiuxetan (Zevalinʀ; 0.3-0.4 mCi╱kg body weight; Fuji Film RI
Pharma Co. Ltd, Tokyo, Japan) RIT for relapsed or resis-tant indolent NHL from 2009 to 2014 in our institution.
All patients had FDG-PET╱CT at least six months before and after treatment. We excluded patients who had no FDG-PET╱CT within six months after treatment, patients with non-FDG-avid lymphoma, and patients who were not followed after treatment. Patients were followed until 1 March 2017. Our database and electronic charts were retrospectively reviewed to obtain follow-up data.
The study protocol was approved by our institutional review board, and written informed consent was obtained from each patient before they were enrolled in this study.
Imaging protocol
18F-FDG was produced in our cyclotron facility. The patients fasted for at least six hours, and were free of alcohol and caffeine for 12 hours. One hour after intravenous injection of 18F-FDG (5 MBq╱kg), FDG-PET╱CT scans were performed with the Discovery STE (GE Healthcare, United States) or Biograph 16 (Siemens Medical Solutions, United States), with a field of view (FOV) of 700-mm and slice thickness of 3.27 mm. The CT was acquired to correct PET transmission using the following parameters: 140 kV, 120-240 mAs, and 128×
128 matrix. Patients were scanned from head to thigh.
Shallow breathing was advised to avoid motion artifacts and to minimize misregistration of CT and PET images.
Intravenous iodinated contrast media were not adminis-tered for CT scanning, and images were reconstructed by
a conventional filtered back projection method. Axial full width at half maximum (FWHM) of 1 cm from the centre of the FOV was 6.3 mm. Intrinsic system
sensi-tivity was 8.5 eps╱kBq for 3-dimensional acquisition.
Image analysis
FDG-PET╱CT images before and after treatment were retrospectively reviewed by two experienced nuclear medicine physicians (SK and HT) who were blinded to all other imaging and clinical information.
Semiquantitative parameters were obtained from a two-dimensional region of interest (2D-ROI) and three-dimensional volume of interest (3D-VOI). Adap-tive-threshold of 41% was used in 3D-VOI (Fig. 1) to measure maximum and mean standardized uptake value (SUVmax and SUVmean) and metabolic tumor volume (MTV). Total lesion glycolysis (TLG) was obtained
from the equation [SUVmean]×[MTV]. The
SUVmax and SUVpeak were obtained from 2D-ROI FDG-PET╱CT images (Fig. 2A). SUVpeak was defined as an average value of SUV, which was measured in a circle ROI (fixed diameter of 1.2 cm), and placed at the hottest lesion area (Fig. 2B). These semiquantitative parameters of all measurable FDG-avid lesions from each patient were averaged and analyzed. A measur-able FDG-avid lesion was defined as a lesion that showed FDG uptake higher than liver and a diameter more than 1 cm.
We followed the Lugano classification, a visual assessment based on a five-point score criteria from FDG-PET╱CT after treatment,12 to evaluate treatment
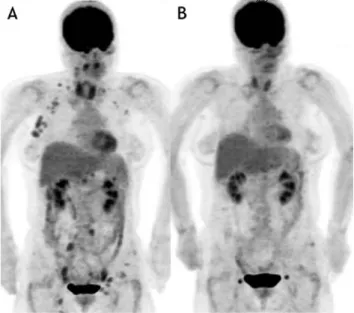
Fig. 1 Responder FDG-PET╱CT images
A 57-years-old female patient showed relapse of follicular lymphoma four years after her last chemotherapy. In her pre-RIT FDG-PET╱CT [A], multiple FDG-avid lesions were seen above and below the diaphragm. Some FDG-avid lesions in left axilla, pelvic, and inguinal regions were not analyzed since FDG uptake was lower than the liver. Complete response was seen on FDG-PET╱CT three months after treatment (B). This patient was classified as a responder.
assessment, mediastinal blood pool and liver were used as threshold organs. Responders were defined as
patients whose measurable FDG-avid lesions disap-peared, or whose visual score(s) of the residual FDG-avid lesion(s) (scored ≤ 3) decreased. Non-responders
lesions (score ≥ 4 without significant change in FDG uptake) or appearance of new FDG-avid lesion(s).
Statistical analysis
Mann-Whitney U-test was used to compare the responders and non-responders for each parameter. The area under a receiving-operator-curve (ROC) was used to assess the accuracy and to infer the optimum cut-off values of each parameter for predicting response.
Fischer exact test was also used. The survival curve was estimated using the Kaplan-Meier method. Overall survival was defined as the time from RIT until death from any cause. All statistical analyses were performed using GraphPad Prism version 7.00 (GraphPad Software, Inc., CA) and SPSS version 23 (SPSS, Inc., Chicago, IL), and p-value<0.05 was considered significant.
Results
The patients’ characteristics are summarized in
Table 1. Interval time between FDG-PET╱CT before treatment to RIT for all subjects was 2 ± 1.3 (range: 1 - 6) months. According to FDG-PET╱CT after treatment, fourteen patients (70%) were classified as responders, whereas six patients (30%) were non-responders.
Before RIT, twelve patients (60%) had early stage (stage I╱II) disease and eight patients (40%) had advanced stage (stage III╱IV) disease. There was no difference in pathological diagnosis or grade between two groups. A total of 74 FDG-avid lesions were analyzed, and the average number and length diameter of the FDG-avid lesions did not differ between responder and non-re-Table 1 Patient characteristics
Characteristic Responder Non-responder Total p-value*
Patient gender 14 6 20 N.S
Male 7 3 10 N.S
Female 7 3 10 N.S
Lesions
Number per patient¥ 3.7±2.8 (1-10) 4.3±2.4 (1-7) 3.7±2.6 (1-10) N.S
Length diameter (mm)¥ 19.3±10.1 (10.1-50.1) 29.0±8.6 (16.8-35.6) 22.2±10.5 (10.1-50.1) N.S Non-Bulky 48 24 72 N.S Bulky‡ 0 2 2 N.S Patient age <60 6 4 10 N.S >60 8 2 10 N.S Histopathology Follicular 13 6 19 N.S Mantle cell 1 0 1 N.S Grade 1 or 2 11 2 13 N.S 3 1 2 3 N.S Not available 2 2 4 N.S
Stage before RIT
I-II 9 3 12 N.S
III-IV 5 3 8 N.S
N.S=Not Significant; RIT: radioimmunotherapy ¥Mean ± standard deviation (range); Mann-Whitney U-test ‡Bulky lesion =>6 cm in length-diameter *Fischer exact test
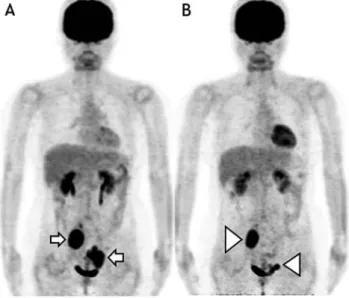
Fig. 2 Non-responder FDG-PET╱CT images
A 50-years-old female patient showed relapse of follicular lymphoma two years after her last course of chemotherapy. In her pre-RIT FDG-PET╱CT [A], two bulky FDG-avid lesions were seen in the pelvic region (white arrow). Residual bulky FDG-avid lesions (white arrowhead) [B], decreased in size, were still seen in FDG-PET╱CT at three months after treatment. This patient was classified in a non-responder.
FDG-PET/CT for RIT predictor
sponder groups. All lesion in responders were non-bulky lesions, and only two non-bulky lesions were observed in one non-responder.
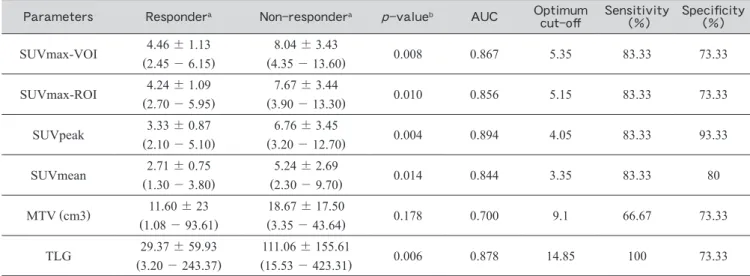
Table 2 shows the results of semiquantitative
param-eters of pre-RIT FDG-PET╱CT. All these semiquanti-tative parameters except for MTV demonstrated significantly lower values in the responders compared to the non-responders (p<0.05). The optimal cut-off values identified by ROC analysis for both SUVmax using 3D-VOI and 2D-ROI were 5.35 and 5.15, respec-tively, with the same values for sensitivity and specificity of 83.3% and 71.3%. Meanwhile, the optimal cut-off values for SUVpeak and TLG was 4.35 and 19.5 gram, respectively, with sensitivity and specificity for SUVpeak of 83.3% and 92.9% and both 100% for TLG (Fig. 3).
The cut-off of TLG was not only useful for predicting RIT response, but also prognosis. Patients with TLG
less than 19.5 gram showed a significantly higher
per-centage of 7-year overall survival (50% versus 100%, p
<0.01) and longer median survival time (66 months vs
undefined, p<0.01) (Fig. 4). The other
semiquantita-tive parameters did not show a significant difference in survival analysis.
Discussion
Our data demonstrated that all patients who responded to RIT had significantly lower values of all semiquantitative parameters on pre-RIT FDG-PET╱CT except for MTV.
It has been reported that higher FDG-avidity was correlated with more aggressive lesions,16,17 and this may be due to overexpression of glucose transporter-3 (GLUT-3).16-18 We suspect that our finding might reflect a transformation of lymphoma in non-responder patients to more aggressive subtypes, although we do not have Table 2 Semiquantitative parameters of pretherapy FDG-PET╱CT in predicting RIT treatment response
Parameters Respondera Non-respondera p-valueb AUC Optimum
cut-off Sensitivity (%) Specificity (%) SUVmax-VOI 4.46±1.13 (2.45-6.15) 8.04±3.43 (4.35-13.60) 0.008 0.867 5.35 83.33 73.33 SUVmax-ROI (2.704.24±-1.095.95) (3.907.67-±13.30)3.44 0.010 0.856 5.15 83.33 73.33 SUVpeak 3.33±0.87 (2.10-5.10) 6.76±3.45 (3.20-12.70) 0.004 0.894 4.05 83.33 93.33 SUVmean 2.71±0.75 (1.30-3.80) 5.24±2.69 (2.30-9.70) 0.014 0.844 3.35 83.33 80 MTV (cm3) (1.0811.60-±93.61)23 (3.3518.67-±43.64)17.50 0.178 0.700 9.1 66.67 73.33 TLG 29.37±59.93 (3.20-243.37) 111.06±155.61 (15.53-423.31) 0.006 0.878 14.85 100 73.33 AUC=area under the curve; SUVmax=maximum Standardized Uptake Value; VOI=Volume of Interest; ROI=Region of Interest; MTV=Metabolic Tumor Volume; TLG=Total Lesion Glycolysis; a=mean±standard deviation (range); b=Mann-Whitney test
Fig. 3 ROC curve of FDG-PET╱CT before RIT
The area under a ROC of the semiquantitative parameters of pre- RIT FDG-PET╱CT
Fig. 4 Kaplan-Meier Curve of TLG before RIT
High TLG showed lower 7-years OS (50% vs 100%, p< 0.01) and shorter median survival time (66 months vs undefined, p<0.01).
SUVmax was slightly lower than other studies that showed SUV of>10 as a threshold in differentiating
between indolent and aggressive of NHL.17,19 Lym-phoma cells in mass lesions may not be homogeneous, possibly containing more aggressive cells generated by transformation. The presence of these aggressive cells is likely to determine the potential tumor aggressiveness, rather than the total number of lymphoma cells or the total volume of tumors. In the current study, SUVs and TLG also reflect the viable cell density of lesions which are useful for predicting treatment response. Mean-while, MTV was not useful for predicting treatment response. This difference may partially support our suggestion concerning transformation, and our results are consistent with previous reports.20,21
All FDG uptake parameters, including SUVmax
(from both ROI and VOI) and SUVpeak, showed signifi-cant differences between responders and non-responders.
These parameters reflect viable cell density and aggres-siveness of lesions, although each parameter has its lim-itations. The most widely used parameter in the clinical setting is SUVmax, i.e. the SUV value of the maximum intensity voxel within a defined subspace of a PET image. SUVmax is simple and highly reproducible, but strongly affected by noise and partial volume effect that will underestimate values in small tumors.22 SUVpeak, which was not used in previous studies, was significantly lower in responders in our study. SUVpeak has been recently proposed as a more robust alternative of SUVmax, since SUVpeak is the most reliable parameter for FDG-avid tumor quantification regardless of acquisi-tion time.23 Additional quantitative information from SUVmax and SUVpeak values may strengthen the posi-tion of pre-RIT FDG-PET╱CT as an imaging biomarker for early treatment response prediction.
Some studies have suggested that metabolic tumor burden such as MTV and TLG may be better predictors of survival than FDG uptake parameters such as SUV in malignancy including NHL.24,25 However, in our find-ings, only TLG was an early RIT response predictor with excellent sensitivity and specificity. Moreover, low TLG values indicated a significantly higher 7-year over-all survival and longer median survival time, indicating TLG is not only a short-term but also a long-term prog-nostic predictor. MTV reflects the disease burden;
meanwhile, TLG is a volumetric measure that combines not only metabolic tumor burden but also the metabolic intensity and reflects average SUV volume. This find-ing of TLG befind-ing more reliable than MTV may support our suggestion that lesion metabolic intensity and aggressiveness contributed more to RIT response than lesion burden.
It has been reported that 111In-Ibritumomab tiuxetan accumulation also correlated with overall response rate and disease progression. The heterogenous intratu-moral distribution of 111In-Ibritumomab tiuxetan using single photon emission computed tomography (SPECT) correlated with tumor treatment response. Although
SUVmax showed a positive correlation with 111
In-ibritu-distribution of FDG-PET╱CT before treatment was not significantly different between responders and non-re-sponders.21 In another recent study, the heterogeneity of intratumoral measurement using texture parameters and histogram indices in FDG-PET╱CT were useful as treatment response predictors for several types of cancer,24,26 although we need to clarify their usefulness in NHL.
Currently, there are many treatment options avail-able for advanced stage or relapsed NHL patients.
Although Rituximab has changed the clinical pathway of NHL patients, RIT has been also demonstrated higher response rates either when used as single or consolida-tion therapy for the initial treatment.27,28 Therefore, an early predictive biomarker is needed to select patients who are most likely to benefit for RIT. From our study,
we suspect that patients with SUVmax, SUVpeak, and TLG above the cut-off values of pre-RIT FDG-PET╱CT may not be appropriate candidates for RIT, and other treatment options should be considered.
There were several limitations in our study. First, our study was retrospectively performed and included a small number of inhomogeneous patients with skewed distribution. Our results should be confirmed by further prospective studies with a large number of patients.
Second, we did not compare our method with other clin-ical risk stratification methods. Thirdly, we used FDG-PET╱CT imaging protocol commonly used in clinical practice. Quantification of the semiquantitative param-eters employed in our study was sensitive to ROI and VOI definition. In our study, however, inter-observer
agreement was not tested.
Conclusion
We found that the semiquantitative parameters of FDG-PET╱CT before RIT treatment had significantly lower values in responders compared to non-responders, supporting the potential of pre-treatment FDG-PET╱CT as a valuable imaging biomarker for early prediction of RIT response. In particular, TLG may not only predict short-term response but also long-term prognosis. Fur-ther prospective studies with a larger number of patients are encouraged.
Conflicts of interest
The authors declare that they have no conflict of financial and non-financial interest.
References
1. Ferlay J, Soerjomataram I, Dikshit R, et al. Cancer inci-dence and mortality worldwide: Sources, methods and major patterns in GLOBOCAN 2012. Int J Cancer 2015; 136: E359-E386.
2. Prevodnik VK, Lavren J, Horvat M, et al. The predictive significance of CD20 expression in B-cell lymphomas. Diagn Pathol 2011; 6: 1-6.
FDG-PET/CT for RIT predictor staging, and treatment. Semin Oncol 2003; 30: 3-9..
4. Bodet-Milin C, Eugène T, Gastinne T, et al. The role of FDG-PET scanning in assessing lymphoma in 2012. Diagn Interv Imaging 2013; 94: 158-168.
5. Witzig TE. Randomized controlled trial of yttrium-90-la-beled ibritumomab tiuxetan radioimmunotherapy versus rit-uximab immunotherapy for patients with relapsed or refractory low-grade, follicular, or transformed B-cell non-Hodgkin’s lymphoma. J Clin Oncol 2002; 20: 2453-2463.
6. Juweid ME. Radioimmunotherapy of B-cell non-Hodgkin’s lymphoma: from clinical trials to clinical practice. J Nucl Med 2002; 43: 1507-1529.
7. Gregory S a, Hohloch K, Gisselbrecht C, et al. Harnessing the energy: development of radioimmunotherapy for patients with non-Hodgkin’s lymphoma. Oncologist 2009; 14: 4-16. 8. Cheson BD. Radioimmunotherapy of non-Hodgkin
lym-phomas. Blood 2003; 101: 391-398.
9. Kaminski MS, Estes J, Zasadny KR, et al. Radioimmuno-therapy with iodine (131)I tositumomab for relapsed or refractory B-cell non-Hodgkin lymphoma: updated results and long-term follow-up of the University of Michigan expe-rience. Blood 2000; 96: 1259-1266.
10. Davies a J. Radioimmunotherapy for B-cell lymphoma: Y90 ibritumomab tiuxetan and I(131) tositumomab. Oncogene 2007; 26: 3614-3628.
11. Bentz M. Where does 90Y-ibritumomab tiuxetan
radioimmu-notherapy fit ? Selecting the right patient. Hematol Meet Reports 2007; 1: 61-68.
12. Cheson BD, Fisher RI, Barrington SF, et al. Recommenda-tions for initial evaluation, staging, and response assessment of hodgkin and non-hodgkin lymphoma: The lugano classifi-cation. J Clin Oncol 2014; 32: 3059-3067.
13. Barrington SF, Mikhaeel NG, Kostakoglu L, et al. Role of imaging in the staging and response assessment of lym-phoma: Consensus of the international conference on malig-nant lymphomas imaging working group. J Clin Oncol 2014; 32: 3048-3058.
14. Rossi C, Kanoun S, Berriolo-Riedinger A, et al. Interim 18F-FDG PET SUVmax reduction is superior to visual analy-sis in predicting outcome early in Hodgkin lymphoma patients. J Nucl Med 2014; 55: 569-573.
15. Jung S-H, Ahn J-S, Kim Y-K, et al. Prognostic significance of interim PET╱CT based on visual, SUV-based, and MTV-based assessment in the treatment of peripheral T-cell lym-phoma. BMC Cancer 2015; 15: 198.
16. Weiler-Sagie M, Bushelev O, Epelbaum R, et al. (18)F-FDG
avidity in lymphoma readdressed: a study of 766 patients. J Nucl Med 2010; 51: 25-30.
17. Schoder H. Intensity of 18fluorodeoxyglucose uptake in
pos-itron emission tomography distinguishes between indolent and aggressive non-Hodgkin’s lymphoma. J Clin Oncol 2005; 23: 4643-4651.
18. Szablewski L. Expression of glucose transporters in can-cers. Biochim Biophys Acta - Rev Cancer 2013; 1835: 164-169.
19. Ngeow JYY, Quek RHH, Ng DCE, et al. High SUV uptake on FDG-PET╱CT predicts for an aggressive B-cell lymphoma in a prospective study of primary FDG-PET╱CT staging in lymphoma. Ann Oncol 2009; 20: 1543-1547.
20. Cazaentre T, Morschhauser F, Vermandel M, et al. Pre-ther-apy 18F-FDG PET quantitative parameters help in predicting the response to radioimmunotherapy in non-Hodgkin lym-phoma. Eur J Nucl Med Mol Imaging 2010; 37: 494-504. 21. Hanaoka K, Hosono M, Tatsumi Y, et al. Heterogeneity of
intratumoral 111In-ibritumomab tiuxetan and 18F-FDG distri-bution in association with therapeutic response in radioimmu-notherapy for B-cell non-Hodgkin’s lymphoma. EJNMMI Res 2015; 5: 1-7.
22. Soret M, Bacharach SL, Buvat I. Partial-volume effect in PET tumor imaging. J Nucl Med 2007; 48: 932-945. 23. Sher A, Lacoeuille F, Fosse P, et al. For avid glucose
tumors, the SUV peak is the most reliable parameter for [18F] FDG-PET╱CT quantification, regardless of acquisition time. EJNMMI Res 2016; 6: 21.
24. Bai B, Bading J, Conti PS. Tumor quantification in clinical positron emission tomography. Theranostics 2013; 3: 787-801.
25. Tateishi U. PET╱CT in malignant lymphoma: Basic infor-mation, clinical application, and proposal. Int J Hematol 2013; 98: 398-405.
26. Orlhac F, Soussan M, Maisonobe J-A, et al. Tumor texture analysis in 18F-FDG PET: Relationships between texture parameters, histogram indices, standardized uptake values, metabolic volumes, and total lesion glycolysis. J Nucl Med 2014; 55: 414-422.
27. Scholz CW, Pinto A, Linkesch W, et al. 90 Yttrium-ibritum-omab-tiuxetan as first-line treatment for follicular lymphoma: 30 months of follow-up data from an international multicenter phase II clinical trial. J Clin Oncol 2013; 31: 308-313. 28. Sánchez Ruiz AC, de la Cruz-Merino L, Provencio Pulla M.
Role of consolidation with yttrium-90 ibritumomab tiuxetan in patients with advanced-stage follicular lymphoma. Ther Adv Hematol 2014; 5: 78-90.