D10
Selection of Regional Frequency Distribution using Simulated Flood Data
〇Binaya Kumar Mishra, Kaoru Takara, Yosuke Yamashiki, Yasuto Tachikawa
1. Introduction
At-site flood frequency analysis is used in estimation of return period flood at gauged locations with long period of record. However, gauged locations rarely coincide with the locations at which return flood estimation is required. In such situation, regional flood frequency analysis, which utilizes regional hydrologic characteristics, can be used in reliable estimation of return period flood. Delineation of hydrologic homogeneous region, selection of regional frequency distribution and estimation of index flood (scale factor) are three major steps.
This study deals with selection of regional frequency distribution in each of the previously delineated five hydrologic regions inside the Nepalese territory. Presence of adequate hydrological station is essential in each of the regions for suitable selection of regional frequency distribution. However, there are only two hydrological stations in two of the five hydrological regions (Fig.1). To address the limitation of hydrological stations, hydrological simulation was carried out in the two regions using a suitably calibrated rainfall runoff model SimHyd.
Fig.1 Hydrological homogeneous regions of Nepal.
2. Hydrologic simulation
SimHyd, a lumped conceptual rainfall runoff model, was calibrated using data of gauged basin. The calibrated model was used in generating synthetic flood data in ungauged river basins using relevant daily rainfall and areal potential evapotranspiration (PET). With the generation of synthetic annual maximum discharge data, there are five data basins in each of the regions 2 and 5 respectively.
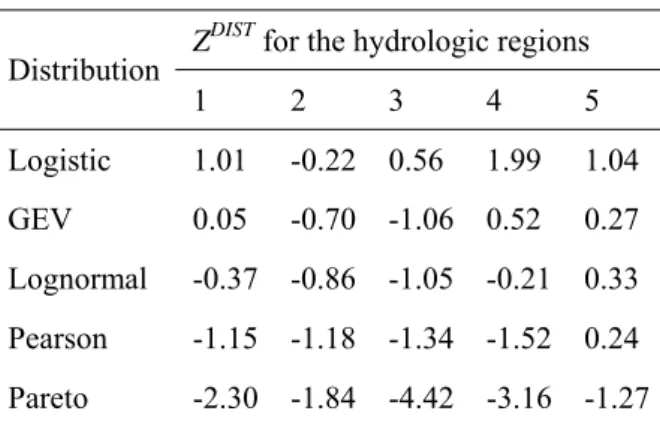
3. Selection of regional frequency distribution Appropriate regional frequency distribution was selected using goodness-of-fit measure ZDIST. This
measure judges how well the L-skewness and
L-kurtosis of a fitted distribution matches the
regional average L-skewness and L-kurtosis values obtained from the flood data. A given distribution is declared of good fit if |ZDIST| ≤ 1.64. While a number of distributions may qualify the goodness of fit measure criteria, the most potential will be the one that has the minimum |ZDIST| value. Goodness of fit values (ZDIST) is presented for the different 3-parameter distributions (Table 1).
Table 1 Goodness of fit for different distributions. ZDIST for the hydrologic regions Distribution 1 2 3 4 5 Logistic 1.01 -0.22 0.56 1.99 1.04 GEV 0.05 -0.70 -1.06 0.52 0.27 Lognormal -0.37 -0.86 -1.05 -0.21 0.33 Pearson -1.15 -1.18 -1.34 -1.52 0.24 Pareto -2.30 -1.84 -4.42 -3.16 -1.27