Studies on miRNAs-mediated Action Mechanisms
of Type I Interferon for Hepatic Stellate Cell
著者
關谷 由美子
year
2016
その他のタイトル
I型インターフェロンの肝星細胞に対するmiRNAを介
した作用メカニズムに関する研究
学位授与大学
筑波大学 (University of Tsukuba)
学位授与年度
2015
報告番号
12102甲第7746号
URL
http://hdl.handle.net/2241/00143899
Studies on miRNAs-mediated Action Mechanisms of Type I Interferon for Hepatic
Stellate Cell
A Dissertation Submitted to
the Graduate School of Life and Environmental Sciences,
the University of Tsukuba
in Partial Fulfillment of Requirements
for the Degree of Doctor of Philosophy in Biological Science
( Doctoral Program in Biological Sciences )
i
Table of Contents
Abstract... 1
Abbreviations ... 3
General Introduction ... 5
Chapter I: Effect of miR-29b on the activation and proliferation of HSCs ... 7
1. Introduction ... 7
2. Materials and methods ... 8
2.1. Cells ... 8
2.2. Transient transfection of a miR-29b precursor ... 8
2.3. Quantitative real-time PCR ... 8
2.4. Immunoblots ... 9
2.5. F-actin staining ... 10
2.6. Cell viability assay ... 10
2.7. Statistical analysis ... 11
3. Results and discussion ... 12
3.1. Expression of miR-29b in mouse HSCs during spontaneous activation ... 12
3.2. Effects of miR-29b overexpression on the activation of HSCs ... 12
3.3. Effect of miR-29b overexpression on number of HSCs ... 13
3.4. Effects of miR-29b overexpression on the ECM- and growth factor-related signaling in primary mouse HSCs ... 14
3.5. conclusion ... 15
4. Figures ... 16
Chapter II: miR-195-mediated effect of IFN on the proliferation of HSCs ... 21
1. Introduction ... 21
2. Materials and methods ... 22
ii
2.2. Cells ... 22
2.3. Transient transfection of miRNA precursors and inhibitors ... 23
2.4. Cell proliferation assay ... 23
2.5. Cell cycle analysis ... 23
2.6. Quantitative real-time PCR ... 24
2.7. Immunoblotting ... 24
2.8. Luciferase reporter assay ... 24
2.9. Statistical analysis ... 25
3. Results ... 26
3.1. Reduction of miR-195 expression during activation of primary-cultured HSCs ... 26
3.2. Effects of IFN-α and -β on proliferation of HSCs ... 26
3.3. Effects of IFN-α and -β on cell cycle distribution ... 27
3.4. Regulation of cyclin E1 and p21 expression by IFN-β ... 27
3.5. Regulation of miR-195 expression by IFN-β ... 27
3.6. Regulation of cyclin E1 and p21 expression by miR-195 ... 28
3.7. Interaction of miR-195 with cyclin E1 3’UTR in LX-2 cells ... 28
3.8. Regulation of cyclin E1 expression by IFN-β and miR-195 ... 29
4. Discussion ... 30 5. Table ... 33 6. Figures ... 34 General Discussion ... 41 Acknowledgements ... 43 References ... 44
1
Abstract
Hepatic stellate cells (HSCs) are considered as a major player in pathogeneses of hepatic fibrosis because they undergo a trans-differentiation into myofibroblastic cells termed “activation’’ in response to fibrogenic stimuli and produce excessive extracellular matrix (ECM). The characteristics of activated HSCs also include the active proliferation. Type I interferons (IFNs), generally applied for the therapy of eradication of hepatitis B and C viruses, were shown to have direct action on HSCs and suppress the activation, proliferation and production of ECM of HSCs. But the detailed molecular mechanisms of these effects of IFNs remain to be clarified. In this study, miRNAs-mediated action mechanisms of Type I IFNs for HSCs are investigated.
First, the effect of miR-29b, which was previously identified as IFN-inducible miRNA and mediated the suppressive effect of IFNs on ECM production, on activation and proliferation of HSCs was investigated. miR-29b was found to be down-regulated during culture in primary mouse HSCs. Overexpression of miR-29b blunted the increased expression of key genes such as α-SMA involved in the activation of HSCs, and led HSCs to remain in a quiescent state as evidenced by their quiescent star-like cell morphology. Overexpression of miR-29b also inhibited the cell proliferation in primary HSCs and human HSC line LX-2.
Furthermore, I identified miR-195 as a new IFN-responsible miRNA and investigated the effect on the proliferation of HSCs. miR-195 was prominently down-regulated in the proliferative phase of primary-cultured mouse HSCs. Supporting this fact, IFN-β induced miR-195 expression and inhibited the cell proliferation by delaying their G1 to S phase cell cycle progression in LX-2 cells. IFN-β down-regulated cyclin E1 and up-regulated p21 mRNA levels in LX-2 cells. Luciferase reporter assay revealed the direct interaction of miR-195 with the cyclin E1 3’ UTR. Overexpression of miR-195 lowered cyclin E1 mRNA and protein expression levels, increased p21 mRNA and protein expression levels, and inhibited cell proliferation in LX-2 cells. Moreover miR-195 inhibition restored cyclin E1 levels that were down-regulated by IFN-β.
2
I IFNs induced miR-29b and miR-195. The miR-29b was involved in the suppressive effect of IFNs on activation, proliferation and excess ECM production in HSCs and the miR-195 was involved in the antiproliferative effect of IFNs in HSCs.
3
Abbreviations
BSA: bovine serum albumin
CDK: cyclin-dependent kinase Col1a1: alpha 1 (I) collagen Col1a2: alpha 2 (I) collagen DDR: discoidin domain receptor DAPI: 40,6-diamidino-2-phenylindole DMEM: Dulbecco’s modified Eagle’s medium ECM: extracellular matrix
ERK: extracellular signal-regulated kinase FAK: focal adhesion kinase
FBS: fetal bovine serum
FN: fibronectin
GAPDH: glyceraldehyde-3-phosphate dehydrogenase HCC: hepatocellular carcinoma
HSC: hepatic stellate cell
IFN: interferon
IFNAR: type I interferon receptor ITGB1: integrin β1
miRNA: microRNA
PBS: phosphate buffered saline
PDGFR-β: platelet-derived growth factor receptor-β PI3K: phosphatidylinositol-3 kinase
SDS: sodium dodecyl sulfate
α-SMA: α-smooth muscle actin
4 TGF-β: transforming growth factor-β 3’UTR: 3’ untranslated region
5
General Introduction
Hepatic fibrosis occurs through the imbalance of wound healing and is characterized by excessive accumulation of extracellular matrices (ECM). This is a common feature of chronic liver diseases such as chronic viral hepatitis, alcoholic hepatitis and non-alcoholic steatohepatitis (NASH), which lead to hepatic cirrhosis and finally to hepatic carcinoma. But there are no drugs whose mechanism is based on the prevention of progress of fibrosis at present. Hepatic stellate cells (HSCs) are considered to play principal role in the fibrotic process. HSCs are located in the Disse space between hepatocytes and sinusoidal endothelial cells and surround the sinusoidal vessel. Under physiological conditions, HSCs maintain a quiescent phenotype. They store vitamin A and release it into blood vessel when necessary in peripheral tissue and control the hepatic sinusoidal microcirculation by their contraction and relaxation. When liver injury occurs, they become activated and
trans-differentiate into myofibroblastic cells, whose characteristics include the proliferation, loss of
vitamin A droplets, expression of α-smooth muscle actin (α-SMA), secretion of profibrogenic mediators and ECM (Bataller and Brenner, 2001; Friedman, 2000). Therefore, controlling the population and activation of HSCs should be a potential therapeutic target against liver fibrosis.
Interferons (IFNs) are cytokines with antiviral, immunomodulatory, and cell growth inhibitory effects. IFN-α and -β are classified as type I IFNs (Pestka et al., 1987; Uze et al., 2007), which are generally applied for the therapy of eradication of hepatitis B and C viruses. But studies using rodent models of hepatic fibrosis induced by chemical agents or diets suggested that IFNs have a antifibrotic potential independently of their antivirus activity (Chang et al., 2005; Fort et al., 1998; Inagaki et al., 2003; Tanabe et al., 2007). One of the targets of IFNs’ antifibrotic action is reported HSCs. For example, in vitro, IFN-α or -β is reported to suppress the α-SMA expression, the Col1a1 and Col1a2 mRNA expression and proliferation in HSCs (Inagaki et al., 2003; Mallat et al., 1995; Ogawa et al., 2009; Rao et al., 2010; Shen et al., 2002). Although some of these effects appear to be mediated by the control of Smad4 and Smad7 expression and the interaction between phosphorylated STAT1 and p300, the detailed molecular mechanisms of these effects of IFNs remain
6 to be clarified.
Recently, microRNAs (miRNAs), which are endogenous small non-coding RNA, have become a focus of interest as post-transcriptional regulators of gene expression through interaction with the 3’ untranslated region (3’UTR) of target mRNAs (Bartel, 2004). miRNAs are known to participate in cell proliferation, development, differentiation, and metabolism (Bartel, 2004). Moreover, it has been reported that expression of miRNAs could alter hepatic pathophysiology; miR-122 is involved in the IFN-β-related defense system against viral hepatitis C (Pedersen et al., 2007), and miR-26 is associated with survival and response to adjuvant IFN-α therapy in patients with hepatocellular carcinoma (HCC) (Ji et al., 2009a). Regarding HSCs, miR-15b and miR-16 are down-regulated upon HSC’s activation, and their overexpression induces apoptosis and a delay in the cell cycle (Guo et al., 2009a; Guo et al., 2009b). Knockdown of miR-27a and miR-27b in activated HSCs allowed a switch to a more quiescent phenotype and decreased cell proliferation (Ji et al., 2009b). miR-150 and miR-194 suppress proliferation, activation, and ECM production of HSCs (Venugopal et al., 2010). Recently, it was reported that miR-29b was induced by IFN and suppressed type I collagen production in LX-2 cells (Ogawa et al., 2010).
In this study, the effect of miR-29b on other characteristics of HSCs, activation and proliferation, besides excess ECM production was examined to reveal the importance of miRNA mediated mechanism of IFN action. Furthermore, I identified miR-195 as a new type I IFNs-responsible miRNA and investigated the effect on the proliferation of HSCs.
7
Chapter I: Effect of miR-29b on the activation and proliferation
of HSCs
1. Introduction
MicroRNAs participate in various biological phenomena, such as cell proliferation, development, differentiation, and metabolism (Bartel, 2004). miR-15, miR-16, miR-27, miR-150 and miR-194 has already proven to be player in the maintenance of HSCs functions (Guo et al., 2009a; Guo et al., 2009b; Ji et al., 2009b; Venugopal et al., 2010). Previously, I showed that miR-29b was induced by interferon treatment and that it suppressed type I collagen production by modulating the Col1a1 and SP1 expression in the human HSC line LX-2 (Ogawa et al., 2010). Moreover, Roderburg et al. reported that miRNAs in the miR-29 family were significantly decreased in the fibrotic liver tissue of humans and mice (Roderburg et al., 2011). Thus, it has been speculated that the change in the expression of miR-29 is closely related to the development of liver fibrosis. Although analyses of miR-29 functions were performed on ECM metabolism in these reports, the cells used in these experiments were immortalized cell lines that had already been activated and had become myofibroblastic, which does not always reflect miR-29 function in quiescent HSCs in vivo. Therefore, it is important to evaluate the effect of miR-29 on the activation of primary-cultured HSCs. These cells are known to undergo spontaneous activation and trans-differentiation into myofibroblastic cells in culture, similarly to those in vivo. Activated HSCs express α-SMA and produce fibrogenic mediators, such as type I collagen and transforming growth factor-β (TGF-β).
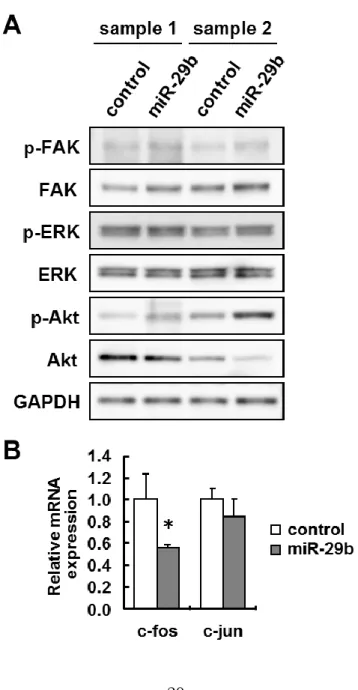
Here, I show the effects of miR-29b on the activation of HSCs using freshly isolated primary-cultured mouse HSCs. Overexpression of miR-29b suppressed cell viability and the expression of α-SMA. These effects seemed to be independent of the activation of focal adhesion kinase (FAK), extracellular signal-regulated kinase (ERK), and phosphatidylinositol-3 kinase (PI3K)–Akt, but were partially dependent on the reduction of c-fos mRNA.
8
2. Materials and methods 2.1. Cells
Primary HSCs were isolated from 12- to 16-week-old male C57BL/6N mice (Japan SLC Inc., Shizuoka, Japan) by pronase–collagenase digestion and subsequent purification by a single-step Nycodenz gradient, as previously described (Uyama et al., 2006). All animals received humane care, and the experimental protocol was approved by the Committee of Laboratory Animals according to institutional guidelines. Isolated HSCs were cultured on plastic dishes or glass chamber slides in Dulbecco’s modified Eagle’s medium (DMEM) (Sigma Chemical Co., St. Louis, MO, USA) supplemented with 10% fetal bovine serum (FBS) (Invitrogen, Carlsbad, CA, USA), 100 U/ ml penicillin, and 100 lg/ml streptomycin. The purity of cultures was evaluated by observation of the characteristic stellate cell shape using phase-contrast microscopy.
The human HSC line LX-2 was donated by Dr. Scott L. Friedman (Mount Sinai School of Medicine, New York, NY, USA) (Xu et al., 2005). LX-2 cells were maintained in DMEM as described above.
2.2. Transient transfection of a miR-29b precursor
The miR-29b precursor (Ambion, Austin, TX, USA), which was a double-strand RNA mimicking the endogenous miR-29b precursor, and a negative control (Ambion, Austin, TX, USA) were transfected into mouse HSCs and LX-2 cells using Lipofectamine RNAiMAX (Invitrogen, Carlsbad, CA, USA) at a final concentration of 10 nM in accordance with the manufacturer’s instructions. Briefly, the miRNA precursor and Lipofectamine RNAi-MAX were mixed at a ratio of 5 (pmol) : 1 (μl) in Opti-MEM I Reduced Medium (Invitrogen, Carlsbad, CA, USA), incubated for 20 min at room temperature, and then added to the cultures.
2.3. Quantitative real-time PCR
9
Fifty nanograms of total RNA was reverse-transcribed to cDNA using the ReverTra Ace qPCR RT Kit (Toyobo, Osaka, Japan) in accordance with the manufacturer’s instructions. Gene expression was measured by real-time PCR using cDNA, SYBR Green real-time PCR Master Mix (Toyobo, Osaka, Japan), and a set of gene-specific oligonucleotide primers [alpha 1 (I) collagen (Col1a1): forward 5’-CCTGGCAAAGACGGACTCAAC-3’, reverse 5’-GCTGAAGTCATAACCGCCACTG-3’; alpha 2 (I) collagen (Col1a2): forward 5’-AAGGGTCCCTCTGGAGAACC-3’, reverse
5’-TCTAGAGCCAGGGAGACCCA-3’; α-SMA: forward
5’-TCCCTGGAGAAGAGCTACGAACT-3’, reverse 5’-AAGCGTTCGTTTCCAATGGT-3’; discoidin domain receptor (DDR) 2: forward 5’-CGAAAGCTTCCAGAGTTTGC-3’, reverse
5’-GCTTCACAACACCACTGCAC-3’; fibronectin (FN) 1: forward
5’-GATGCCGATCAGAAGTTTGG-3’, reverse 5’-GGTTGTGCAGATCTCCTCGT-3’; β1 integrin
(ITGB1): forward 5’-CAACCACAACAGCTGCTTCTAA-3’, reverse
5’-TCAGCCCTCTTGAATTTTAATGT-3’; platelet-derived growth factor receptor-β (PDGFR-β): forward 5’-GCGTATCTATATCTTTGTGCCAGA-3’, reverse 5’-ACAGGTCCTCGGAGTCCAT-3’; c-fos: forward 5’-AGAAGGGGCAAAGTAGAGCA-3’, reverse 5’-CAGCTCCCTCCTCCGATT-3’;
c-jun: forward 5’-CCAGAAGATGGTGTGGTGTTT-3’, reverse
5’-CTGACCCTCTCCCCTTGC-3’; glyceraldehyde-3-phosphate dehydrogenase (GAPDH): forward 5’-TGCACCACCAACTGCTTAG-3’, reverse 5’-GGATGCAGGGATGATGTTC-3’] using an Applied Biosystems Prism 7500 (Applied Biosystems, Foster City, CA, USA). To detect miR-29b expression, the reverse transcription reaction was performed using a TaqMan microRNA Assay (Applied Biosystems, Foster City, CA, USA) in accordance with the manufacturer’s instructions. The expression level of GAPDH was used to normalize the relative abundance of mRNAs and miR-29b.
2.4. Immunoblots
10
sodium deoxycholate, 0.1% sodium dodecyl sulfate (SDS)] containing Protease Inhibitor Cocktail, Phosphatase Inhibitor Cocktail 1, and Phosphatase Inhibitor Cocktail 2 (Sigma). Proteins (2.5–10 μg) were electrophoresed in a 5–20% gradient SDS–polyacrylamide gel (ATTO Co., Tokyo, Japan) and were then transferred onto Immobilon P membranes (Millipore, Bedford, MA, USA). After blocking, the membranes were incubated with primary antibodies [mouse monoclonal antibody against α-SMA (Dako, Ely, UK); rabbit polyclonal antibody against type I collagen (Rockland Immunochemicals, Inc., Gilbertsville, PA, USA); rabbit polyclonal antibodies against PDGFR-β and GAPDH (Santa Cruz Biotechnology Inc., Santa Cruz, CA, USA); rabbit polyclonal antibodies against FAK and phospho-FAK (Y397) (Cell Signaling Technology Inc., Beverly, MA, USA); and mouse monoclonal antibodies against ERK, phospho-ERK (T202/Y204), Akt, and phospho-Akt (S473) (Cell Signaling Technology Inc., Beverly, MA, USA)] followed by peroxidase-conjugated secondary antibodies (Dako, Ely, UK). Immunoreactive bands were visualized by the enhanced chemiluminescence system (Amersham, Roosdaal, Netherlands) using a Fujifilm Image Reader LAS-3000 (Fuji Medical Systems, Stamford, CT, USA).
2.5. F-actin staining
HSCs on glass chamber slides were fixed in 4% paraformaldehyde in phosphate buffered saline (PBS) for 30 min and were permeabilized with 0.1% Triton X-100 in PBS for 5 min at room temperature. The nonspecific background signal was blocked with 1% bovine serum albumin (BSA) in PBS for 20 min. F-actin was stained with MFP488-phalloidin (Mobitec, Goettingen, Germany) in PBS with 1% BSA for 20 min. 40,6-diamidino-2-phenylindole (DAPI) (Dojindo Laboratories, Kumamoto, Japan) was used for counterstaining.
2.6. Cell viability assay
The cell viability was evaluated by the WST-1 assay based changes in absorbance at 450 nm. Freshly isolated mouse HSCs or LX-2 cells were plated in 96-well plates at a density of 1.5 × 10⁴ or
11
3 × 10³ cells/well, respectively. The following day, cells were transfected with the miR-29b precursor or a negative control as described above and were incubated for an additional 3 or 5 days before the assessment of cell viability. In another experiment, mouse HSCs that were transfected with the miR-29b precursor the day before were serum-starved overnight and then stimulated with PDGF-BB (10 ng/ml) (R&D Systems, Minneapolis, MO, USA). After incubation for 3 days, cell viability was assessed by the WST-1 assay.
2.7. Statistical analysis
Data presented as bar graphs are the means ± SD of at least three independent experiments. Statistical analysis was performed using the Student’s t-test, and P < 0.05 was considered to be statistically significant.
12
3. Results and discussion
3.1. Expression of miR-29b in mouse HSCs during spontaneous activation
At 1 day of culture after isolation, mouse HSCs adhered to plastic plates and exhibited round cell bodies with numerous lipid droplets similar to those observed in lipocytes (Fig. 1-1A). Cell bodies then began to gradually spread and flatten, increasing in size, and losing lipid droplets, resulting in the activated myofibroblastic phenotype (Fig. 1-1A). In addition to the changes in cell appearance, mRNA expression levels of α-SMA, Col1a1, Col1a2, FN1, DDR2, ITGB1, and PDGFR-β significantly increased at Days 4 and 7 of culture as compared to Day 1 (Fig. 1-1B). Immunoblot analyses confirmed the increases of type I collagen, α-SMA, and PDGFR-β protein levels at Days 4 and 7 (Fig. 1-1C). These molecules have already been reported to be up-regulated in activated HSCs and involved in fibrosis (Friedman, 2000). Thus, the primary mouse HSCs used in this study were in an activated state. Although TGF-β1 is known as a key regulator of collagen production and fibrosis (Bessell et al., 2001), its mRNA expression level in mouse HSCs remained unchanged due to an unknown reason in this study (Fig. 1-1B). In contrast, miR-29b expression in mouse HSCs was significantly decreased to 28% and 32% at Days 4 and 7, respectively, as compared to Day 1 (Fig. 1-1D). These findings raised the possibility that a reduction in miR-29b contributed to the up-regulation of the fibrosis-related genes listed above.
3.2. Effects of miR-29b overexpression on the activation of HSCs
To investigate this possibility, I next examined the effects of miR-29b overexpression on the activation of HSCs. Overexpression of miR-29b was achieved by the transient transfection of a synthesized miR-29b precursor, which was a double-strand RNA mimicking the endogenous miR-29b precursor. As shown in Fig. 1-2A, transfection of the miR-29b precursor markedly suppressed mRNA expression of Col1a1 and Col1a2 to 8% and 18%, respectively. Transfection significantly reduced mRNA expression of FN1 to 61% and also affected the expression of HSC activation-related molecules, such as α-SMA, DDR2, ITGB1, and PDGFR-β to 57%, 62%, 73%, and
13
42%, respectively. The TGF-β1 mRNA level was unaffected. At the protein level, expression of type I collagen, α-SMA, and PDGFR-β was suppressed by the overexpression of the miR-29b precursor (Fig. 1-2B). Col1a1, Col1a2, ITGB1, and PDGFR-β are predicted targets of miR-29b according to the miRNA target prediction databases TargetScan (http://www.targetscan.org/), miRBase (http://www. mirbase.org/), and mircrorna.org (http://www.microrna.org). Therefore, the suppression of these proteins might be due to the direct interaction of miR-29b with the 3’UTR of their corresponding mRNAs. Although α-SMA, DDR2, and FN1 are not predicted targets of miR-29b, their mRNA levels were suppressed. Thus, this effect was thought to be a secondary action of miR-29b over-expression. That is, it is suggested that miR-29b can not only target Col1a1, Col1a2, ITGB1, and PDGFR-β, but can also suppress the activation of HSCs by regulating other unidentified mechanisms, resulting in the suppression of α-SMA, DDR2, and FN1. In support of these results, morphological transformation from the quiescent to the myofibroblastic cell shape, as shown in Fig. 1-1A, was impeded in miR-29b precursor-transfected cells (Fig. 1-2C); miR-29b precursor-transfected cells exhibited star-like morphology with small cell bodies and slender dendritic processes as compared to negative control-transfected cells at Day 4. Staining with MFP-phalloidin, which labels F-actin, also confirmed cytoskeletal changes in miR-29b precursor-transfected HSCs. Taken together, these results suggest that miR-29b is able to suppress HSC activation as well as ECM expression.
3.3. Effect of miR-29b overexpression on number of HSCs
Activated HSCs are known to acquire proliferation abilities (Friedman, 2000; Bataller and Brenner, 2001). I considered the possibility that miR-29b was able to regulate the number of HSCs. As shown by the WST-1 assay, when the miR-29b precursor was transfected into HSCs at Day 1, the cell number observed at Day 4 was significantly reduced to 88% of the negative control-transfected cells (Fig. 1-2D). Treatment of HSCs with 10 ng/mL PDGF-BB, a key mitogen for HSCs (Marra et
14
1-2E), whereas overexpression of miR-29b inhibited this increase. Furthermore, in LX-2 cells, transfection of the miR-29b precursor decreased cell viability to 89% and 81% at 3 and 5 days following transfection, respectively (Fig. 1-2F). These results suggested that miR-29b is able to suppress the proliferation of HSCs and that down-regulation of miR-29b during HSC activation may contribute to their active proliferation.
3.4. Effects of miR-29b overexpression on the ECM- and growth factor-related signaling in primary mouse HSCs
The question of how miR-29b functions in blocking HSC activation was also examined. I showed that overexpression of miR-29b suppressed Col1a1, Col1a2, FN1, DDR2, ITGB1, and PDGFR-β expression (Fig. 1-2A and B). DDR2 is a receptor tyrosine kinase that is activated by the binding of collagen and was reported to be involved in the proliferation of HSCs and in the expression of matrix metalloproteinase-2 (Olaso et al., 2001, 2002). ITGB1 is a member of the integrin family and works as a FN or collagen receptor by forming a heterodimer with the integrin a subunit. ITGB1 is reported to be involved in the production of type I collagen and monocyte chemotactic protein-1 in HSCs (Marra et al., 1997; Wang et al., 2003). PDGFR-β is a receptor of PDGF and is involved in the proliferation of activated HSCs (Borkham-Kamphorst et al., 2004; Lechuga et al., 2006). Because it is known that intracellular signaling molecules such as FAK, ERK, and PI3K/Akt are key mediators for DDR2, ITGB1, and PDGFR-β (Marra et al., 1997; Carloni et al., 1997; Rodriguez-Juan et al., 2009; Wu et al., 2010; Ikeda et al., 2002), their down-regulation by miR-29b may affect downstream signaling, resulting in the inhibition of both activation and proliferation of HSCs. To verify this hypothesis, I investigated the effect of miR-29b overexpression on the activation of FAK, Akt, and ERK. Activation of these kinases was evaluated by immunoblot analyses to detect the phosphorylation of each protein. Unexpectedly, phosphorylation of FAK, ERK, and Akt was unaffected by miR-29b overexpression (Fig. 1-3A). Next, I also examined the mRNA expression of c-fos and c-jun, which form the transcription factor AP-1 complex and are located downstream of
15
these signal kinases. Although transfection of the miR-29b precursor failed to alter c-jun expression, it significantly reduced c-fos mRNA expression to 55% (Fig. 1-3B). Because c-fos, but not c-jun is predicted target of miR-29b according to the above-mentioned miRNA target prediction databases, the direct interaction of miR-29b with the 3’ UTR of c-fos mRNA might lead to the suppression of c-fos expression. AP-1 is known to be one of the key transcription factors for the initiation of HSC activation (Gao et al., 2004; Poulos et al., 1997). So this fact indicates that effects of miR-29b may be partially mediated by c-fos downregulation.
3.5. conclusion
I confirmed that miR-29b expression decreased during HSC activation and found that overexpression of miR-29b is able to attenuate the activation, trans-differentiation and proliferation of HSCs although the precise molecular mechanism for this effect remains unknown. Changes in miR-29b expression seem to profoundly affect the activation of HSCs.
16
4. Figures
Figure 1-1 Expression of miR-29b in mouse primary HSCs during culture.
HSCs were isolated from mouse liver (Day 0) and cultured for the indicated periods. (A) Phase-contrast microscopy. Scale bar, 200 μm. (B) mRNA expression levels of Col1a1, Col1a2, α-SMA, DDR2, FN1, ITGB1, PDGFR-β and TGF-β1 were analyzed by real-time PCR. Results are expressed as relative expression against the expression on Day 1 of corresponding genes. *P < 0.05,
**
P < 0.01 compared with Day 1. (C) Protein expression levels of type I collagen, α-SMA and
PDGFR-β were analyzed by Western blot. GAPDH served as an internal control. (D) miR-29b expression level was analyzed by real-time PCR. *P < 0.05, **P < 0.01 compared with Day 1.
18
Figure 1-2 Effects of miR-29b overexpression on the activation of HSCs.
(A–D) Mouse HSCs were transfected with 10 nM miR-29b precursor or a negative control (control) on Day 1 and incubated for 3 days. (A) mRNA expression levels of Col1a1, Col1a2, α-SMA, DDR2, FN1, ITGB1, PDGFR-β and TGF-β1 were analyzed by real-time PCR. The results are expressed as relative expression against the expression of untreated control. *P < 0.05, **P < 0.01 compared with
control. (B) Protein expression levels of type I collagen, α-SMA and PDGFR-β were analyzed by Western blot. GAPDH served as an internal control. The right graph indicates the average of the densitometric results of n = 2. (C) Phase-contrast microscopy (upper) and MFP488-phalloidin staining for F-actin (lower). Scale bar, 100 μm. (D) Cell viability was evaluated by WST-1 assay. **P < 0.01 compared with control. (E) Mouse HSCs were transfected with miR-29b precursor or a
negative control (control) on Day 1. Twenty-four hours later, cells were serum-starved overnight, stimulated with or without PDGF-BB (10 ng/ml) and incubated for an additional 3 days. In Day 6, cell viability was evaluated by WST-1 assay. **P < 0.01 compared with control plus PDGF-BB. †P < 0.05 compared with control plus non-treat. (F) LX-2 cells were transfected with miR-29b precursor
or a negative control (control) and incubated for the indicated periods. Cell viability was evaluated by WST-1 assay. *P < 0.05, **P < 0.01 compared with the control.
20
Figure 1-3 Effects of miR-29b overexpression on the ECM- and growth factor-related signaling in mouse primary HSCs.
Mouse HSCs were transfected with 10 nM miR-29b precursor or a negative control (control) on Day 1 and were incubated for 3 days. (A) Phosphorylation of FAK (Y397), ERK (T202/Y204) and Akt (S473) was analyzed by Western blot. (B) mRNA expression levels of c-fos and c-jun were analyzed by real-time PCR. The results are expressed as relative expression against the expression of control. *
21
Chapter II: miR-195-mediated effect of IFN on the proliferation of
HSCs
1. Introduction
Some of recent studies indicated that type I interferons (IFNs) have direct effects on hepatic stellate cells (HSCs) and that these effects contribute antifibrotic actions against hepatic fibrosis. For example, in vitro, IFN-α or -β is reported to suppress proliferation in HSCs (Mallat et al., 1995; Rao
et al., 2010; Shen et al., 2002). Active proliferation is one of the characteristics of activated HSCs,
which have been recognized as major player in pathogeneses of hepatic fibrosis. Therefore, controlling the population of HSCs should be one of the potential therapeutic strategies against liver fibrosis. Recently the number of reports about involvement of miRNA, such as miR-15, miR-16, miR-27, miR-150 and miR-194, in the proliferation of HSCs has been increased (Guo et al., 2009a; Guo et al., 2009b; Ji et al., 2009b; Venugopal et al., 2010). Because over 1000 miRNA have been identified in human cells, other miRNAs may participate in the regulation of HSC’s functions.
In the present study, I measured the levels of miR-195 in primary-cultured mouse HSCs and found that its expression was markedly reduced in their activation phase, suggesting the regulatory role of miR-195 in the activation/deactivation process of HSCs. Previously, there was no report about the relationship between miR-195 and the function of HSCs. But miR-195 is categorized into the same family as miR-15b and miR-16 which has been reported to be down-regulated upon HSC’s activation, and their overexpression induces apoptosis and a delay in the cell cycle (Guo et al., 2009a; Guo et al., 2009b). Furthermore, in human hepatocellular carcinoma cells, miR-195 has been reported to regulate cell cycle by targeting E2F3, CDK6, and cyclin D1 (Xu et al., 2009). So, I examined the involvement of miR-195 in the proliferation of HSC and in type I IFN, in particular IFN-β, -induced inhibition of their growth.
22
2. Materials and methods 2.1. Materials
Necessary reagents and materials were obtained from the following sources: Dulbecco’s modified Eagle’s medium (DMEM) from Sigma Chemical Co. (St. Louis, MO, USA); fetal bovine serum (FBS) from Invitrogen (Carlsbad, CA, USA); human natural IFN-α and IFN-β from Otsuka Pharmaceutical Co. (Tokushima, Japan) and Toray Industries Inc. (Tokyo, Japan), respectively; precursor and inhibitor of miR-195, and the corresponding negative controls from Ambion (Austin, TX, USA); mouse monoclonal antibody against cyclin E1, cyclin D1 and p21, and glyceraldehyde-3-phosphate dehydrogenase (GAPDH) from MBL (Nagoya, Japan), Cell Signaling Technology Inc. (Beverly, MA, USA), and Chemicon International Inc. (Temecula, CA, USA), respectively; rabbit polyclonal antibodies against cyclin-dependent kinase (CDK) 6 and E2F3 from Santa Cruz Biotechnology Inc. (Santa Cruz, CA, USA); goat polyclonal antibody against CDK4 from Santa Cruz Biotechnology Inc.; enhanced Chemiluminescence plus detection reagent from GE Healthcare (Buckinghamshire, UK); Immobilon P membranes from Millipore Corp. (Bedford, MA, USA); reagents for cDNA synthesis and real-time PCR from Toyobo (Osaka, Japan); a cell counting kit from Dojindo Laboratories (Kumamoto, Japan); and all other reagents from Sigma Chemical Co. or Wako Pure Chemical Co. (Osaka, Japan).
2.2. Cells
Human hepatic stellate cell line LX-2 was donated by Dr. Scott L. Friedman (Mount Sinai School of Medicine, New York, NY, USA) (Xu et al., 2005). LX-2 cells were maintained in DMEM supplemented with 10% FBS (DMEM/FBS) and were plated at a density of 0.7–1.5 × 10⁴ cells/cm2 24 h prior to biological assay. Biological assays were done in DMEM/FBS unless stated otherwise. Mouse primary HSCs were isolated from male C57BL/6 mice by the pronase-collagenase digestion method as described previously (Uyama et al., 2006) and were cultured in DMEM/FBS.
23
2.3. Transient transfection of miRNA precursors and inhibitors
Precursor of miR-195, which was a double-strand RNA mimicking endogenous miR-195 precursor, and the negative control with a scrambled sequence were transfected into LX-2 cells using Lipofectamine 2000 (Invitrogen, Carlsbad, CA, USA) at a final concentration of 50 nM in accordance with the manufacturer’s instructions. Briefly, miRNA precursor and Lipofectamine 2000 were mixed at a ratio of 25 (pmol) : 1 (μl) in Opti-MEM I Reduced Medium (Invitrogen, Carlsbad, CA, USA), incubated for 20 min at room temperature, and were then added to the cultures. After 24 h, the culture medium was replaced with fresh medium. Inhibitor of miR-195, which was designed to bind to endogenous miR-195 and inhibit its activity, and the negative control with a scrambled sequence were transfected similarly. After 6 h, the culture medium was changed and IFN-β was added successively.
2.4. Cell proliferation assay
LX-2 cells were plated at a density of 2 × 10³ cells/well in 96-well plates 24 h prior to experiments. The culture medium was replaced by fresh medium containing different concentrations of IFNs at day 0 and 3. After 3, 5, and 7 days of treatment, cell proliferation was measured by WST-1 assay. In another experiment, the cells were plated at a density of 3 × 10³ cells/well in 96-well plate for 24 h prior and were then transfected with the miR-195 precursor as described above. After 24 h, the medium was changed and the culture was continued for an additional 1–3 days before the measurement of cell proliferation.
2.5. Cell cycle analysis
Cells were serum starved for 24 h and then the medium was replaced with IFN-containing DMEM/FBS. At the indicated time points after treatment, the cells were harvested by trypsinization, washed in phosphate buffered saline (PBS), and fixed in ice-cold 70% ethanol. The cells were washed in PBS and resuspended in PBS containing 500 μg/ml RNase A and incubated for 20 min.
24
Cellular DNA was stained with propidium iodide at a final concentration of 25 μg/ml for 20 min. The cells were analyzed using a FACSCalibur HG flow cytometer (Becton Dickinson, Franklin Lakes, NJ, USA). A total of 20,000 events were counted for each sample. Data were analyzed using ModFIT LT software (Verity Software House, Topsham, ME, USA).
2.6. Quantitative real-time PCR
Quantitative real-time PCR was performed according to the method described elsewhere with use of a set of gene-specific oligonucleotide primers (Table 2-1) using an Applied Biosystems Prism 7500 (Applied Biosystems, Foster City, CA, USA) (Ogawa et al., 2010). To detect miR-195 expression, the reverse transcription reaction was performed using a TaqMan microRNA Assay (Applied Biosystems, Foster City, CA, USA) in accordance with the manufacturer’s instructions. The expression level of GAPDH was used to normalize the relative abundance of mRNAs and miR-195.
2.7. Immunoblotting
Cells were lysed in RIPA buffer [50 mM Tris/HCl, pH 7.5, 150 mM NaCl, 1% NP-40, 0.5% sodium deoxycholate, 0.1% sodium dodecyl sulfate (SDS)] containing Protease Inhibitor Cocktail, Phosphatase Inhibitors Cocktail 1, and Phosphatase Inhibitor Cocktail 2 (Sigma Chemical Co., St. Louis, MO, USA). Proteins (20 μg) were electrophoresed in a 10% SDS-polyacrylamide gel and then transferred onto Immobilon P membranes (Ogawa et al., 2010). Immunoreactive bands were visualized by the enhanced chemiluminescence system using a Fujifilm Image Reader LAS-3000 (Fuji Medical Systems, Stamford, CT, USA).
2.8. Luciferase reporter assay
Interaction of miR-195 to the 3’UTR of the cyclin E1 gene was tested according to the reported method (Ogawa et al., 2010). The 3’UTR of the cyclin E1 gene containing putative miR-195 target
25
regions was obtained by PCR using cDNA derived from LX-2 and a primer set listed in Table 2-1. The obtained DNA fragments (497 bp) were inserted into a pmirGLO Vector (Promega, San Luis Obispo, CA, USA). LX-2 cells, plated in 96-well plates at a density of 2 × 10⁴ cells/well 24 h prior to experiment, were transfected with 200 ng of reporter plasmid and miRNA precursor using Lipofectamine 2000. After 24 h, the medium was changed to 20 μl of PBS. The Dual-Glo Luciferase Assay System (Promega, San Luis Obispo, CA, USA) was used to analyze luciferase expression in accordance with the manufacturer’s protocol. Firefly luciferase activity was normalized to Renilla luciferase activity to adjust for variations in transfection efficiency among experiments.
2.9. Statistical analysis
Data presented as graphs are the means ± S.D. of at least three independent experiments. Statistical analysis was performed using Student’s t-test. P < 0.05 was considered significant.
26
3. Results
3.1. Reduction of miR-195 expression during activation of primary-cultured HSCs
It has been known that, when maintained in a plastic culture plate, freshly isolated primary-cultured HSCs undergo spontaneous activation and transformation into myofibroblastic cells that express α-SMA and produce fibrogenic mediators, such as type I collagen and transforming growth factor-β. In my preliminary experiments using primary-cultured mouse HSCs, I noticed that the cells drastically decreased the expression of miR-195 when they underwent spontaneous activation (unpublished observation). The present study confirmed this notion as shown in Figure 2-1A. miR-195 expression level certainly decreased in activation process of primary-cultured mouse HSCs. In contrast, the expression levels of α-SMA and cyclin E1 mRNA increased (Fig. 2-1B). Accordingly, I considered that miR-195 plays a role as an antiproliferative and antiactivating miRNA in HSCs. As a matter of fact, there was a study showing that miR-16 family including miR-195 inhibits proliferation of lung cancer cells by silencing cyclins D1 and E1, and CDK6 (Liu et al., 2008). The result indicated by Figure 2-1 and the cited study together drove me to explore the IFN’s antiproliferative action on HSCs (Mallat et al., 1995; Shen et al., 2002), focusing on miR-195 and cell cycle-related genes.
3.2. Effects of IFN-α and -β on proliferation of HSCs
First, I investigated the effects of type I IFNs on the proliferation of LX-2 cells using a WST-1 assay. LX-2 cells in control culture continued to grow during the experimental period of 7 days (Fig. 2-1C). IFN-α and -β both, but the latter more actively, decreased cell proliferation time-dependently at a concentration of 1,000 IU/ml, supporting the previous studies (Mallat et al., 1995; Shen et al., 2002). Dose-dependency of the growth inhibition is shown in IFN concentrations from 10 to 1,000 IU/ml (Fig. 1D).
27
3.3. Effects of IFN-α and -β on cell cycle distribution
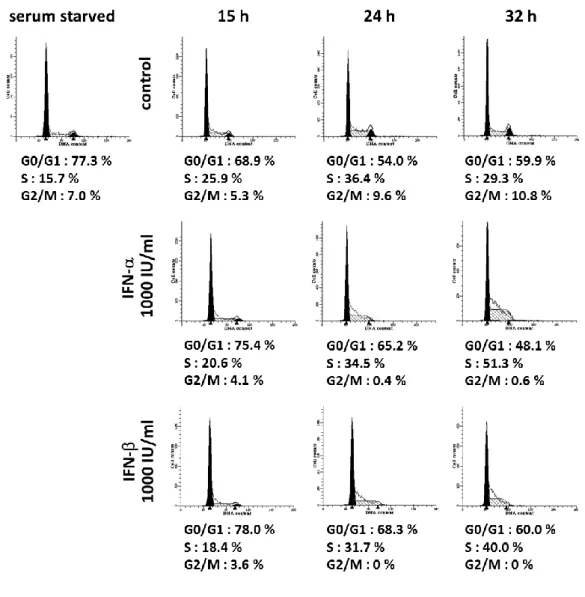
To elucidate the mechanism of the growth inhibitory effect of IFN, I next examined the change in cell cycle distribution in response to IFN-α and -β treatment by flow cytometry. LX-2 cells were synchronized in G0/G1 phase by serum starvation for 24 h. In non-treated cells (control), population in G0/G1 phase was reduced after serum exposure, which was accompanied by the increase of population in S phase. This cell cycle transition peaked at 24 h (Fig. 2-2, upper part). In cells treated with IFN-α or -β, the G0/G1 phase population was larger and the S phase population was smaller than in the control cells at 15 h and 24 h. In addition, the accumulation of cells in early S phase was observed at 32 h (Fig. 2-2, middle and lower parts). These delays in cell cycle shift were more potent in IFN-β-treated cells than in IFN-α-treated cells. It was concluded that type I IFN hampered HSC proliferation through a delay in the cell cycle at the transition from G1 to S phase and in the progression of S phase.
3.4. Regulation of cyclin E1 and p21 expression by IFN-β
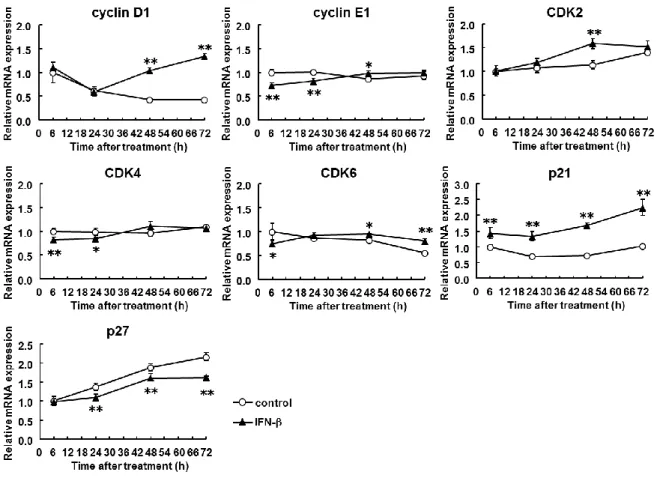
IFN-β was chosen in the following experiments because of its more potent inhibition of cell cycle progression than IFN-α as described above. The transition from G1 to S phase and the progression of S phase are known to be influenced by various regulators (Golias et al., 2004). Among them, I found that IFN-β significantly decreased cyclin E1 mRNAexpression levels by 0.6- to 0.7-fold at 6 and 24 h and increased p21 mRNA expression levels by 1.4- to 2.3-fold at 6, 24, 48, and 72 h in LX-2 cells (Fig. 2-3). The expression levels of CDK4 and CDK6 were also reduced by IFN-β at early phase with less extent. The others showed negligible change within 24 h although variable dynamics were seen thereafter; changes of cyclin D1, CDK2, and p27 expression at late phase were toward cell cycle promotion with currently unknown reason.
3.5. Regulation of miR-195 expression by IFN-β
28
expression of miR-195 in LX-2 cells. To test this possibility, I examined the expression levels of miR-195 in IFN-β-treated LX-2 cells. As a result, the miR-195 expression level was significantly increased by IFN-β treatment at 24, 48, and 72 h (Fig. 2-4A).
3.6. Regulation of cyclin E1 and p21 expression by miR-195
The results obtained from experiments shown in Figures 2-3 and 2-4A led me to hypothesize that IFN-β up-regulates the expression of miR-195, which then down-regulates the expression of cyclin E1 and up-regulates the expression of p21. In addition, there had been a study reporting that miR-195 targets E2F3, CDK6, and cyclin D1 in addition to cyclin E1 (Xu et al., 2009). Under these considerations, I examined the changes in the expression levels of the above-mentioned cell cycle-related molecules and CDK4 by introducing miR-195 precursor into LX-2 cells. Transfection of miR-195 precursor increased the miR-195 expression levels in LX-2 cells by up to 10,000–30,000 times compared with those in cells transfected with negative control (data not shown). Cyclin E1 mRNA and protein expression levels showed a remarkable reduction up to 72 h as result of miR-195 overexpression (Fig. 2-4B, C). On the other hand, p21 mRNA and protein expression levels showed a marked increase. CDK4, CDK6, and cyclin D1 expression levels were significantly changed at the mRNA level, but negligibly at the protein level. E2F3 mRNA and protein expression levels were unchanged (Fig. 2-4B, C). These results suggested that miR-195 mainly regulated cyclin E1 and p21 expression in LX-2 cells. Moreover, transfection of miR-195 precursor (50 nM) decreased the proliferation of LX-2 cells in the WST-1 assay (Fig. 2-4D). These results showed that miR-195 down-regulates endogenous cyclin E1 expression and upregulates p21 expression, resulting in the attenuation of cell cycle progression and cell proliferation.
3.7. Interaction of miR-195 with cyclin E1 3’UTR in LX-2 cells
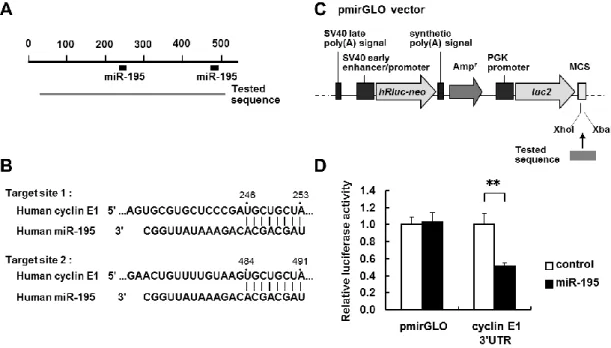
Next, I examined whether miR-195 interacted directly with cyclin E1 3’UTR in LX-2 cells. The predicted miRNA target sites for miR-195 in the cyclin E1 3’UTR were analyzed using TargetScan
29
Human Release 5.1 (http://www.targetscan.org/). The cyclin E1 3’UTR contained two target sites for miR-195 (Fig. 2-5A, B). To investigate the direct interaction between them, the part of the cyclin E1 3’UTR containing the two miR-195 target sites (497 bp) was cloned from LX-2 cells, inserted the downstream of a firefly luciferase reporter gene in a pmirGLO vector (Fig. 2-5C), and cotransfected into LX-2 cells. As shown in Figure 2-5D, luciferase reporter activity decreased significantly in miR-195 precursor-transfected cells compared with cells transfected with a negative control of the precursor. These results suggested a direct interaction between miR-195 and cyclin E1 3’UTR in LX-2 cells. Binding site of miR-195 was not found in p21 3’UTR by TargetScan.
3.8. Regulation of cyclin E1 expression by IFN-β and miR-195
To confirm the contribution of miR-195 to the inhibitory effect of IFN-β on cyclin E1 expression, LX-2 cells were first transfected with 50 nM miR-195 inhibitor and then treated with 1,000 IU/ml IFN-β. As shown in Figure 2-6A, miR-195 inhibitor blocked the inhibitory effect of IFN-β on cyclin E1 mRNA expression at 16 and 24 h. Although there was no difference in the cyclin E1 mRNA expression between IFN-β-treated cells and non-treated cells (control) at 48 h, the cyclin E1 mRNA expression level in miR-195 inhibitor plus IFN-β-treated cells was up-regulated compared with non-treated cells (Fig. 2-6A). Immunoblot analysis revealed that miR-195 inhibitor elevated the cyclin E1 expression level of IFN-β-treated cells at 24 and 48 h (Fig. 2-6B).
30
4. Discussion
In this study, I showed that IFN-β is more antiproliferative on LX-2 cells than IFN-α, which appears to be contradictory to their known mechanism of action: both IFN-α and -β exert their activities through the common signaling pathway, beginning with binding to the same type I IFN receptor (IFNAR) consisting of IFNAR1 and IFNAR2, which activate the common components of janus kinase/signal transducer and activator of transcription (STAT) pathway (Darnell et al., 1994). However, a similar activity difference between the IFNs has also been demonstrated in colon cancer cell lines (Katayama et al., 2007) and in rat HSCs (Shen et al., 2002). Some studies showed that IFN-β but not IFN-α formed a stable complex with IFNARs, suggesting that IFN-β may interact with IFNAR chains in a manner different from IFN-α (Croze et al., 1996; Russell-Harde et al., 1999).
I showed here that IFN-β down-regulated the expression of cyclin E1 and up-regulated the expression of p21, which caused the cells to be less active proceeding in the transition from G0 to G1 phase and in the progression of S phase. The cell cycle is regulated by various molecules, such as cyclins and CDKs. Cyclin E is essential in activating CDK2. The cyclin E-CDK2 complex phosphorylates pRb at G1 phase, leading to gene transcription activities that are needed in S phase, and also activates the factors involved in DNA replication at early S phase (Golias et al., 2004). It has been reported that cyclin E1 expression increased in non-parenchymal cells of human fibrotic liver and that cyclin E1-deficient mice developed milder liver fibrosis compared with wild-type mice after CCl4 administration (Nevzorova et al., 2010). These results imply that cyclin E1 regulates the progression of liver fibrosis by accelerating HSC proliferation.
The most frequent miRNAs that targets cyclin E1 are the miR-16 family, which consists of miR-15, -16, -195, -424, and -497 (Liu et al., 2008; Wang et al., 2009). I here observed the induction of miR-195 by IFN-β. miR-195 was reported to be down-regulated in human HCC tissues and to suppress HCC growth through the targeted interference of cyclin D1, CDK6, and E2F3 in a
xenograft mouse model (Xu et al., 2009), while it was reported to target cyclin E1 in addition to the
31
concomitantly with HSC activation and their overexpression induces apoptosis and a delay of cell cycle in HSCs by targeting Bcl-2 and cyclin D1 (Guo et al., 2009a,b). However, the role of miR-195 in HSCs remains unknown. I showed here that miR-195 expression was decreased during spontaneous activation of primary-cultured mouse HSCs and that miR-195 interacted with cyclin E1 3’UTR and lowered the expression levels of the cyclin E1 mRNA and protein in LX-2 cells. These results suggest that the downregulation of miR-195 may associate with the proliferation of HSCs in fibrotic liver similarly to miR-15 and miR-16. In this study, the changes of the protein expression levels of E2F3, CDK6, and cyclin D1, which were reported to be regulated by miR-195 (Xu et al., 2009), were negligible by miR-195, although the exact reason for this phenomenon was not determined. However, because the total context scores obtained by TargetScan were―0.73 for cyclin E1, ―0.33 for E2F3, ―0.32 for cyclin D1, and ―0.09 for CDK6, the result obtained here was thought to be reasonable. In addition, minimal or negligible effect of miR-195 on the expression of E2F3, CDK4, CDK6, and cyclin D1 was compatible with that of IFN-β on these factors. Furthermore, inhibition of miR-195 by miR-195 inhibitor attenuated the effect of IFN-β on cyclin E1 expression, though not so strong. Taken together, it is most likely that the downregulation of cyclin E1 by IFN-β treatment in HSCs is mediated through miR-195 up-regulation. The mechanism through which IFN-β induces miR-195 in LX-2 cells need to be explored further.
It is well known that IFNs induce the expression of p21 in various cancer cells (Sangfelt et al., 1999; Katayama et al., 2007). I also observed the up-regulation of p21 in IFN-β-treated cells. Therefore, p21, in addition to cyclin E1, may play a role in IFN-induced growth inhibition of HSCs. Until now, it has been reported that IFNs induce p21 expression through the binding of STAT and IFN regulatory factor, which are critical signaling molecules after IFN-IFNAR interaction, to p21 gene promoter (Gartel and Tyner, 1999). Unexpectedly, I found the upregulation of p21 by miR-195 (Fig. 2-4). The results obtained here raise a new possibility that the up-regulation of p21 by IFN-β in HSCs may be partially mediated through miR-195.
32
delaying the cell cycle in G1 to early S phase through the down-regulation of cyclin E1 and up-regulation of p21. The cyclin E1 down-regulation and p21 up-regulation were partially mediated by miR-195 that was up-regulated by IFN-β. This study raises a new mechanistic aspect of the antifibrotic effect of IFN in liver fibrosis and the possibility of influencing miR-195 as a therapeutic strategy for liver fibrosis.
33
5. Table
Table 2-1. Sequences of primers used in real-time PCR analyses and 3’UTR cloning for luciferase reporter assay
Gene Accession No. Sequence
real-time PCR
CDK6 NM_001259 Forward: 5'-ATATCTGCCTACAGTGCCCTGTCTC-3'
Reverse: 5'-GTGGGAATCCAGGTTTTCTTTGCAC-3'
Cyclin E1 NM_001238 Forward: 5'-GCAGTATCCCCAGCAAATC-3'
Reverse: 5'-TCAAGGCAGTCAACATCCA-3'
Cyclin D1 NM_053056 Forward: 5'-GCTGTGCATCTACACCGACAACTC-3'
Reverse: 5'-AGGTTCCACTTGAGCTTGTTCACC-3'
E2F3 NM_001949 Forward: 5'-CCAACTCAGGACATAGCGATTGCTC-3'
Reverse: 5'-AGGAATTTGGTCCTCAGTCTGCTGT-3'
GAPDH NM_002046 Forward: 5'-GCACCGTCAAGGCTGAGAAC-3'
Reverse: 5'-TGGTGAAGACGCCAGTGGA-3'
p21 NM_000389 Forward: 5'-AGCAGAGGAAGACCATGTGGA-3'
Reverse: 5'-GGAGTGGTAGAAATCTGTCATGCT-3'
3'UTR cloning
Cyclin E1 NM_001238 Forward: 5'-TTCTCGAGATCCTTCTCCACCAAAGACAGTT-3'
Reverse: 5'-TTTCTAGAGAATGGATAGATATAGCAGCACTTACA-3'
The forward and reverse primers for 3’UTR cloning carried the XhoI and XbaI sites at
their 5’-ends, respectively.
34
6. Figures
Figure 2-1 Expression of miR-195 in mouse HSCs during primary culture and growth inhibitory effect of IFN-α and -β on human stellate cells.
(A), (B) Isolated mouse HSCs were cultured for the indicated periods. The expression levels of miR-195 (A), and α-SMA and cyclin E1 mRNA (B) were measured by real-time PCR. *P < 0.05, **P < 0.01 compared with 1 day. (C), (D) LX-2 cells were incubated with IFN-α or -β (1,000 IU/ml) for
3–7 days (C), or with IFN-α or -β at the concentration of 10–1,000 IU/ml for 7 days (D). Control indicates non-treated cells. The proportion of viable cells was determined using a WST-1 assay. **P < 0.01 compared with control.
35
Figure 2-2 Effect of IFN-α and -β on cell cycle distribution in human stellate cells.
LX-2 cells synchronized in G0/G1 phase were then incubated with IFN-α or -β (1,000 IU/ml) in DMEM/FBS for the indicated periods. Control indicates non-treated cells. The cell cycle was analyzed by flow cytometry. The left black, shaded and right black region indicates the histogram measured by flowcytometry, G0/G1 phase (left), S phase and G2/M phase respectively, as analyzed by ModFIT LT software.
36
Figure 2-3 Expression of cell cycle-related genes in stellate cells.
LX-2 cells were incubated with IFN-β (1,000 IU/ml) for up to 72 h for determining the expression levels of mRNAs of cyclin D1, cyclin E1, CDK2, CDK4, CDK6, p21, and p27. Control indicates non-treated cells. *P < 0.05, **P < 0.01 compared with control.
37
Figure 2-4 Regulation of expression of cell cycle regulators by miR-195.
(A) LX-2 cells were incubated with IFN-β (1,000 IU/ml) for up to 72 h for determining the expression levels of miR-195. Control indicates non-treated cells. *P < 0.05, **P < 0.01 compared
with control. (B–D) LX-2 cells were transfected with 50 nM miR-195 precursor or a negative control (control). (B) mRNA expression levels of E2F3, CDK4, CDK6, cyclin D1, cyclin E1, and p21 measured at 24, 48, 72, and 96 h post-transfection. (C) Protein expression of E2F3, CDK4, CDK6, cyclinD1, cyclinE1, and p21 examined at 48, 72, and 96 h post-transfection. (D) Growth of LX-2 cells transfected with 50 nM miR-195 precursor or a negative control (control) was measured using a WST-1 assay. *P < 0.05, **P < 0.01 compared with control.
39
Figure 2-5 Interaction of miR-195 with the 3’UTR of cyclin E1 mRNA.
(A) Schematic indication of the putative miR-195 target sites in the 3’UTR of the cyclin E1 mRNA. Tested sequences indicate the regions that were inserted into the luciferase reporter vector. (B) Predicted pairing of the target region and miRNAs. (C) Structure of the luciferase reporter vector (Ogawa et al., 2010). The putative miR-195 target region in cyclin E1 3’UTR (tested sequence) was ligated into the MCS. Arrows indicate the gene directions. AmpR indicates an ampicillin resistance gene. (D) Reporter gene assay of the interaction between the 3’UTR of cyclin E1 mRNA and miR-195 in LX-2 cells. Results are expressed as the relative activities against the activity in the presence of the control. *P < 0.05, **P < 0.01 compared with control.
40
Figure 2-6 Regulation of cyclin E1 expression by IFN-β and miR-195.
LX-2 cells were transfected with 50 nM miR-195 inhibitor or a negative control. After 6 h, the culture medium was changed and then IFN-β (1,000 IU/ml) was added. Cells were then incubated for the indicated time periods. (A) mRNA expression levels of cyclin E1. (B) Protein expression levels of cyclin E1. GAPDH are for loading adjustment. Control; cells were transfected with a negative control and incubated without IFN-β. *P < 0.05, **P < 0.01.
41
General Discussion
HSCs are considered as major player in hepatic fibrosis because they undergo a
trans-differentiation into myofibroblastic cells termed “activation’’ in response to fibrogenic stimuli
and produce excessive ECMs. The characteristics of activated HSCs also include the active proliferation (Friedman, 2000; Bataller and Brenner, 2001). Type I IFNs were shown to have direct action on HSCs and suppress the activation, proliferation and production of ECM of HSCs. Although some of these effects appear to be mediated by the control of Smad4 and Smad7 expression and the interaction between phosphorylated STAT1 and p300 (Gartel et al., 1999; Inagaki et al., 2003; Rao et
al., 2010), the detailed molecular mechanisms of these effects of type I IFNs remain to be clarified.
Therefore, examining the unknown mechanisms of effects of type I IFNs for HSCs contribute to the understanding the HSCs functions and give the possibility of new therapeutic approach for hepatic fibrosis. In this study, I tried to reveal the miRNAs-mediated action mechanisms of type I IFNs for HSCs.
It has been reported that miR-29b was induced by IFN and suppressed type I collagen production in LX-2 cells (Ogawa et al., 2010). So, I especially focused on miRNAs. Gain of function experiments showed that miR-29b is involved in all examined characteristics of HSCs, namely activation, excess ECM production and proliferation for the first time. I also identified miR-195 as a new IFN-responsible miRNA in HSCs and shows that miR-195 mediated the inhibitory effect of IFN in HSCs proliferation. miR-195 seemed to have no involvement in activation and excess ECM production (unpublished data). Thus, it is suggested that there are differences among miRNAs in the event and the degree of involvement. Moreover, because over 1000 miRNA have been identified in human cells, other miRNA in addition to miR-29b and miR-195 may mediate the IFN’s action in HSCs.
The findings in this study also raise the possibility of miR-29b and miR-195 as a new therapeutic target for hepatic fibrosis. In fact, miR-29 family (miR-29a, -29b and -29c) have been further investigated about the role in HSCs function, hepatic and other organ fibrosis (Kwiecinski et al.,
42
2012; Zhang et al., 2015) and now it is defined as a one of “fibromiR”. More recently, it was reported that gene transfer of miR-29b to liver prevented CCl4-induced hepatic fibrosis in mouse (Wang et al., 2014). Although the therapeutic effect of miR-195 itself in hepatic fibrosis isn’t shown, cyclin E1, proved to be a target of miR-195 in HSCs in this study, has reported to be essential to liver fibrogenesis in mouse (Nevzorova et al., 2010; Nevzorova et al., 2012). So, strategies inducing sufficient amounts of miR-195 in HSCs may achieve prevention of hepatic fibrosis progression.
In conclusion, these observations reveal miR-29b and miR-195-mediated new action mechanisms of type I IFNs for HSCs.
43
Acknowledgements
I would like to express my gratitude to all the individuals who provided me guidance, support and encouragement during the preparation of this dissertation.
I would like to express my deepest gratitude to Prof. Kazuto Nakada for his peer-review and invaluable advice during the preparation of this dissertation.
I would like to express the deepest appreciation to Prof. Norifumi Kawada, Prof. Kazuo Ikeda and Prof. Katsutoshi Yoshizato for providing the opportunity to carry out this study.
I would like to thank to Dr. Tomohiro Ogawa and Dr. Masashi Iizuka for their advices and support throughout this study.
This study was supported by a grant from the Ministry of Health, Labour and Welfare of Japan to Norifumi Kawada (2008–2010).
44
References
Bartel DP. 2004. MicroRNAs: Genomics, biogenesis, mechanism, and function. Cell 116: 281–297. Bataller R, Brenner DA. 2001. Hepatic stellate cells as a target for the treatment of liver fibrosis.
Semin Liv Dis 21: 437–451.
Bissell DM, Roulot D, George J. 2001. Transforming growth factor beta and the liver. Hepatology 34: 859-867.
Borkham-Kamphorst E, Herrmann J, Stoll D, Treptau J, Gressner AM, Weiskirchen R. 2004. Dominant-negative soluble PDGF-beta receptor inhibits hepatic stellate cell activation and attenuates liver fibrosis. Lab Invest 84: 766-777.
Carloni V, Romanelli RG, Pinzani M, Laffi G, Gentilini P. 1997. Focal adhesion kinase and phospholipase C gamma involvement in adhesion and migration of human hepatic stellate cells. Gastroenterology 112: 522-531.
Chang XM, Chang Y, Jia A. 2005. Effects of interferon-alpha on expression of hepatic stellate cell and transforming growth factor-beta1 and alpha-smooth muscle actin in rats with hepatic fibrosis. World J Gastroenterol 11: 2634–2636.
Croze E, Russell-Harde D, Wagner TC, Pu H, Pfeffer LM, Perez HD. 1996. The human type I interferon receptor. Identification of the interferon beta-specific receptor-associated phosphoprotein. J Biol Chem 271: 33165–33168.
Darnell JE, Kerr IM, Stark GR. 1994. Jak-STAT pathways and transcriptional activation in response to IFNs and other extracellular signaling proteins. Science 264:1415–1421.
Fort J, Pilette C, Veal N, Oberti F, Gallois Y, Douay O, Rosenbaum J, Cales P. 1998. Effects of long-term administration of interferon alpha in two models of liver fibrosis in rats. J Hepatol 29: 263–270.
Friedman SL. 2000. Molecular regulation of hepatic fibrosis, an integrated cellular response to tissue injury. J Biol Chem 275: 2247–2250.
45
activation and cell proliferation through p44/42 MAP kinase in primary rat hepatic stellate cells. J Hepatol 40: 431-438.
Gartel AL, Tyner AL. 1999. Transcriptional regulation of the p21 (WAF1/ClP1) gene. Exp Cell Res 246: 280–289.
Golias CH, Charalabopoulos A, Charalabopoulos K. 2004. Cell proliferation and cell cycle control: A mini review. Int J Clin Pract 58: 1134–1141.
Guo CJ, Pan Q, Jiang B, Chen GY, Li DG. 2009a. Effects of upregulated expression of microRNA-16 on biological properties of culture-activated hepatic stellate cells. Apoptosis 14: 1331–1340.
Guo CJ, Pan Q, Li DG, Sun H, Liu BW. 2009b. miR-15b andmiR-16 are implicated in activation of the rat hepatic stellate cell: An essential role for apoptosis. J Hepatol 50: 766–778.
Ikeda K, Wang LH, Torres R, Zhao H, Olaso E, Eng FJ, Labrador P, Klein R, Lovett D, Yancopoulos GD, Friedman SL, Lin HC. 2002. Discoidin domain receptor 2 interacts with Src and Shc following its activation by type I collagen. J Biol Chem 277: 19206-19212.
Inagaki Y, NemotoT, Kushida M, Meng Y, HigashiK, Ikeda K, Kawada N, Shirasaki F, Takehara K, Sugiyama K, Fujii M, Yamauchi H, Nakao A, de Crombrugghe B, Watanabe T, Okazaki I. 2003. Interferon alpha down-regulates collagen gene transcription and suppresses experimental hepatic fibrosis in mice. Hepatology 38: 890–899.
Ji JF, Shi J, Budhu A, Yu ZP, Forgues M, Roessler S, Ambs S, Chen YD, Meltzer PS, Croce CM, Qin LX, Man K, Lo CM, Lee J, Ng IOL, Fan J, Tang ZY, Sun HC, Wang XW. 2009a. MicroRNA expression, survival, and response to interferon in liver cancer. N Engl J Med 361: 1437–1447. Ji JL, Zhang JS, Huang GC, Qian J, Wang XQ, Mei S. 2009b. Over-expressed microRNA-27a and
27b influence fat accumulation and cell proliferation during rat hepatic stellate cell activation. FEBS Lett 583: 759–766.
Katayama T, Nakanishi K, Nishihara H, Kamiyama N, Nakagawa T, Kamiyama T, Iseki K, Tanaka S, Todo S. 2007. Type I interferon prolongs cell cycle progression via p21 (WAF1/ CIP1) induction
46 in human colon cancer cells. Int J Oncol 31: 613–620.
Kwiecinski M, Elfimova N, Noetel A, Tox U, Steffen HM, Hacker U, Nischt R, Dienes HP, Odenthal M. 2012. Expression of platelet-derived growth factor-C and insulin-like growth factor I in hepatic stellate cells is inhibited by miR-29. Lab Invest 92: 978-987.
Lechuga CG, Hernandez-Nazara ZH, Hernandez E, Bustamante M, Desierto G, Cotty A, Dharker N, Choe M, Rojkind M. 2006. PI3K is involved in PDGF-beta receptor upregulation post-PDGF-BB treatment in mouse HSC. Am J Physiol Gastrointrst Liver Physiol 291: G1051-G1061.
LiuQ, Fu HJ, Sun F, Zhang HM, Tie Y, Zhu J, Xing RY, Sun ZX, Zheng XF. 2008. miR-16 family induces cell cycle arrest by regulating multiple cell cycle genes. Nucleic Acids Res 36: 5391– 5404.
Mallat A, Preaux AM, Blazejewski S, Rosenbaum J, Dhumeaux D, Mavier P. 1995. Interferon alpha and gamma inhibit proliferation and collagen synthesis of human Ito cells in culture. Hepatology 21: 1003–1010.
Marra F, Pinzani M, Defranco R, Laffi G, Gentilini P. 1995. Involvement of phosphatidylinositol 3-kinase in the activation of extracellular signal-regulated kinase by PDGF in hepatic stellate cells. FEBS Lett 376: 141-145.
Marra F, Pastacaldi S, Romanelli RG, Pinzani M, Ticali P, Carloni V, Laffi G, Gentilini P. 1997. Integrin-mediated stimulation of monocyte chemotactic protein-1 expression. FEBS Lett 414: 221-225.
Nevzorova YA, Bangen JM, Gassler N, Haas U, Weiskirchen R, Tacke F, Sicinski P, Trautwein C, Liedtke C. 2010. Cyclin E1 controls the cell cycle activity of hepatic stellate cells and triggers fibrogenesis in mice. J Hepatol 52: S374–S375.
Nevzorova YA, Bangen JM, Hu W, Haas U, Weiskirchen R, Gassler N, Huss S, Tacke F, Sicinski P, Trautwein C, Liedtke C. 2012. Cyclin E1 controls proliferation of hepatic stellate cells and is essential for liver fibrogenesis in mice. HEPATOLOGY 56: 1140-1149.
47
Ogawa T, Kawada N, Ikeda K. 2009. Effect of natural interferon alpha on proliferation and apoptosis of hepatic stellate cells. Hepatol Int 3: 497–503.
Ogawa T, Iizuka M, Sekiya Y, Yoshizato K, Ikeda K, Kawada N. 2010. Suppression of type I collagen production by microRNA-29b in cultured human stellate cells. Biochem Biophys Res Commun 391:316–321.
Olaso E, Ikeda K, Eng FJ, Xu LM, Wang LH, Lin HC, Friedman SL. 2001. DDR2 receptor promotes MMP2-mediated proliferation and invasion by hepatic stellate cells. J Clin Invest 108: 1369-1378.
Olaso E, Labrdor JP, Wang LH, Ikeda K, Eng FJ, Klein R, Lovett DH, Lin HC, Friedman SL. 2002. Discoidin domain receptor 2 regulates fibroblast proliferation and migration through the extracellular matrix in association with transcriptional activation of matrix metalloproteinase-2. J Biol Chem 277: 3606-3613.
Pedersen IM, Cheng G, Wieland S, Volinia S, Croce CM, Chisari FV,David M. 2007. Interferon modulation of cellular microRNAs as an antiviral mechanism. Nature 449:919–922.
Pestka S, Langer JA, Zoon KC, Samuel CE. 1987. Interferons and their actions. Annu Rev Biochem 56:727–777.
Poulos JE, Weber JD, Bellezzo JM, Bisceglie AMD, Britton RS, Bacon BR, Baldassare JJ. 1997. Fibronectin and cytokines increase JNK, ERK, AP-1 activity, and transin gene expression in rat hepatic stellate cells. J Physiol 273: G804-G811.
Rao HU, Wei L, Wang JH, Fei R, Jiang D, Zhang Q, Chen HS, Cong X. 2010. Inhibitory effect of human interferon-beta-1a on activated rat and human hepatic stellate cells. Hepatology 25: 1777-1784.
Roderburg C, Urban GW, Bettermann K, Vucur M, Zimmermann H, Schmidt S, Janssen J, Koppe C, Knolle P, Castoldi M, Tacke F, Trautwein C, Luedde T. 2011. Micro-RNA profiling reveals a role for miR-29 in human and murine liver fibrosis. Hepatology 53: 209-218.