平成 27 年度 博士学位論文
Novel Utilization of Biomass for Activated Carbon Preparation and Catalytic Gasification
バイオマスを活用した新しい活性炭製造法及 びガス化法の開発
Boodsakorn Kongsomart
(
ブーサコン コンソムアート)
Novel Utilization of Biomass for Activated Carbon Preparation and Catalytic Gasification
バイオマスを活用した新しい活性炭製造法及 びガス化法の開発
by
Boodsakorn Kongsomart
A dissertation submitted to
Graduate School of Engineering, Gunma University For the Degree of
Doctor of Engineering
Department of Environmental Engineering Science Graduate School of Science and Technology
Gunma University
2016
Evaluation Committee
Professor Takayuki Ohshima, Chair
Faculty of Engineering, Gunma University, Japan
Professor Tomohide Watanabe, Vice-Chair
Faculty of Engineering, Gunma University, Japan
Professor Shinji Katsura, Vice-Chair
Faculty of Engineering, Gunma University, Japan
Associate Professor Reiji Noda, Vice-Chair
Faculty of Engineering, Gunma University, Japan
Professor Takayuki Takarada, Vice-Chair
Faculty of Engineering, Gunma University, Japan
I
Abstract
Biomass is an attractive material that much attention as renewable energy sources due to their low-cost and environmental friendly. Biomass comprises organic compounds of carbons, can reduce CO2 in the atmosphere by photosynthesis. Among various conversion technologies, pyrolysis and gasification are one of the most attractive methods for biomass utilization. In this research, the biomass ash as a catalyst prepared by combustion process for the production of activation carbons (ACs) was investigated.
In Chapter 2 the effects of catalyst (chemical reagent and biomass) on specific surface area and yield of activated carbon from biomass were investigated. CaCO3 and Ca(OH)2 are catalysts in chemical activation. Chicken dropping compost is biomass as a catalyst to compare the effect with chemical reagent. Activated carbon preparation was performed at 1000oC under N2 gas ambient. With increasing the amount of catalyst added, the specific surface area was increased. The specific surface area of activated carbon reached the range between 200 and 1100 m2g-1.
In Chapter 3, the preparation of the activated carbon (ACs) from teak sawdust (TS) biomass mixed with chicken dropping compost ash (CCA) and empty fruit bunch ash (EFBA) as activating agents were studied. The carbonization was done in pure N2 and N2/CO2 stream gases by temperature range between 600 to 1000°C. The concentration of CO2 in N2/CO2 gas was varied from 2 to 10%. The specific surface area (SSA) of TS mixed with CCA (1:1 wt%) carbonized at 1000°C in N2 and N2/2%CO2 gas ambient was 930 and 1094 m2g-1, respectively. Larger SSA of carbonization in N2/2%CO2 gas ambient is due to the reaction between CO2 gas and the carbon content in TS during pyrolysis. This can
II
increase pores and widen the pore size in ACs. Finally, the EFBA is more efficient in increasing the SSA up to 30% compared to the CCA with the same process conditions.
In Chapter 4, the catalytic effects of two different biomass-derived ash catalysts, chicken dropping compost ash (CCA) and empty fruit bunch ash (EFBA) on the performance of CO2
gasification of Loy Yang brown coal (LY) char were studied. The CO2 gasification was done at temperatures between 650 to 800oC. It was found that the reaction rate was strongly dependent on the temperature and the carbon conversion increases by increasing the CO2
gasification temperature. By using LY mixed with 10 wt%of EFB ash (EFBA), the maximum char conversion of 1.0 with a high gasification rate was obtained when CO2 gasification was carried out at 800oC for 30 min. Finally, the EFBA is more efficient in catalytic activity compared to the CC ash (CCA) under the same conditions.
III
Table of contents
Abstract ... I Table of contents ... III Table of Figures ... VIII Table of Tables ... XI
Chapter 1. Introduction ... 1
1.1 Current status of world energy consumption ... 1
1.2 Types of energy source ... 3
1.2.1 Fossil fuels ... 3
1.2.2Renewable energy ... 4
1.2.1.1 Biomass ... 4
1.2.1.2 Geothermal energy ... 4
1.2.1.3 Hydroelectric power ... 5
1.2.1.4 Wind energy ... 5
1.2.1.5 Solar energy ... 5
1.2.1.6 Solar thermal system ... 5
1.3 World energy production ... 6
1.3.1 Oil ... 6
1.3.2 Coal ... 7
1.3.3 Natural gas ... 8
IV
Table of contents (con't)
1.3.4 Biomass ... 8
1.3.5 Nuclear ... 8
1.4 Energy related issues ... 10
1.4.1 Global warming ... 10
1.4.2 Fossil fuel combustion ... 10
1.5 Technology development for power generation cost ... 11
1.6 Biomass conversion technology ... 12
1.7 Methods of biomass conversion ... 14
1.7.1 Direct fired or conventional steam boiler ... 15
1.7.2 Co-firing ... 16
1.7.3 Pyrolysis ... 16
1.7.4 Gasification ... 17
1.8 Description of the process ... 18
1.9 Pyrolysis process technology ... 20
1.9.1 Slow pyrolysis ... 20
1.9.2 Fast pyrolysis ... 20
1.9.3 Flash pyrolysis ... 21
1.10 Activated carbon ... 22
1.10.1 Activation process ... 24
V
Table of contents (con't)
1.10.2 Carbonization ... 24
1.10.3 Activation ... 26
1.10.4 Applications of activated carbon from lignocellulosic biomass ... 27
1.10.4.1 Removal of SO2 ... 27
1.10.4.2 Removal of NO2 ... 29
1.11 Catalytic gasification ... 29
1.12 Interesting biomass used in this experiment ... 32
1.13 Relevant research ... 33
1.14 Objective of this study ... 35
References ... 36
Chapter 2. Activated carbon from biomass using chemical reagents ... 42
2.1 Introduction ... 42
2.2 Experimentals ... 43
2.2.1 Materials ... 43
2.2.2 Experimental set-up ... 44
2.2.3 Sample preparation ... 45
2.2.4 Characterization of the activated carbons ... 45
2.3 Results and discussion ... 45
2.4 Summary ... 49
References ... 50
VI
Table of contents (con't)
Chapter 3. Preparation of activated carbons from teak sawdust using chicken dropping
compost and empty fruit bunch ... 52
3.1 Introduction ... 52
3.2 Experimentals ... 53
3.2.1 Raw materials ... 53
3.2.2 Sample preparation ... 54
3.2.3 Characterization of the activated carbons ... 55
3.3 Results and discussion ... 55
3.3.1 Preparation of ACs from TS mixed with CCA activating agent ... 55
3.3.1.1 Effects of CCA activating agent ... 55
3.3.1.2 Effects of ash to biomass weight ratio ... 56
3.3.1.3 Effects of carbonization gas ambient using CCA activating agent ... 58
3.3.1.4 Effects of carbonization temperature using CCA activating agent on CO2 gas ... 59
3.3.1.5 Effects of CO2 concentration in carbonization process using CCA activating agent ... 62
3.3.2 Comparison of CCA and EFBA activating agents ... 63
3.4 Conclusions ... 65
References ... 66
VII
Table of contents (con't)
Chapter 4. Catalytic effects of biomass on Loy Yang brown coal gasification ... 70
4.1 Introduction ... 70
4.2 Experimental ... 72
4.2.1 Materials ... 72
4.2.2 Catalytic gasification ... 73
4.3 Results and Discussion ... 73
4.3.1 Characteristic of biomass ash ... 73
4.3.2 Effect of gasification temperature on LY char conversion ... 76
4.3.3 Effects of biomass ash contents ... 76
4.3.4 Effect of biomass-derived ash type ... 78
4.3.5 Comparison of chemical reagent with ash ... 81
4.4 Conclusions ... 84
References ... 85
Chapter 5. Conclusions ... 88
Acknowledgements ... 90
Publication lists ... 92
Author biography ... 94
VIII
Table of Figures
Figure 1-1. World energy consumption from 1908 to 2030. ... 2
Figure 1-2. Historical and forecast data on global oil production in 1859 to 2100. ... 6
Figure 1-3. Historical and forecast data on global coal production in 1900 to 2100. ... 7
Figure 1-4. Global coal reserves in 2012. ... 7
Figure 1-5. World gas productions. ... 9
Figure 1-6. Development of global biomass use by main world regions from 1990 to 2010. .. 9
Figure 1-7. Global warming mechanism ... 10
Figure 1-8. CO2 emission from fossil fuel combustion by section and fuel type in 2006. ... 11
Figure 1-9. Learning curves for power generation technologies up to 2030. ... 12
Figure 1-10. Sources of biomass for conversion to energy. ... 13
Figure 1-11. Renewable nature of biomass conversion into energy. ... 13
Figure 1-12. Thermochemical processes for biomass conversion. ... 15
Figure 1-13. Schematic reaction zones of wood pyrolysis ... 18
Figure 1-14. Reaction paths of biomass pyrolysis. ... 18
Figure 1-15 Pyrolysis process technology. ... 21
Figure 2-1. Schematic diagram of pyrolysis process used in this experiment. ... 44
Figure 2-2. Specific surface area of biomass char after pyrolysis in N2 gas ambient at 1000°C. ... 46
Figure 2-3. Specific surface area of activated carbon obtained from different types of biomass mixed with various types of catalyst at the ratio of 1.0. ... 47
Figure 2-4. Specific surface area of activated carbon obtained from different types of biomass mixed with various types of catalyst at the ratio of 3.0. ... 48
IX
Table of Figures (con't)
Figure 2-5. Activated carbon yield of activated carbon obtained from different types of biomass mixed with various types of catalyst at the ratio of 1.0. ... 48 Figure 2-6. Activated carbon yield of activated carbon obtained from different types of
biomass mixed with various types of catalyst at the ratio of 3.0. ... 49 Figure 3-1. Specific surface area of TS and TS mixed with CCA. ... 56 Figure 3-2. Specific surface area and yield of ACs with different CCA to biomass weight
ratio. ... 57 Figure 3-3. Adsorption isotherm of ACs with different CCA to biomass weight ratio. ... 58 Figure 3-4. Specific surface areas of the ACs from TS prepared in pure N2 and N2/2%CO2
gas ambient at the carbonization temperature of 1000oC. ... 59 Figure 3-5. Specific surface area and ACs yield obtained from carbonization process in
N2/2%CO2 gas ambient by varied the carbonization temperature from 600 to 1000oC. ... 60 Figure 3-6. Pore size distribution obtained from carbonization process with N2/2%CO2 gas
ambient at different carbonization temperatures. ... 61 Figure 3-7. Specific surface area and ACs yield with different CO2 concentration in N2/CO2
gas ambient at 600oC. ... 63 Figure 3-8. Specific surface area of ACs from TS mixed with CCA and EFBA by varied the
ash/biomass weight ratio from 0.6 to 1.0 and carbonized in different gas ambient at 1000oC. ... 64 Figure 3-9. Pore size distribution of ACs from TS mixed with CCA and EFBA with the
ash/biomass weight ratio of 1.0 and carbonized in N2 gas ambient at 1000oC. ... 65
X
Table of Figures (con't)
Figure 4-1. XRD patterns of EFBA. ... 75
Figure 4-2. XRD patterns of CCA. ... 75
Figure 4-3. CO2 gasification profiles of LY char. ... 77
Figure 4-4. CO2 gasification profiles of LY1 char at different EFBA contents of 2 to 10 wt%. ... 77
Figure 4-5. CO2 gasification profiles of LY1 char (10 wt% of EFBA). ... 79
Figure 4-6. CO2 gasification profiles of LY2 char (10 wt% of CCA). ... 79
Figure 4-7. XRD patterns of LY1 char (10 wt% of EFBA) after CO2 gasification. ... 80
Figure 4-8. XRD patterns of LY2 char (10 wt% of CCA) after CO2 gasification. ... 80
Figure 4-9. Effect of gasification temperature on the conversion of LY char with and without mixing with 10 wt% of EFBA and 10 wt% of CCA. ... 81
Figure 4-10. Comparison of conversion of LY1 char (10 wt% of EFBA) and LY3 char of (10 wt%) of K2CO3) at 700°C. ... 82
Figure 4-11. Comparison of conversion of LY2 char (10 wt% of CCA) and LY4 char of (10 wt%) CaCO3) at 700°C. ... 82
Figure 4-12. XRD patterns of LY1 char (10 wt% of EFBA) and LY3 char (10 wt% of K2CO3) after gasification at 700°C. ... 83
Figure 4-13. XRD patterns of LY2 char (10 wt% of CCA) and LY4 char (10 wt% of CaCO3) after gasification at 700°C. ... 83
XI
Table of Tables
Table 1-1 Total ultimately recoverable conventional oil resources. ... 6
Table 1-2 Formation of different products from various types of pyrolysis ... 22
Table 1-3 Type of pyrolysis in relation to operating processes and products with greater yield. ... 22
Table 1-4 Ultimate and proximate analysis of lignocellulosic biomass used for air pollution control. ... 25
Table 1-5 Various activation conditions for preparation of lignocellulosic chars. ... 27
Table 1-6 Preparation method and adsorption capacity of various activated carbons from lignocellulosic biomass. ... 28
Table 1-7 Characteristics of activated carbon used for removal of SO2. ... 28
Table 1-8 The preparation conditions and characteristics of activated carbon for removal of NO2. ... 29
Table 1-9 The most important char-gas reactions and its effective catalysts. ... 30
Table 2-1 Proximate and ultimate analysis of raw materials ... 44
Table 3-1 Proximate and ultimate analysis of the teak sawdust ... 54
Table 3-2 Composition of metal oxide in CCA and EFBA ... 55
Table 3-3 Parameters of the activated carbon obtained from the carbonization process ... 60
Table 4-1 Proximate and ultimate analysis of the Loy Yang brown coal ... 73
Table 4-2 Elements of biomass ash ... 74
Chapter 1 Introduction
Energy is an essential physical substance to perform work for human being. The energy is useful for the economic, technology, social, which can improve our quality life. The various forms of energy such as heat, light, electrical, etc. are obtained from the conversion of the fuel. The utilizing of energy, fuel has converted numerous times before it reaches to the point-of-use such as household, factory, department store and automotive.
Typically, the energy source can be categorized into three groups (1) fossil fuel, (2) nuclear-powered source and (3) renewable energy. The fossil fuels are in the form of coal, petroleum, and natural gas. The nuclear-powered source can be produced by nuclear fission or nuclear fusion reaction. In case of renewable energy sources, the energy can be converted from solar, wind, hydroelectric, geothermal power and biomass. According to the International Energy Agency (IEA), the global energy consumption has grown up doubled in the past 50 years related to the increasing of the world population. It was predicted that 88%
of world energy will be consumed from the fossil fuels in 2030.
Not only the energy shortage which might occurs in the near future, the energy related issues, especially the global warming should be considered. Therefore, the new methods to produce energy, especially from renewable energy resource with sustainable and environmental friendly, are developing.
1.1 Current status of world energy consumption
Nowadays, the main energy consumption is fossil fuels including oil, gas, and coal. The fossil fuels consumption will reach 10 gigatons of oil equivalent (Gtoe) per year with 1.6 tons of oil equivalent (toe) as energy consumption per occupant. According to IEA research, the
2
primary energy consumption has grown by 49% but the CO2 emission was also increased by 43% during past two decades (1984–2004) [1-3]. The average annual increasing of energy consumption and CO2 emission was 2% and 1.8%, respectively. Moreover, the world energy consumption is predicted to increase up to 70% in 2030 as the graph shown in Fig. 1-1. The world gross inland consumption (GIC) shows that oil still represents the largest share of the energy source (34%) in 2030.
It was predicted that the global energy that obtains from renewable sources including hydropower, geothermal energy wind, solar and hydropower energy will reach 8% of total world energy requirements in 2030. This prediction is lower than 13% of the energy utilizing that observed in 2000 due to the continuous decline of biomass consumption in Asia and Africa. However, the evolution of the share of renewables in total energy consumption in Europe countries is highest progression among other industrialized regions.
Figure 1-1. World energy consumption from 1908 to 2030.
3
1.2 Types of energy source
In this section, the types of energy source including fossil fuels, renewable energies, and nuclear-powered source will be briefly introduced.
1.2.1 . Fossil fuels [4-8]
The fossil fuels are the energy source that obtained from the remains of ancient plants and animals, which accumulated in the geologic over hundreds of millions of years. Those organic materials are acts like hydrocarbon-containing natural resources. After those natural buried substances are reacting with the heat and pressure in the earth's crust, it can be converted to the form of coal, crude oil, natural gases and heavy oils.
Coal is formed by the decomposing of remained plants by using high atmospheric pressure and high temperature through the calcification process. Based on the different types of the nature sources, more than 1,200 different compositions of coal are available.
The natural gas is one form of fossil fuels that commonly found at the inner layers of earth or at the surface of the petroleum reservoirs. Among the natural gases, methane is the environmental friendly compared to the other forms of fossil fuel that normally used for household purpose.
Petroleum is transformed by the remains of oceanic plants and bacteria over million years.
This type of fossil fuel is consumed around 40% of the world demand of energy.
Crude petroleum is used to produce various types of distillate fuels such as kerosene, jet fuel and so on. Moreover, the by-products of the petroleum distillation can be used in plastic production.
Although the fossil fuels are useful energy resource, the utilizing of fossil fuels is one of the largest sources to emit the carbon dioxide (CO2) to the atmosphere. The accumulation layer of CO2 in the atmosphere can reflect the UV radiation to the ground and it also can trap the heat, which is the root cause of greenhouse effects that contributes to global warming.
4
1.2.2 Renewable energy
The renewable energy is the clean energy that considering using instead of conventional fossil fuels. The sources of renewable energy from natural are rain, sunlight, wind, waves, tides, and geothermal heat. Typically, the renewable energy can be applied in four applications; (1) electricity generation, (2) air and water heating/cooling, (3) rural energy services, and (4) motor fuels. In this section, six types of renewable energy sources including biomass, geothermal energy, hydroelectric power, wind energy, solar energy, and solar thermal systems will be introduced.
1.2.1.1 Biomass [9-10]
Biomass is a carbon-based biological material that derived from plant-based materials, which is a living or recently living organisms. Biomass is a substance that composed with a mixture of organic molecules including hydrogen, oxygen, nitrogen, alkali, alkaline earth, and heavy metals. The metal components in biomass are found in the form of functional molecules called porphyries, which include chlorophyll that contains magnesium.
1.2.1.2 Geothermal energy [11-13]
Geothermal energy is an energy that release from the earth’s core. The high temperature around 5000°C of the earth’s core can melt the outer layers of mantle and become magma.
When the rain water seeps down through the cracks of geological, it will react with superheated of the magma or the hot rocks beneath. Then the rain water that suddenly heated at the magma surface will vaporized and release back to the earth surface in the form of high pressure vapor. An example of the utilizing of geothermal energy at the earth surface is hot springs (or called geysers).
5
1.2.1.3 Hydroelectric power [14-15]
Hydroelectric power is the form of electricity that generated by the movement of water stream on the hills and mountains that that eventually move down to the lower ground level by gravity force. The movement of water pass through the turbine blades can generate electricity. The cycling of rain fall and melting snow make the hydropower is the cheapest and most clean fuel renewable source.
1.2.1.4 Wind energy [16]
Wind energy is generated by converting wind flow through the wind turbines. The wind turbines convert the force of the wind to propel an electric generator to create electricity. The multiple wind turbines can be installed on-shore (land) and off-shore (sea) to generate the electricity grid.
1.2.1.5 Solar energy [17-18]
The solar energy is an energy source that can be used to produce electricity. The heat and photons in the sunlight is reacts with the surface of semiconductor device called Photovoltaic (PV) cell. The photons and sunlight energy is collected by the PV cell and convert to electricity that can keep in the battery for further utilization.
1.2.1.6 Solar thermal system [19-20]
Solar thermal electric energy is the energy that utilizing the sunlight to heat up the fluid or gas in the heat engine to rotating the motor. The heat engine such as steam engines and gas turbines has efficiency around 30 to 40%, which can produce megawatts of power.
6
1.3 World energy production 1.3.1 Oil
The majority of oil production comes from different offshore area such as West Siberia, Persian Gulf region, East Siberia, Caspian Sea, South America, and Gulf of Mexico.
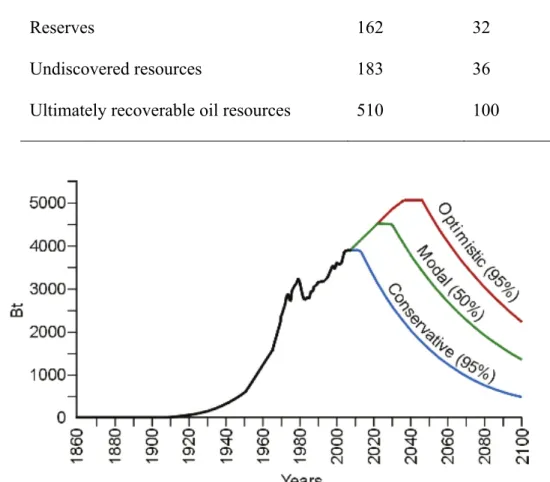
Table 1-1 estimates that the average world conventional oil ultimately recoverable resources (URR) is 510 Bt. Figure 1-2 shows that by the end of the 21st century, world cumulative oil production will reach 4700 to 5000 Bt.
Table 1-1 Total ultimately recoverable conventional oil resources.
Indicator Bt %
Cumulative production 165 32
Reserves 162 32
Undiscovered resources 183 36
Ultimately recoverable oil resources 510 100
Figure 1-2. Historical and forecast data on global oil production in 1859 to 2100.
7
1.3.2 Coal
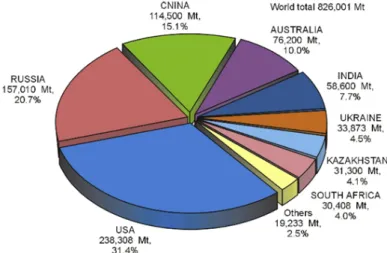
Figure 1-3 shows that the global coal production predicted by IPGG is around 10 to 12 Btpa in the year of 2030 to 2040. The limits to growth in global coal production are related to the environmental restrictions and depletion of the coal resource base. However, United States of America (USA) and Russia reserves coal more than 50% of the total world coal reserves (395 Bt). Those countries plan to increase their coal production in the 21st century. Figure 1-4 show that the world coal reserves (431 Bt) except USA and Russia, will produce about 10 to 11 Bt by 2060. Therefore, many countries are increasing their investments in exploration of high-grade coal resources. [21]
Figure 1-3. Historical and forecast data on global coal production in 1900 to 2100.
Figure 1-4. Global coal reserves in 2012.
8
1.3.3 Natural gas
Figure 1-5 show the increasing of the world gas production from 1975 to 2025. The OECD region shows the increasing of gas production of 3% between 2000 and 2025. It was predicted that OECD will produce more than 40% of the world’s total gas production in 2025.
However, the CIS region also produce one third of the gas production, which is almost equally allocated to OECD. Moreover, ten largest gas producers across the different continents will support more than 80% of the world’s total natural gas production in 2030. [22]
1.3.4 Biomass [23]
Figure 1-6 shows that OECD Europe has increased the global sharing of bioenergy demand from 6 to 10%, while China decreased their sharing from 22 to 16%. Among the different types of biomass, wood fuel such as pellets, fuel wood and charcoal, and biodiesel, palm oil, bioethanol are the most widely used and commercial. The volume of trading the wood products that used as energy has reached 1 EJ in 2011. This amount is equal to 2% of the total use of biomass energy around the world. The wood pellets is the largest biomass products that has been traded (130 PJ) in 2011. The mainly wood pellets are based on sawdust and wood residues as feedstock. Moreover, the bioethanol which exported from Brazil (48%), USA (6%), and France (6%) are more than half of the global market.
1.3.5 Nuclear [24]
In 2005, the 442 nuclear power plants in global with a total capacity around 370 GWe produced 16% of the world total electricity power consumption (2626 TWh). Among the worldwide, USA has the largest number of reactors while France using nuclear power as a main source for electricity generation. It was predicted that the nuclear power plants in global will have a capacity between 279 and 740 GWe in 2030.
9
In Japan, nuclear power is the main source for electrical generation. Therefore, more than 55 nuclear reactors are currently operated to produce 40% of total national electricity consumption. However, the plans for construction of new reactors in Japan have been scaled down due to the safety consideration after the disaster at Fukushima nuclear power plant. In China, nine reactors are in operation and 40 new reactors will be installed to support a total capacity of 41 to 46 GWe by 2020.
Figure 1-5. World gas productions.
Figure 1-6. Development of global biomass use by main world regions from 1990 to 2010.
10 1.4 Energy related issues
1.4.1 Global warming [25-26]
Global Warming is one of the most severe problems in global due to the increasing of average surface temperature of the atmosphere. By burning the fossil fuels, various types of gases such as carbon dioxide (CO2), carbon monoxide (CO), methane, nitrous oxide are released to the atmosphere. It was found that increasing small amount of carbon dioxide (CO2) in atmospheric can cause a substantial increase in the Earth’s surface temperature. The mechanism of CO2 emissions from and trap heat to escape from Earth atmosphere are shown in Fig. 1-7. As we know that the earth’s temperature is going to increase due to huge consumption of fossil fuels in the next century. Therefore, the reduction of the emission of CO2 to the atmosphere should be decreased to prevent the disaster from the greenhouse effects.
1.4.2 Fossil fuel combustion
During the combustion of fossil fuels such as petroleum, natural gas, and coal to produce energy, the carbon content such as CO2 that stored in fossil fuels is emitted to the atmosphere.
Figure 1-8 shows that the petroleum supplied the largest portion of domestic energy demands, accounting of 47 % of total fossil-fuel-based energy consumption in 2006. In contrast, coal and natural are taken account of 27 and 26 % of total fossil fuel consumption, respectively.
Figure 1-7. Global warming mechanism. [25]
Sunlight Sunlight
Earth Earth
Greenhouse gas Greenhouse gas
Sea Land Sea Land
11
Figure 1-8. CO2 emission from fossil fuel combustion by section and fuel type in 2006 [27].
1.5 Technology development for power generation cost [28]
Besides the limits of natural sources of fuels that might be affects to its prices in the future due to mismatch of demands and supply and the CO2 emission from the fuel combustion process that generate the greenhouse effects, the development of alternative energy technologies is required. The projection of technology development that is consistent with historic trends is shown in Fig. 1-9.
To describe the enhanced technology performance, the conversion efficiency, total investment cost and operation cost are changed. The hybrid approach is applied to the technology development to estimate the amount of research that necessary to bring about accelerated technological progress rather than the issue of higher R&D investments. This can be used to determine the focusing technology policies to provoke technological development.
Note: Electricity generation also includes emissions of less than 0.5 Tg CO2 Eq. from geothermal-based electricity generation.
12
Figure 1-9. Learning curves for power generation technologies up to 2030.
1.6 Biomass conversion technology
Biomass is the most abundant and renewable organic resources that comprises of all biological materials. The biological waste (dead biomass) can be used for producing the energy such as electricity and heat or used for an indirect source of energy such as fuels. The living organisms or their components such as algae, microorganisms and enzymes can be used to produce energy using biofuels cells. Figure 1-10 shows various sources of biomass that can be used for biomass conversion into energy. In the total process of biomass conversion to energy, including the purpose of energy generation and environmental cleanup is accomplished.
Investment [Euro/kW]
Cumulative installed capacity [MW]
13
Figure 1-10. Sources of biomass for conversion to energy.
Figure 1-11. Renewable nature of biomass conversion into energy.
The factor of timeframe is one important parameter that should be considered for the renewable of the energy source. For example, the energy from the fossil fuels such as coal, oil, and natural gas take million years to renew. Beyond the fossil fuels, sunlight is an infinitely abundant renewable source of energy. Therefore, it is very interesting to reduce the time frame that required to converted sunlight into usable energy.
14
Among those renewable energy sources, biomass such as plants and trees are excellent sources. Those biomasses can be considered as perpetual capable utilizing photosynthesis to continuously tapping the energy from sunlight and converting it into carbon-rich compounds as the mechanism shown in Fig 1-11.
Figure 1-11 shows the carbon that released into the atmosphere from burning process of biomass can returns to the biomass by photosynthesis. After that, it is converted into carbon-rich compounds for reconversion into energy. The photosynthesis process can produce carbon positive, which is the carbon neutral unlike fossil fuel. For example, the remaining CO2 in the atmosphere from the burning process of fossil fuel increases the total amount of CO2. However, the conventional sinks such as trees and soils cannot absorb large amount of CO2 in the atmosphere.
Therefore, it is necessary to reduce the global CO2 emissions by using the effective energy generation technologies, which generates carbon negative. Based on various technologies, Bioenergy with carbon capture and storage (BECCS) method are expected to obtain net negative carbon emissions in global. This carbon capture and storage (CCS) technology can release of CO2 into the atmosphere and redirect it into geological storage area.
Beyond the BECCS and CCS technology, high solar efficiency cultivation is an alternative method to achieve carbon negative.
1.7 Methods of biomass conversion [28-32]
The technologies of biomass conversion can be classified into primary and secondary conversion technologies. The primary conversion technologies such as combustion, gasification and pyrolysis are directly convert the biomass into heat or other convenient form of energy carrier such as (1) gases (methane and hydrogen), (2) liquid fuels (methanol and ethanol), and (3) solids (char). The secondary technologies convert these primary conversion
15
products into the desired form of energy product such as transportation fuel or electricity. The different thermochemical conversion processes are given in Fig. 1-12.
Figure 1-12. Thermochemical processes for biomass conversion.
The thermochemical processes involve high temperature and high pressure processing of biomass. The combustion process to generate heat and/or power such as direct fried (conventional steam boiler) and co-firing is done by heating the biomass in the excess oxygen ambient. Those techniques are accounting for over 97% of the world’s bioenergy production.
The other processes such as pyrolysis and gasification are the heating process in the presence of controlled oxygen to produce liquid fuels, heat and power.
1.7.1 Direct fired or conventional steam boiler
The direct fired or conventional steam boiler is the technique to covert the woody biomass to the energy. In a direct-fired system, biomass is feed into the bottom parts of the boiler, which connected to the air supply. When the biomass feedstock is burned, the hot
16
combustion gases are generated and pass through a heat exchanger. In this step, the water is boiled and become a high pressure water steam that can use to rotate the turbine to generate the electricity by driving the electricity generator.
To improve the efficiency of the direct fried process, the starting biomass is dried and the size is reduced by Pelletization process. The size of pelletized (briquetted) biomass that was reduced by mechanical process can improve the handling and the combustion characteristics of biomass. For much more efficiency, the heat generated by the exothermic process of combustion to power the generator can also be used to regulate temperature of buildings and plant.
1.7.2 Co-firing
Co-firing is the simplest method to convert the biomass to energy by burning two different types of materials at the same time. For example, the mixing of woody (15 wt%) with biomass such as willow and switch grass can reduce the materials cost. The advantages of adding small portion of biomass in coal boiler is to decrease the nitrogen and sculpture oxides, which causes the formation of various types of air pollutions such as smog, acid rain and ozone. Moreover, small amount of CO2 is released into the atmospheres. Therefore, the co-firing method is low cost, more efficiency, cleanly and sustainable renewable energy.
1.7.3 Pyrolysis
Pyrolysis is an attractive method overcome the solid biomass due to it can convert solid biomass into a transportable and easily stored fuel. In pyrolysis, the residues biomass from nature such as wood residuals, and biogases, is inserted to high temperatures vacuum chamber in the absence of oxygen resulting the generation of pyrolysis oil (bio oil), chars, or singes. The advantage of pyrolysis process is that ash or energy did not generated during transformation. The types of biomass is significantly effects the efficiency of pyrolysis
17
method. For example, straw and other agro-residues are important as an energy sources.
However, straw has high ash content which causes problems in pyrolysis.
1.7.4 Gasification
Gasification is a high efficiency process that can convert biomass into combustible gases. There are two kinds of gasification process called direct gasification and indirect gasification. Direct gasification process uses the combustion of air or oxygen to generate heat through exothermic reactions. Indirect gasification process can transfer heat to the reactor from the outside. The burned gas by-products can produce the heat for industrial and house and it can use for mechanical or electrical power purposes. The conversion efficiencies obtained from gasification is between 60 to 90%. Moreover, the gas can also use to produce synthetic fuels.
Biomass gasifies can be categorized to updraft and downdraft. In case of updraft unit, biomass is fed from the top of the reactor and air is injected into the bottom of the fuel bed.
By this setting, the efficiency of updraft gasifies can increase up to 90%. However, the gas must be cooled before usage in the internal combustion engines due to the formation of tars.
Therefore, updraft unit is normally used for direct heat applications. Among those gasification processes, the fluidized bed technology has a higher throughput due to its superior heat and mass transfer with good uniform temperatures that creates faster rate of reaction. Furthermore, the fluidized bed technology has better fuel moisture utilization compared to the others gasification techniques.
18 1.8 Description of the process [30, 32]
Thermochemical conversion of biomass such as pyrolysis, gasification and combustion is the most promising technologies for energy production. In this section, the details of pyrolysis process will be introduced. Pyrolysis is one of the thermochemical conversion processes that decompose the organic materials at elevated temperature as the schematic shown in Fig. 1-13. Note that the oxygen did not participate into the pyrolysis process. When the temperature is below 400°C, the pyrolysis process is defined as carbonization which can produce charcoal, liquid fuels (heavy and light oils) and fuel gas.
However, when the pyrolysis temperature increases to 1000°C, a complete gasification of biomass has occurred.
Figure 1-13. Schematic reaction zones of wood pyrolysis [30]
Figure 1-14. Reaction paths of biomass pyrolysis.
19
Figure 1-14 shows the reaction paths of biomass pyrolysis. In this reaction, the solid materials are transformed into liquid and gas fractions with low to medium calorific value.
The calorific value is combines with synthesis gas (CO, H2 and CH4) and other low molecular weight hydrocarbons. The liquid fraction that contains water and organic compounds with low to medium molecular weight is called Tar. A solid carbonaceous portion is called Char. Therefore, the advantages of pyrolysis are the capability to use wide variety of materials and it can produce lower emissions of nitrogen oxides and sulphur compared with other technologies. Moreover, the energy recovery of pyrolysis process can reaches up to 70%. [33]
Typically, the by-products that obtain from pyrolysis reaction can be classified into three groups called (1) synthesis gas, (2) tar, and (3) char. The synthesis gas is compose of primarily of hydrogen, carbon oxides (CO and CO2), and gaseous hydrocarbons such as methane. The calorific value of synthesis is around 13 to 15 MJ/Nm3.
Second, tar is the liquid product in the form of condensable organic (bio-oil) that obtain from pyrolysis. The oily liquid portion consists of two phases called aqueous phase and non-aqueous phase. An aqueous phase is an organic compounds containing oxygen with a low molecular weight. A non-aqueous phase is an insoluble organic compound with a high molecular weight such as aromatic.
Char is a solid carbon residue with low ash content. The density of char is 150 to 300 kg/m3 and it has a relatively high PCI (30 MJ/kg). Typically, char is used as a fuel to power the pyrolysis process. Char also can be used for drying the biomass before putting it into the reactor. Char is stable and complex for handling and does not degrade biologically.
20 1.9 Pyrolysis process technology [32-35]
Bio-oil from pyrolysis process can be used instead of conventional fuel oil and diesel for electricity generation equipment such as furnaces, boilers and turbines. The utilizing of pyrolysis is shown in Fig. 1-15. Based on the process parameters (reaction temperature, heating rate, residence time) and products, pyrolysis can be categorized into three groups; (1) slow pyrolysis, (2) fast pyrolysis and (3) flash pyrolysis.
1.9.1 Slow pyrolysis
Slow pyrolysis is typically occurs at reaction temperature over 400°C with long residence time of 4 to 8 mins. The heating rate of 1 to 5°C/sec is typically used to balance and stabilize the reactions. By using this optimized condition, large amount of gaseous phase of the products will be obtained because of the complete secondary reactions. When the process temperature increased from 400°C to 700°C, the final char yields and liquid products decreased due to increasing of volatiles from tar. The maximum value of liquid products can be obtained at the temperature of 550°C. That means, slow pyrolysis is subjected to the secondary reactions which generates small amount of liquid products but generates large amount of gas products.
1.9.2 Fast pyrolysis
Fast pyrolysis is typically occurs at reaction temperature between 500 to 950°C with very short residence time of 1 to 5 s. The heating rate of fast pyrolysis is 100 to 300°C/sec.
The purpose of short residence time is to reduce the formation of intermediate products and also increase the yield of tar up to 80 wt% of dry biomass. When the residence time is too short (< 1 s), an incomplete depolymerization of biomass has occurred. Moreover, the liquid product is
21
Figure 1-15. Pyrolysis process technology.
not homogeneous due to the contribution of instability of bio-oil. To produce a high heating rate, the cool down pyrolysis vapors should be very rapidly to obtain more stable product. To produce a high heating rate, smaller homogenous particles are necessary. The small homogeneous particles are often pre-treated with mechanical grinders. The fast pyrolysis is very interesting technology because the produced liquid fuel is more dense and easier to handle.
1.9.3 Flash pyrolysis
Flash pyrolysis is a pyrolysis with high heating rate more than 1000°C/s and short residence times of 0.1 to 1 sec. solid and volatile components. When the temperature is between 450 to 750°C, more than 80 wt% of liquid fraction can be achieved. When the temperature is higher than 750°C, the gas production can reach 80 wt% of the weight of the products by using high speed reaction. The flash pyrolysis process has less tar and the calorific value of gas increases around 5 to 10%. Table 1-2 and Table 1-3 show the summary of different types of pyrolysis.
22
Table 1-2 Formation of different products from various types of pyrolysis [35]
Technique
Process conditions By products
Temperature (°C) Residence time (s) Liquid Gas Char
Slow pyrolysis 400 Very long 30% 35% 35%
Intermediate pyrolysis
500 10 to 20s 50% 30% 20%
Fast pyrolysis 500 > 2s 75% 13% 12%
Table 1-3 Type of pyrolysis in relation to operating processes and products with greater yield.
Pyrolysis type Residence time
Temperature (°C)
Heating rate Products
Carbonisation Days 400 to 500°C Very slow Char
Slow pyrolysis 4 to 8 min 400 to 700°C 1 to 5 °C/s Gas Fast pyrolysis 1 to 5 sec 500 to 950°C 100 to 300 °C/s Tar
Fast-liquid
pyrolysis < 1s 450 to 750°C > 1000°C/s Tar
Fast-gas pyrolysis < 1s > 750°C > 1000°C/s Gas
1.10 Activated carbon [36-40]
Activated carbons (ACs) are carbon with highly microporous structure, high specific surface areas (SSA) and good adsorption properties. ACs allows the gas/liquid access into internal pore surface and high degree of surface reactivity. ACs is an attractive material use in various applications such as wastewater treatment, harmful gases removal in the air and solvent recovery and ground water improvement. Nowadays, the agricultural by-products
23
have proved to be promising raw materials for the production of ACs because of their availability at a low-cost, renewable and environmental friendly.
Lignocellulosic biomass is one of abundant agricultural wastes to produce ACs that used for water and air pollution treatment. The advantages of ACs from lignocellulosic biomass over the ACs from fossil sources are less emission of CO2 due to its carbon-neutral cycle in the conversion process, reduce the amount of abundantly agricultural wastes and low cost. Generally, the main components of lignocellulosic biomass are comprises with cellulose, hemicellulose and lignin. Among those components, lignin is identified as the useful component for the adsorption process due to the rich carbon content in lignin. Note that the worldwide production of lignin-based biomass is 40 to 50 million tons per year.
ACs with high adsorption capacity can be produced from numerous sources of lignocellulosic biomass such as coconut shell, durian shell, hazelnut shell, rubber seed shell, palm kernel shell, almond shell, cotton stalks, plum stones, rice husk, pistachio-nut shell, walnut shell, wood, etc. Lignocellulosic ACs can be used for chemical processes, petroleum refining, waste water treatment, air pollution treatment and volatile organic compounds (VOC) adsorption. Moreover, ACs obtained from Lignocellulosic provides an effective way for gas phase applications such as for purification, separation, deodorization, storage and catalysis.
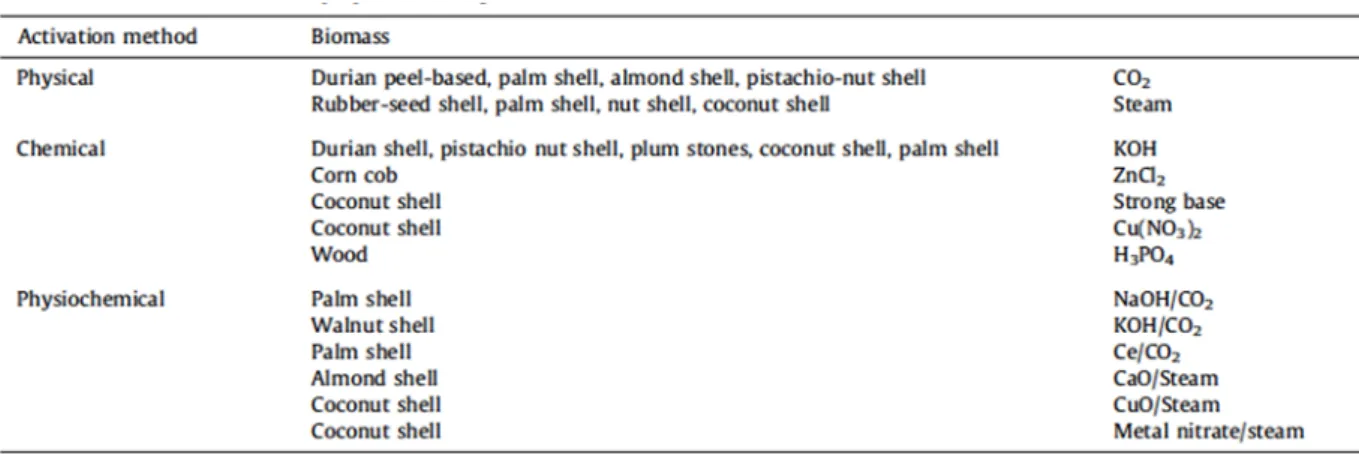
To produce the ACs, the carbonization or pyrolysis process is firstly requires to converse the char from biomass. In this process step, moisture and volatile compounds are removed from the biomass. After the char producing, ACs can be fabricated using three different processes: physical activation, chemical activation and physiochemical activation.
Physical activation is related to the gas-activating agents such as steam and CO2. The chemical activation involves the presence of chemical agents such as metal oxide, alkaline
24
metal and acid. After the activation process, ACs with high porosity, large surface area and high pore volume can be obtained.
1.10.1 Activation process
In the present days, the carbonization of lignocellulosic biomass to produce ACs is widely study. Typically, the carbonization was done at the temperature below 800oC in the absence of oxygen ambient. After that, the activation process is required to increase the surface area and pore volume of ACs. There are two different activation processes called physical activation and chemical activation.
1.10.2 Carbonization
The carbonization process is a thermal decomposition process that can eliminate a non-carbon species and thus enrich the carbon content in carbonaceous material. The initial porosity of char that obtained from carbonization process is still comparatively low.
Therefore, the porosity of char in activation process should be further developed due to the products of this process step are significantly effect on the final product.
Among the carbonization process parameters such as heating rate, nitrogen flow rate and the residence time, the carbonization temperature is the most important parameter.
Normally, high carbonization temperatures in the range between 600 to 700oC can reduce the yield of char but can increase the liquid and gases release rate. Higher temperature is preferred to obtain high quality char due to an increasing of amount of ash and fixed carbon content with lower amount of volatile matter. Unfortunately, high carbonization temperature can also decrease the yield due to the reduction of primary decomposition of biomass, the decreasing of residence times of primary vapors inside the cracked particle and secondary decomposition of char residue at high temperature. Moreover, high carbonization
25
temperatures also increase ash and fixed carbon content due to the decreasing of volatile matter.
Char with a high fixed carbon content is requires for producing ACs. Low volatilization with a high char yield can be obtained by using low carbonization heating rates of 10 to 15oC/min. The low heating rate increases the dehydration and improves the stabilization of the polymeric components [2-3]. However, the microporosity of char is independent to the precursor composition and the carbonization heating rate. Table 1-4 shows the proximate and ultimate analysis of several lignocellulosic biomass materials. It was found that the carbonization is an important process to develop the initial pore structure in the char.
This can be explained by the release of volatile compounds from the carbon’s matrix.
Regarding to the pore development in the char has a great influence on the pore characteristics of subsequently ACs production, the carbonization parameters should be taken into account prior to activation process.
Table 1-4 Ultimate and proximate analysis of lignocellulosic biomass used for air pollution control.
26 1.10.3 Activation
The activation process is use to increase the pore volume by increase the diameter of pores, and thus increasing the porosity of ACs. ACs can be performed by three different methods: physical activation, chemical activation and physiochemical activation (a combination of physical and chemical activation). Physical activation use steam or CO2 while the chemical activation uses various chemicals. The preparation of ACs from lignocellulosic precursors by using various activation conditions is shown in Table 1-5. In the activation process, unorganized carbon is removed during the first stage. Hence, the exposing of lignin to the activating agents can lead to the development of micro-porous structure. In the second stage of the reaction, the existing pores are widened and large size pores are formed. The walls between the pores are simultaneously burnt-off. Completely burnt-off the wall of the pores can increases the transitional pores and macro-porosity but also decreases the volume of micro-pores. Therefore, the extension of burn-off carbon material is an important parameter in activated carbon production.
During activation, the temperature is typically set between 800 to 1000oC to increase the porosity and surface area of lignocellulosic carbon. In the physical activation, steam is more effective than CO2 due to the smaller molecule of water can diffuse within the porous of char faster than CO2 molecule. Therefore, steam activation is two or three times faster than CO2 at the same conversion process. By using the steam, ACs with a relatively high surface area compared to CO2 can be produced.
In the chemical activation, various chemical agents such as ZnCl2, H3PO4, KOH and NaOH are used to develop the porosity. Generally, the chemical activation is takes place at the temperature of 300 to 500oC, which is lower temperature than physical activation. The dehydration and degradation mechanism of chemical agents can improves the development of pore in carbon structure by using shorter treatment duration compared to physical activation.
27
Table 1-5 Various activation conditions for preparation of lignocellulosic chars.
In addition, the chemical activation process can form the ACs with larger surface area with smaller ranges of micro-porosity compared to physical activation process. Furthermore, the carbon yield of chemical activation is higher than that of physical activation.
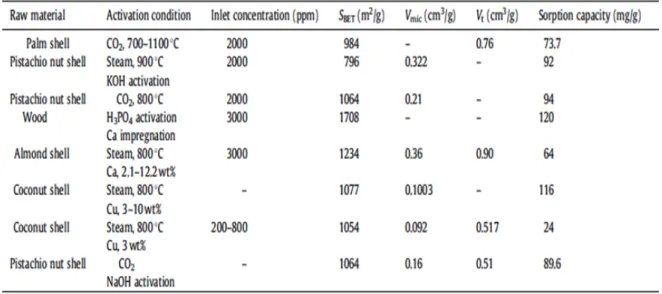
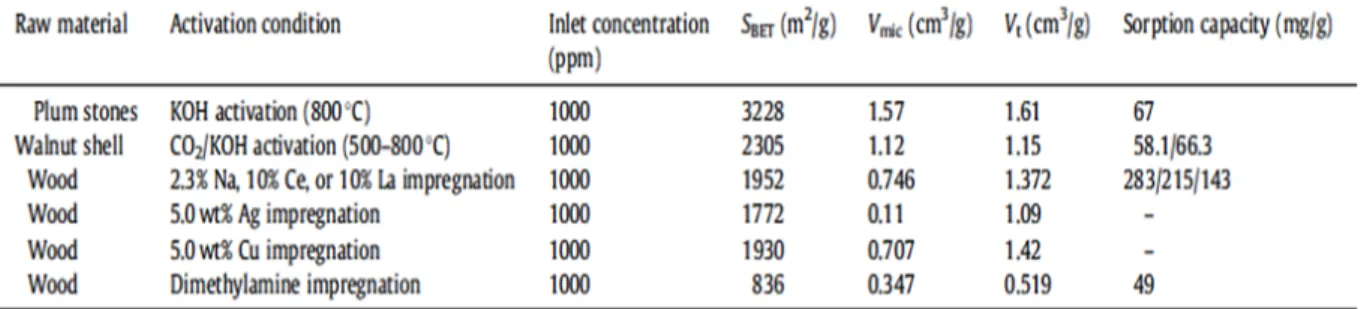
1.10.4 Applications of activated carbon from lignocellulosic biomass
The rapid development in industrial activities that follows the growth of the world population severely degraded the air quality due to high amount of pollutant emissions to atmosphere. Therefore, air pollution control is a crucial step to achieve a sustainable energy development. Currently, scrubbing gaseous pollutants using the adsorption method by adsorbents such as ACs is widely used due to it has a suitable pore size in the micropore region (< 2 nm) for gas adsorption and it has a large surface area for rapid reaction. A summary of gaseous pollutants removal by various lignocellulosic ACs such as SO2, NOx, H2S, volatile organic compounds (VOCs) and CO2 is presented in Table 1-6.
1.10.4.1 Removal of SO2
SO2 is the main precursors for acid rain generation, which is the most serious global environment problem. The utilizing of ACs for SO2 adsorption through physical adsorption and chemical adsorption takes a several advantages compared to the earlier methods. The
28
utilizing of metal oxides components in ACs that impregnated with the chemicals method to remove SO2 from coal and oil combustion exhaust has been studied.
Table 1-6 Preparation method and adsorption capacity of various activated carbons from lignocellulosic biomass.
Table 1-7 Characteristics of activated carbon used for removal of SO2.
29 1.10.4.2 Removal of NO2
The ACs with high porous structure that obtained from Lignocellulosic biomass is widely used for minimizing the emission of NO2 gas. In addition, the surface chemistry that defines by the type, number and chemical arrangement of heteroatoms on their surface are considering. The dry adsorption process has better adsorption capacity compared to other method due to the reaction mechanism is significantly changed and difficult to control in the water. The micropores of activated carbon produced under optimum condition contributed up to 96% of total pore volume. Preparation conditions and characteristics of activated carbon for removal of NO2 are summarized in Table 1-8.
1.11 Catalytic gasification [41]
The gasification reaction is the important parameter to the catalytic or inhibiting effects of the mineral matter in coals and chars. It is well known that a number of inorganic elements present in coal/char have potential effects on the rates of gasification reaction on the coal/char surface and in the gas phase. The reactions in the gas phase are contributed to ash particles, whereas the reaction on or inside the reacting coal/char particles are contributed by the dispersed minerals in the coal/char body. Generally, the alkali, alkaline earth, and transition metals are the most effective catalysts for char-gas reactions as shown in Table 1-9.
Table 1-8 The preparation conditions and characteristics of activated carbon for removal of NO2.
30
Table 1-9 The most important char-gas reactions and its effective catalysts.
Reaction Effective catalysts
Char-oxygen Fe, Co, Ni
Char-steam K, Na, Ni
Char-carbon dioxide K, Na, Li, Ni, Co, Fe, Ca
Char-hydrogen K, Ni
When a catalytic effect is significant, the rate expression is depends on the presence or absence of catalysts. To isolate such effects, kv and ks is determined by Eq. 1-1:
kv = Zvkvt and ks = Zskst (1-1)
Where kv and kst are the true rate constants of a reaction, and Zv and Zs represent the effect of catalysis. The correct values of true rate constants are extremely difficult to determine. However, the presence of a trace of solid or gaseous impurity is a significant effect on the measured rate. Therefore, the rate expression shows in Eq. 1 is useful. As we know that catalysts or impurities effects on the pre-exponential factor, kv0, and also the activation energy, E, of carbon-gas reactions. Therefore, the values of E in carbon-CO2 and carbon-O2 reaction systems have decreased due to the presence of catalytic minerals in coal.
The catalytic effects on the values of Zv and Zs for a given catalytic mineral are depend on four factors; (1) The chemical form of the catalyst, (2) The physical form of the catalyst, (3) The amount of catalyst, and (4) The temperature of reaction.
Thus Fe, Co, and Ni is effective catalysts in their elemental states or when they are transformed to the elemental states during reaction. However, Potassium (K) and sodium (Na) is the most effective in the form of carbonates and least effective as phosphates. Among
31
the oxides of iron and other transition metals, the stoichiometry of deficient oxides is better catalyzes in C-CO2 and C-H2O reactions. This means, FeO or Fe3O4 is a better catalyst than Fe2O3 in the same reactions.
Among the salts of those metals, the organic salts like oxalates, acetates, and citrates show superior catalytic effects than those of the inorganic salts. This is because the former group of salts yields finer subdivision and dispersion of the metal ions inside the body of the reacting solid particles. The catalytic activity can be decreased by increasing the size of the dispersed catalyst particles. The activity increases with an increase in the amount of catalyst (or impurity) and then reaches the saturation point. However, larger amount of catalyst is not an appreciable effect.
It was reported that the reduction of agglomerating tendency of caking coals can be obtained by treatment of coals with Na2CO3 and/or K2CO3 (15 wt%) solutions at 700oC. It was found that the rate of gasification is proportional to the concentration of the impregnated potassium. It was also demonstrates that the agglomeration of coal can prevent by impregnation of CaO into coal before gasification process due to the increasing of coal/char reactivity and hydrocarbon yields in the gasifier.
It is believed that impurities decrease the CO/CO2 ratio in the C-O2 reaction, because the impurities catalyze the secondary CO à CO2 reaction, without significantly affecting the primary reaction, C à CO. This is because the CO and H2 are inhibitors of C-CO2 and C- H2O reactions. However, this reaction is true only for un-catalyzed reactions. If the reactions are catalyzed by oxides of Ni, Co, or Fe, then the CO, and H2 may act as promoters.
Therefore, the promoters might reduce the oxides of Ni, Co, and Fe. Moreover, if the process temperatures are suitable, they can be changed to metallic states, which are the most effective catalysts for gasification reactions. By using the same mechanism, steam may also act as a promoter for these reactions, since it produces H2 and CO with carbon or char.
32
1.12 Interesting biomass used in this experiment [42-44]
In this experiment, three types of biomass including Chicken dropping compost (CC) from Japan, Empty fruit bunch (EFB) from Malaysia and teak sawdust (TS) from Thailand were studied. The EFB from Malaysia is the interesting biomass due to the large amount of oil palm biomass about 30 million tons is produced each year. The remained agricultural waste from the oil palm industry that can be used as renewable biomass is approximately 17.08 million tons a year. The EFBs with a relatively wet material (moisture content about 65 to 70 wt%) constitute 9% of the total oil palm industry.
In case of Teak sawdust (TS), it is the biomass that obtained from Thailand. In Thailand, around 350 to 700 million tons of TS were produced a year. This material is very attractive for carbon source. The chicken dropping compost (CC) from Japan is also interesting materials due to it can produce up to 13 million tons per year. However, the utilizing of CC is not suitable due to the pollution of air, soil, and ground water. The summarized data of those interesting materials are shown in Fig. 1-16.
Figure 1-16. Interesting biomass used in this experiment.
Teak sawdust (Thailand)
(c)
Empty fruit bunch (Malaysia)
(a) (b)
Chicken dropping compost (Japan)
33 1.13 Relevant research
Garcia et. al. [45] studied low cost activated carbons with high surface area by chemical activation using KOH at 700oC from the bamboo and residues from shells of the fruits. The high porosity with surface areas ranging from 850 to 1100 m2/g was obtained. The average pore width centered in the super micro-pores in the range of 1.3 to 1.8 nm. The electrochemical performance of the activated carbons shows specific capacitance values at low current density (1 mA/cm2) as high as 161 F/g in the shell of fruit activated carbon. This is due to the presence of pseudo capacitance derived from surface oxygenated acidic groups identified in this activated carbon.
Okman et.al. [46] studied the effects of activation reagents, reagent concentrations and carbonization temperatures. It was found that lowest ACs yields were obtained at 800oC for both K2CO3 (100 wt%) and KOH (100 wt%) reagents. By using the temperature of 800oC, By using K2CO3 (50 wt%) and KOH (25wt%), microporous ACs with the highest specific surface area of 1238 and 1222 m2g-1 were obtained at 800oC.
Sudaryanto et.al. [47] reported by using the cassava peel with KOH activation reagent at the carbonization temperature of 750oC, the maximum specific surface area of 1600 m2/g with pore volumn of 0.7 cm3/g were obtain at impregnation ratio of 5:2.
Lua et.al. [48] studied on the preparation and characterisation of effective adsorbents from pistachio-nut shells. The optimum pyrolysis conditions was obtained at the temperature of 500oC/2 hrs with a heating rate of 10oC/min. Under this pyrolysis condition, ACs with a maximum BET surface area of 778 m2/g were obtained.
Kim et.al. [49] also studied the effects of the pyrolysis ambient including N2/CO2
without cooling, N2/CO2 with cooling and direct CO2 on the specific surface area of ACs. It was reported that surface areas of biochars obtained by intermediate pyrolysis at 500 and 800oC were 107 and 249 m2/g, respectively. The maximum surface area of microporous ACs
34
(≤ 1 nm) of 1126 m2/g was obtained by carried out the process in N2/CO2 gas ambient without cooling method at a final activation temperature of 900oC/1 hour.
Zhou et.al. [50] studied the effects of Na2CO3 catalyst on coal pyrolysis and gasification of bituminous char. It was found that the activation energy of catalytic coal gasification using Na2CO3 (10 wt.%) is 31.5 kJ.mol-1, which is less than that of non-catalytic coal gasification. Therefore, Na2CO3 can improve the kinetics of coal gasification with CO2.
Kopyscinski et.al. [51] investigated the interactions of K2CO3 with ash-free brown coal in N2 or CO2 atmospheres at 700 °C. The X-ray diffraction (XRD) analysis confirmed that the evaporation of potassium is negligible because the K2CO3 does not exist in N2 and CO2 atmospheres at 700°C. It was found that the CO2 gasification rate can be increased by holding the ash-free coal mixed with K2CO3 in N2 prior to switching to the reaction gas. This means, the catalyst reduction is necessary for a fast char conversion.
Perander et.al. [52] studied the catalytic gasification of Ca and K. It was found that the gasification rate of the char linearly increased with an increasing of the concentration of Ca or K. The catalytic activity of Ca was higher than K at the beginning of char gasification.
However, the catalytic effect of Ca decreased earlier than the catalytic effect of K. This might related to the formation of CaCO3 and K2CO3 layer on the char surface.


![Figure 1-8. CO 2 emission from fossil fuel combustion by section and fuel type in 2006 [27]](https://thumb-ap.123doks.com/thumbv2/123deta/6234750.1091915/25.892.205.690.104.558/figure-emission-fossil-fuel-combustion-section-fuel-type.webp)