Trends in coronary risk factors and electrocardiogram findings from 1977 to 2009 with 10-year mortality in Japanese elderly males
– The Tanushimaru Study –
Sachiko Nakamura (MD)
a, Hisashi Adachi (MD, PhD)
b, Mika Enomoto (MD, PhD)
a, Ako Fukami (MD, PhD)
a, Eita Kumagai (MD, PhD)
a, Yume
Nohara (MD)
a, Shoko Kono (MD)
a, Erika Nakao (MD)
a, Akiko Sakaue (MD)
a, Tomoko Tsuru (MD)
a, Nagisa Morikawa (MD)
a,
Yoshihiro Fukumoto (MD, PhD)
aa. Department of Internal Medicine, Division of Cardio-Vascular Medicine, Kurume University School of Medicine, Kurume, Japan
b. Department of Community Medicine, Kurume University School of Medicine, Kurume, Japan
Total word count=3,718 Abstract=242
5 tables, 1 supplemental table and 2 supplemental figures References=32
Running head: Trends in coronary risk factors and ECG findings Address for correspondence;
Hisashi Adachi, MD., PhD.
Department of Community Medicine, Kurume University School of Medicine, 67 Asahi-machi, Kurume, 830-0011, Japan
TEL: +81-942-31-7586 FAX: +81-942-31-7896
E-mail: [email protected]
ABSTRACT
Background: An understanding of the trends in regard to coronary risk factors and electrocardiogram (ECG) findings has an important role in public health. We investigated the trends in coronary risk factors and main ECG findings in 1977, 1989, 1999, and 2009 in the Japanese cohort of the Seven Countries Study, in Tanushimaru, a typical farming town in Kyushu Island.
Methods and results: A total of 1,397 subjects (231 in 1977, 332 in 1989,
389 in 1999, and 445 in 2009) were enrolled in this study, and all of them
were males aged over 65 years. In coronary risk factors, total cholesterol
levels, diastolic blood pressure, body mass index, and uric acid have
significantly increased during these 3 decades. The prevalence of smokers
has markedly decreased from 56.7% in 1977 to 16.8% in 2009. ECG changes
during 3 decades were wider QRS interval, increased prevalence of major
abnormality, reduced heart rate, shortened PR interval and corrected QT and
decreased prevalence of left ventricular hypertrophy (LVH). Age, smoking
habits, major and minor abnormalities in ECG were associated with
mortality in 1977-1987. Age, total cholesterol levels (inversely) and
corrected QT were associated with mortality in 1989-1999. Age, smoking
habits, heart rate and systolic blood pressure were associated with mortality in 1999-2009.
Conclusions: Predictors of mortality have changed with the times. Coronary risk factors such as smoking, increased heart rate, and elevated blood pressure have been recently associated with mortalities in elderly male Japanese general population.
Keywords: Coronary risk factor; Electrocardiogram; Mortality;
Epidemiology
Introduction
In the Seven Countries Study, which has begun in 1958 [1,2], data of
males aged 40-64 years old of Japanese cohort, were presented from
Tanushimaru, located in Kyushu, the southwestern island of Japan [3]. In this
historic cohort study, Japanese population showed lower cholesterol levels,
more intake of unsaturated fatty acid, and lower incidence of coronary artery
disease [4]. However, during the past 6 decades, Japan has experienced
dramatic changes in lifestyle and eating patterns associated with
socioeconomic development [5], which may result in the increasing
incidence of various cardiovascular diseases, including acute myocardial
infarction [6]. We have previously reported the results of a trend in
nutritional intake and serum cholesterol levels up to 2009 in Tanushimaru
[7], indicating the contribution of the eating pattern changes to the
progressive increase in serum cholesterol levels in Japan, which affects
atherosclerosis progression [8,9]. Although we have shown the data of males
aged 40-64 years old in this district [3,5], those of elderly males aged over
65 years old have never been reported, not only in our cohort but also in other
cohorts. The purpose of the present study was to describe the time trends
over 30 years in coronary risk factors and electrocardiogram (ECG) findings, as well as their impacts of prognosis, in Japanese elderly (≥65 years old) males in the general population.
Methods
Study population
A total of 1,397 subjects were enrolled in this study. Trends in the coronary risk factors and ECG findings have been monitored in a typical farming town, Tanushimaru [10,11]. There were no participants aged over 65 in the first survey in 1958; however, participants aged over 65 have been enrolled since the second survey in 1977. As male participants aged over 65, 231 were enrolled in the second survey in 1977, 332 in the third survey in 1989, 389 in the fourth survey in 1999, 445 in the latest survey in 2009.
Data collection
Each cross-sectional survey was conducted using the common
protocol in the Seven Countries Study described in detail by Keys and
associates [1,2]. The anthropometric and blood data included (1) age; (2)
alcohol consumption and smoking habits; (3) body mass index (BMI) [calculated as weight (kg) divided by the square of height (m
2)]; (4) systolic and diastolic blood pressures; (5) frequency of hypertensive medication; (6) lipid profiles [total cholesterol, low density lipoprotein (LDL)-cholesterol, high density lipoprotein (HDL)-cholesterol and triglycerides]; (7) fasting plasma glucose; and (8) uric acid. ECG findings were evaluated using 12 leads ECG included (9) heart rate; (10) frequency of basic rhythm; (11) PR interval; (12) QRS interval; (13) corrected QT; (14) voltage of left ventricular hypertrophy (LVH); (15) frequency of major and minor abnormalities. Minnesota coding of major and minor ECG abnormalities were abstracted from Badheka AO, et al. [12] (Supplemental Table 1).
Total cholesterol was measured by the enzymatic method of Allain, et al. [13]. Other chemistries, such as LDL-cholesterol, HDL-cholesterol and triglycerides (enzymatic assay method), fasting plasma glucose and uric acid, were measured in a commercially available laboratory (Kyodo Igaku Laboratory, Fukuoka, Japan).
We have periodically followed up the participants in each cross-
sectional survey for 10 years. The follow-up data that were collected prior to
the end of December 2015 were used in this study. Eventually, we could have shown data for 10-year follow-up of 1977 (1977-1987), 1989 (1989-1999) and 1999 (1999-2009). Because the latest examination was carried out in 2009, we have not clarified the mortality between 2009 and 2019.
The causes of death were determined based on a review of obituaries, medical records, death certificates, hospital charts, and interviews with primary care physicians, the families of the deceased and other witnesses.
The information was coded independently in accordance with the rules of the Seven Countries Study [1-3], and using the World Health Organization’s 10th Revision of the International Statistical Classification of Diseases and Related Health Problems (WHO-ICD) [14].
The present study was approved by the Ukiha and Tanushimaru Branches of the Japan Medical Association, the local citizens’ committee of Tanushimaru, and by the Research Ethics Committee of the Kurume University School of Medicine (Process numbers 9908/1999 and 9019/
2009). The study conformed to the principles of the declaration of Helsinki.
All of the participants provided written informed consent.
Statistical analyses
Results are presented as mean values or percentages in 1977, 1989, 1999, and 2009 (Table 1). Because age has been significantly increased, age- adjusted mean values in 1977, 1989, 1999 and 2009 (Tables 2 and 3) were evaluated by analysis of co-variance (ANCOVA) adjusted for age and Mantel-Haenszel χ square test was used in the analyses of categorical parameters. Findings of coronary risk factors and ECG on mortality in 10- year follow-up from the baseline at 1977, 1989 and 1999 were evaluated by the multiple logistic regression analysis adjusted for age (Table 4).
Eventually, multiple stepwise logistic regression analysis was performed (Table 5). Odds ratio (OR) and 95% confidence interval (CI) were demonstrated in Table 5. All of the statistical analyses were performed using the SAS software program (version 9.3, SAS Institute, Cary, NC, USA).
Results
Time trends in anthropometric and blood data of study participants
were shown in Table 1. In coronary risk factors, total cholesterol levels
(p<0.001), diastolic blood pressure (p<0.001), BMI (p<0.001), and uric acid
(p<0.001) have significantly increased. T he smoking rate has markedly decreased from 56.7% in 1977 to 16.8% in 2009. The number of subjects treated by hypertensive medication, as well as alcohol consumption, has increased during 30 years, as shown in Table 1. After age-adjustment, these continuous parameters remained significant. BMI had significant correlations with systolic and diastolic blood pressures, total, LDL-, and HLD-cholesterol levels, triglycerides, and uric acid (Supplemental Figure 1).
Time trends in ECG findings of study participants were shown in Table 2. QRS interval has become wider (p<0.001) and the prevalence of major abnormality has increased (p<0.001), whereas heart rate (p<0.001) has reduced, PR interval (p<0.001) and corrected QT (p<0.001) have become shorter, and the prevalence of LVH (p<0.001) have decreased. After age- adjustment, these ECG continuous parameters of study participants remained significant (Table 2). The incidence of atrial fibrillation has gradually, but not significantly, increased during 30 years.
Table 3 indicated the time trend of coronary risk factors of death
participants in 10-year follow-up from the baseline at 1977, 1989 and 1999.
There were 112 deaths in 1977-1987, 130 in 1989-1999 and 124 in 1999- 2009. Elevated BMI (p=0.001), total cholesterol (p=0.005), uric acid (p=0.001) and diastolic blood pressure (p=0.014) showed a significant linear trend, whereas smoking habits (p<0.001) showed an inverse linear trend.
Table 3 demonstrated the time trend of ECG findings of participants who had died in 10-year follow-up from the baseline at 1977, 1989 and 1999.
Heart rate (p=0.008), corrected QT (p=0.006) and LVH (p=0.010) showed a
significant inverse linear trend. Major (p=0.011) and minor (p=0.032) ECG
abnormalities were also showed a significant inverse linear trend. Table 4
indicated the findings of coronary risk factors and ECG on mortality in 10-
year follow-up from the baseline at 1977, 1989 and 1999. Diastolic blood
pressure (p=0.042), smoking habits (p=0.024), heart rate (p=0.033), QRS
interval (p=0.036), major (p=0.010) and minor (p=0.026) abnormalities were
significantly associated with the mortality between 1977 and 1987. Total
cholesterol (p=0.020; inversely), heart rate (p=0.017) and corrected QT
(p<0.001) were significantly associated with mortality between 1989 and
1999. Total cholesterol (p=0.044; inversely), systolic blood pressure
(p=0.009), smoking habits (p<0.001), heart rate (p<0.001) and corrected QT
(p=0.041) were significantly associated with mortality between 1999 and 2009.
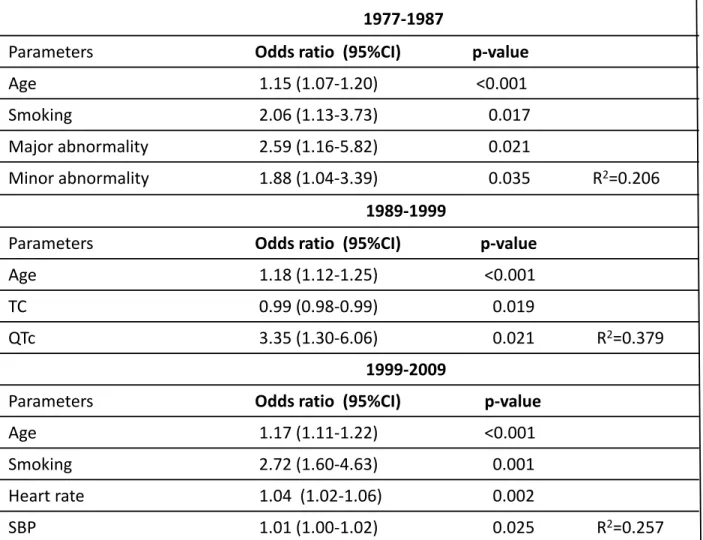
In multiple stepwise logistic regression analyses (Table 5), age (OR:
1.15; 95% CI: 1.07-1.20, p<0.001), smoking habits (OR: 2.06; 95% CI: 1.13- 3.73, p=0.017), major (OR: 2.59; 95% CI: 1.16-5.82, p=0.021) and minor (OR: 1.88; 95% CI: 1.04-3.39, p=0.035) abnormalities were significantly and independently associated with mortality in 1977-1987. Age (OR: 1.18;
95% CI: 1.12-1.25, p<0.001), total cholesterol (OR: 0.99; 95% CI: 0.98-0.99, p=0.019; inversely) and corrected QT (OR: 3.35; 95% CI: 1.30-6.06, p=0.021) in 1989-1999, as well as age (OR: 1.17; 95% CI: 1.11-1.22, p<0.001), smoking habits (OR: 2.72; 95% CI: 1.60-4.63, p=0.001), heart rate (OR: 1.04; 95% CI: 1.02-1.06, p=0.002) and systolic blood pressure (OR:
1.01; 95% CI: 1.00-1.02, p=0.025) in 1999-2009 were also significantly and independently associated with respective mortality.
Especially in 1999-2009, the strongest findings of coronary risk
factors and ECG on mortality were smoking habits and heart rate,
respectively. We, therefore, investigated the odds ratios stratified by 3 heart
rate groups (<60 bpm, 60-79 bpm and ≥80 bpm) and by 2 smoking status.
The significant and the highest odds ratio was 6.78 in smokers with heart rate ≥ 80 bpm in 1999-2009 (Supplemental Figure 2). Moreover, even in the moderate heart rate (60 ≤ HR < 80 bpm), the odds ratio was significantly higher than the lowest heart rate (HR < 60 bpm) in 1999-2009 (OR=2.56).
Discussion
In the present study, we have investigated the very long-term trends in coronary risk factors and ECG findings, and clarified their prognostic impacts on 10-year mortality during these 3 decades in elderly Japanese men.
As previously reported [2-5], the demographic backgrounds of the subjects in this area are typical and general in farming communities in Japan.
Although a relationship between coronary risk factors and dietary changes was reported in the Cretan population in the Seven Countries Study [15], there have been no epidemiologic studies that have been conducted in large cities, because long-term follow-up is difficult in mobile urban populations.
Compared to the large cities, it is much easier to obtain the follow-up data in
Tanushimaru, due to the small population movement.
Time trends in anthropometric and blood data of subjects
A gradual increase in BMI may be caused in part by the dramatic changes in working conditions of farming Japan, from traditional heavy physical labor to the current use of automated agricultural machinery.
Physical inactivity partially due to the wide use of automobiles can be the additional cardiovascular risk factor [2,3,16,17]. As shown in Table 1 and Supplemental Figure 1, the levels of total cholesterol, uric acid and diastolic blood pressure have been significantly increased, accompanied by the increase of BMI, which has been consistently observed in another study, performed in a farming community in Akita, the northeastern part of Japan [18]. These changes may increase the prevalence of old myocardial infarction and stroke.
The urban areas in Japan, but not Tanushimaru area, have been
westernized in their lifestyles. In fact, the latest serum cholesterol level was
around 192mg/dl in men in Tanushimaru [7], which was lower than that in
urban areas in Japan [19], in both men (198.6mg/dl) and women
(207.1mg/dl) [20], as well as those in Europe and the United States [2].
Time trends in ECG findings of subjects
In ECG findings, QRS interval has become wider and the prevalence of major abnormality has increased, whereas heart rate has reduced, PR interval and corrected QT have become shorter, and the prevalence of LVH has decreased. Although blood pressure and the number of hypertensive medication increased, the prevalence of LVH has decreased, probably because hypertensive medications may have favorable effects on LVH.
In major abnormalities, the prevalence of atrial fibrillation has been gradually, but not significantly, increased in the Tanushimaru community;
however, in the Framingham Heart Study, the age-adjusted incidence of atrial fibrillation from all sources increased progressively over time probably partly due to enhanced surveillance [21].
Resting heart rate declines with age in the present study, as is consistent with cross-sectional [22,23] and longitudinal [24] data. The findings of these studies suggest that the decreased adrenergic response with aging is an important mechanism related to lower resting pulse rate and its protective effect [22-24].
LVH is known to be increased with age [25]. Only a few studies have
examined the implications of LVH in elderly patients [26,27]. Although our findings in the present study have shown that LVH significantly decreased with age, this may be explained by the physique [28] and by the wide use of antihypertensive therapy [29], which may decrease the voltage of LVH. We confirmed this inverse relationship between age and LVH in 1989 (r= -0.145, p=0.008). However, there are no significant correlation between age and LVH in 1977, 1989 and 1999.
Time trend of coronary risk factors and ECG findings of death participants and mortality in 10-year follow up
We have investigated the association between ECG findings and
mortality in 10-year follow up of 3 periods (Table 3). In coronary risk factors,
the significant gradual increases of BMI, total cholesterol, uric acid and
diastolic blood pressures, as well as the significant gradual decrease of
smoking habits, were evident (Table 3). In ECG findings, the significant
gradual decreases of heart rate, corrected QT and LVH were significantly
associated with mortality (Table 3). Interestingly, both major and minor
abnormalities in ECG were significantly associated with mortality in 1977-
1987, but not atrial fibrillation, probably due to the limited number of atrial fibrillation incidence (Table 4). Coronary risk factors have been recently associated with mortalities in elderly Japanese suggesting that recent medical therapies may exceed ECG abnormalities in the aspects of 10-year mortality.
The strongest findings of coronary risk factors and ECG on mortality
were smoking habits and heart rate, respectively in 1999-2009 (Table 5 and
Supplemental Figure 2). We divided resting heart rate into 3 groups, and
calculated odds ratios stratified smoking status (non-smokers vs. smokers),
which findings were also consistent. In our previous study [30], the
predictors of the 18-year mortality of middle-aged men in a Japanese cohort
were high blood pressure, tachycardia, hyperuricemia, low cholesterol, and
taking antihypertensive medication, all of which were significant in all-cause
mortality. Among them, we found that tachycardia was an independent
strong association with mortality [30]. We have also reported that the heart
rate greater than 80 bpm showed more than double in odds ratio in the
developments of obesity, insulin resistance and diabetes mellitus [31]. With
the use of objective methods, a cutoff level between normal and abnormal
heart rate values has been proposed to be 80-85 bpm for men, far below the
conventional definition of tachycardia [32].
Study Limitations
The present study has several limitations. First, the sample size is relatively small. Second, the response rate is much lower in the later surveys.
An analysis of those who refused the later studies may indicate a systematic bias. Third, we were able to obtain only the base-line blood test and ECG examination during 10-year follow-up in each examination. Forth, we have no detailed information in medication. Fifth, we have no data regarding the reasons why HDL-cholesterol levels increased.
Nevertheless, coronary risk factors and ECG findings, as well as their prognostic findings have changed with the times in Japanese elderly men.
The time trends over 30 years were striking and further investigation should be required.
Conclusions
Although some ECG abnormalities were associated with mortalities
in 1977-1999, coronary risk factors such as smoking, increased heart rate,
and elevated blood pressure, but not ECG abnormalities, have been recently associated with mortalities in elderly Japanese general population.
Funding
This study was supported in part by the Kimura Memorial Heart Foundation, Fukuoka, Japan.
Disclosures
There are no conflicts of interest for this paper with respect to any of the authors.
Acknowledgments
We are grateful to members of the Japan Medical Association of
Ukiha, the elected officials and residents of Tanushimaru, and the team of
physicians for their help in carrying out the health examinations.
References
[1] Keys A, Aravanis C, Blackburn H, Buzina R, Djordjevic BS, Dontas AS, Fidanza F, Karvonen MJ, Kimura N, Menotti A, Mohachek I, Nedeljkovic S, Puddu V, Punsar S, Taylor HL, Van Buchem FSP. Seven Countries Study. A multivaliate analysis of death and coronary artery disease. Harvard University Press, Cambridge, Mass. 1980.
[2] Koga Y, Hashimoto R, Adachi H, Tsuruta M, Tashiro H, Toshima H.
Recent trends in cardiovascular disease and risk factors in the seven countries study, In: Toshima H, Koga Y, Blackburn H, Keys A. (Eds), Lessons for Science from the Seven Countries study. A 35-year collaborative experience in cardiovascular disease epidemiology, Springer-Verlag, Tokyo, 1994, pp. 63-74.
[3] Toshima H, Tashiro H, Sumie M, Koga Y, Kimura N. Nutritional prevention of cardiovascular disease. In: Lovenberg W, Yamori Y. (eds) Changes in risk factors and cardiovascular mortality and morbidity within Tanushimaru 1958-1982.” Academic Press, New York, 1984, pp.
203-210.
[4] Kromhout D, Menotti A, Bloemberg B, Aravanis C, Blackburn H, Buzina
trans fatty acids and cholesterol and 25-year mortality from coronary heart disease: The Seven Countries Study. Prev Med 1995; 24:308-15.
[5] Adachi H, Hino A. Trends in nutritional intake and serum cholesterol levels over 40 years in Tanushimaru, Japanese men. J Epidemiol 2005;
15:85-9.
[6] Takii T, Yasuda S, Takahashi J, Ito K, Shiba N, Shirato K, Shimokawa H.; MIYAGI-AMI Study Investigators. Trends in acute myocardial infarction incidence and mortality over 30 years in Japan: report from the MIYAGI-AMI Registry Study. Circ J 2010; 74:93-100.
[7] Adachi H, Hirai Y, Sasaki S, Enomoto M, Fukami A, Kumagai E, Esaki E, Imaizumi T. Trends in dietary intakes and serum cholesterol levels over 50 years in Tanushimaru in Japanese men. Food Nutri Sciences 2011; 2:476-81.
[8] Libby P, Ridker PM, Hansson GK. Progress and challenges in translating the biology of atherosclerosis. Nature 2011;473 (7347): 317-25.
[9] Fukumoto Y, Libby P, Rabkin E, Hill CC, Enomoto M, Hirouchi Y,
Shiomi M, Aikawa M. Statins alter smooth muscle cell accumulation and
collagen content in established atheroma of watanabe heritable
hyperlipidemic rabbits. Circulation 2001; 103:993-9.
[10] Hirai Y, Geleijne JMG, Adachi H, Imaizumi T, Kromhout D. Systolic blood pressure predicts cardiovascular mortality in a farming but not in a fishing community. – A 40-year follow up the Japanese cohorts of the Seven Countries Study – Circ J 2011; 75:1890-6.
[11] Yokoi K, Adachi H, Hirai Y, Enomoto M, Fukami A, Ogata K, Tsukagawa E, Kasahara A, Imaizumi T. Plasma endothelin-1 level is a predictor of 10-year mortality in a general population. – The Tanushimaru Study – Circ J 2012; 78:2779-84.
[12] Badheka AO, Patel N, Tuliani TA, Rathod A, Marzouka GR, Zalawadiya S, Deshmukh A, Moscucci M, Cohen MG.
Electrocardiographic abnormalities and reclassification of cardiovascular risk: Insights from NHANES-III. Am J Med 2013;126:
319-26.
[13] Allain CC, Poon LS, Chan CSG, Richmond W, Fu PC. Enzymatic determination of total serum cholesterol. Clin Chem 1974; 20:470-5.
[14] International Statistical Classification of Diseases and Related Health
Problems. 10th Revision, Geneva 2003; World Health Organization.
[15] Kafatos A, Diacatou A, Voukiklaris G, Nikolakakis N, Vlachonikolis J, Kounali D, Mamalakis G, Dontas AS. Heart disease risk-factor status and dietary changes in the Cretan population over the past 30y: The Seven Countries Study. Am J Clin Nutr 1997; 65:1882-6.
[16] Miura Y, Fukumoto Y, Miura T, Shimada K, Asakura M, Kadokami T, Ando S, Miyata S, Sakata Y, Daida H, Matsuzaki M, Yasuda S, Kitakaze M, Shimokawa H. Impact of physical activity on cardiovascular events in patients with chronic heart failure. A multicenter prospective cohort study. Circ J 2013; 77:2963-72.
[17] Shikada T, Washio M, Nishizaki A, Kakino T, Ooe K, Ishibashi Y, Sagara S, Morishige K, Tashiro H. Risk factors for coronary artery calcification in Japanese patients. J Cardiol 2015; 66:36-40.
[18] Shimamoto T, Komachi Y, Inada H, Doi M, Iso H, Sato S, Kitamura A, Iida M, Konishi M, Nakanishi N. Trend for coronary heart disease and stroke and their risk factors in Japan. Circulation 1989; 79: 503-15.
[19] Okayama A, Ueshima H, Marmot MG, Elliott P, Yamakawa M, Kita Y.
Different trends in serum cholesterol levels among rural and urban
populations aged 40-59 in Japan from 1960 to 1990. J Clin Epidemiol
1995; 48:329-37.
[20] Ministry of Health and Welfare. National Survey on Circulatory Disorders, 1990. Osaka: Japan Cardiovascular Research Foundation, 1993.
[21] Schnabel RB, Yin X, Gona P, Larson MG, Beiser AS, McManus DD, Newton-Cheh C, Lubitz SA, Magnani JW, Ellinor PT, Seshadri S, Wolf PA, Vasan RS, Benjamin EJ, Levy D. 50 year trends in atrial fibrillation prevalence, incidence, risk factors, and mortality in the Framingham Heart Study: a cohort study. Lancet 2015; 386 (9989):154-62.
[22] Stessman J, Jacobs JM, Stessman-Lande I, Gilon D, Leibowitz D. Aging, resting pulse rate, and longevity. J Am Geriatr Soc 2013; 61: 40-5.
[23] Santos MA, Sousa AC, Reis FP, Santos TR, Lima SO, Barreto-Filho JA.
Does the aging process significantly modify the mean heart rate? Arq Bras Cardiol 2013; 101:388-98.
[24] Yashin AI, Akushevich IV, Arbeev KG, Akushevich L, Ukraintseva SV,
Kulminski A. Insights on aging and exceptional longevity from
longitudinal data: novel findings from the Framingham Heart Study. Age
2006; 28:363-74.
[25] Levy D, Anderson KM, Savage DD, Kannel WB, Christiansen JC, Castelli WP. Echocardiographically detected left ventricular hypertrophy: prevalence and risk factors. The Framingham Heart Study.
Ann Intern Med 1988; 108:7-13.
[26] Jissho S, Shimada K, Taguchi H, Yoshida K, Fukuda S, Tanaka H, Yoshikawa J, Yoshiyama M, Ishii M, Goto Y. Impact of electrocardiographic left ventricular hypertrophy on the occurrence of cardiovascular events in elderly hypertensive patients. - The Japanese trial to assess optimal systolic blood pressure in elderly hypertensive patients (JATOS) -. Circ J 2010; 74:938-45.
[27] Sundström J, Lind L, Arnlöv J, Zethelius B, Andrén B, Lithell HO.
Echocardiographic and electrocardiographic diagnoses of left ventricular hypertrophy predict mortality independently of each other in a population of elderly men. Circulation 2001; 103:2346-51.
[28] da Costa W, Riera AR, Costa Fde A, Bombig MT, de Paola AA,
Carvalho AC, Fonseca FH, Luna Filho B, Póvoa R. Correlation of
electrocardiographic left ventricular hypertrophy criteria with left
ventricular mass by echocardiogram in obese hypertensive patients. J
Electrocardiol 2008; 41:724-9.
[29] de Simone G, Okin PM, Gerdts E, Olsen MH, Wachtell K, Hille DA, Dahlöf B, Kjeldsen SE, Devereux RB. Clustered metabolic abnormalities blunt regression of hypertensive left ventricular hypertrophy: the LIFE study. Nutr Metab Cardiovasc Dis 2009; 19: 634-40.
[30] Fujiura Y, Adachi H, Tsuruta M, Jacobs DR Jr, Hirai Y, Imaizumi T.
Heart rate and mortality in a Japanese general population: an 18-year follow-up study. J Clin Epidemiol 2001; 54:495-500.
[31] Shigetoh Y, Adachi H, Yamagishi S, Enomoto M, Fukami A, Otsuka M, Kumagae S, Furuki K, Nanjo Y, Imaizumi T. Higher heart rate may predispose to obesity and diabetes mellitus: 20-year prospective study in a general population. Am J Hypertens 2009; 22:151-5.
[32] Palatini P. Need for a revision of the normal limits of resting heart rate.
Hypertension 1999; 33:622-5.
Supplemental figure legends
Supplemental Figure 1. Correlation between body mass index and coronary
risk factors.
blood pressures (B), total (C), and LDL-cholesterol levels (D), triglycerides (E), and uric acid (F), whereas, BMI had significant inverse correlations with HDL-cholesterol levels (G).
BMI, body mass index; HDL, high density lipoprotein; LDL, low density lipoprotein.
Supplemental Figure 2. Prognostic findings of heart rate and smoking in 1999-2009.
This hierarchical model was created using multiple logistic regression analysis adjusted for age and obtaining odds ratio from the lowest heart rate group as reference.
HR, heart rate.
Major ECG abnormalities
Major Q, QS waves ST-depression Negative T-waves Complete AV block
Wolff Parkinson White pattern Artificial pacemaker
Ventricular conduction defect Atrial fibrillation or atrial flutter ST-elevation
Minor ECG abnormalities
Minor Q-waves High R-waves Minor ST-codes Minor T-wave codes Prolonged PR-interval RR' in V1 or V2
Left anterior fascicular block Possible myocardial infarction
Moderate Q/QS waves without ST-depression or T-wave inversion Minor Q/QS waves with ST-depression or T-wave inversion Probable myocardial infarction
Major Q/QS waves
Moderate Q/QS waves with ST-depression or T-wave inversion Infarction/injury score≥10
Left ventricular hypertrophy
Possible left ventricular hypertrophy Probable left ventricular hypertrophy Axis
Left axis deviation Right axis deviation
Supplemental Table 1. ECG abnormalities from Minnesota coding
Suppl. Figure 1
r=0.188 p<0.001
50 100 150 200 250 300 350
Systolic Blood Pressure
BMI (kg/m2) r=0.149
p<0.001
0 50 100 150 200 250
10 20 30 40
Diastolic Blood Pressure
BMI (kg/m2) r=0.221
p<0.001
0 20 40 60 80 100 120 140
10 20 30 40
Total Cholesterol
r=0.155 p<0.001
50 100 150 200 250
300 LDL-Cholesterol
A B
C D
mmHg mmHg
mg/dl mg/dl
r=-0.175 p<0.001
20 40 60 80 100 120
r=0.276 p<0.001
0 100 200 300 400 500 600 700 800 900
10 20 30 40
Suppl. Figure 1
r=0.203 p<0.001
0 2 4 6 8 10 12 14
10 20 30 40
Triglycerides
BMI (kg/m2)
HDL‐Cholesterol
Uric Acid
BMI (kg/m2)
E F
G
mg/dl mg/dl
mg/dl
0 2 4 6 8 10 12
1
2
3
Smoker Non-smoker
Odds ratios
1999-2009
Suppl. Figure 2
Unadjusted Age‐adjusted
1977 1989 1999 2009 p for trend 1977 1989 1999 2009 p for trend
n 231 332 389 445 231 332 389 445
age, years 72.5 (5.3) 73.3 (6.5) 72.7 (5.9) 74.0 (6.1) 0.005
BMI, kg/m2 20.8 (2.9) 22.0 (3.0) 22.6 (3.0) 23.5 (2.9) <0.001 20.8 (2.9) 22.0 (3.0) 22.6 (2.9) 23.6 (2.8) <0.001
TC, mg/dl 157.2 (27.6) 185.7 (35.2) 183.1 (30.2) 192.1 (31.3) <0.001 155.8 (43.2) 185.7 (38.9) 183.1 (30.6) 192.5 (31.4) <0.001
HDL‐C, mg/dl ‐ 44.7 (9.4) 52.9 (14.1) 55.6 (13.5) <0.001 ‐ 44.7 (10.3) 52.9 (14.2) 55.6 (13.6) <0.001
LDL‐C, mg/dl ‐ 116.4 (32.6) 112.1 (28.5) 114.4 (27.6) 0.192 ‐ 116.3 (36.2) 112.0 (30.0) 114.6 (27.8) 0.176
TG, mg/dl 105.5 (62.9) 105.8 (85.5) 95.5 (56.4) 107.5 (71.8) 0.006 100.9 (99.6) 105.8 (94.1) 95.1 (59.2) 108.8 (71.1) <0.001
UA, mg/dl 5.2 (1.4) 5.9 (1.5) 5.8 (1.4) 5.9 (1.5) <0.001 5.2 (2.2) 5.9 (1.7) 5.8 (1.5) 5.9 (1.5) 0.001
FPG, mg/dl ‐ 102.4 (36.8) 98.6 (26.3) 101.2 (25.2) 0.072 ‐ 102.4 (40.6) 98.6 (27.7) 101.2 (25.4) 0.150
SBP, mmHg 138.9 (23.7) 136.7 (22.7) 140.7 (21.9) 138.1 (19.1) 0.096 139.0 (23.8) 136.7 (22.7) 140.7 (21.9) 137.9 (19.1) 0.075
DBP, mmHg 76.2 (11.2) 75.9 (11.9) 80.6 (12.3) 81.7 (11.0) <0.001 75.9 (11.2) 75.9 (11.8) 80.5 (12.1) 82.0 (10.5) <0.001
HT medication, % 21.2 26.5 28.3 48.2 <0.001
Smoking, % 56.7 40.9 32.1 16.8 <0.001
Alcohol, % 53.0 60.1 42.5 71.1 <0.001
OMI, % 0.00 1.51 2.06 3.93 <0.001
Stroke, % 0.43 4.22 1.29 8.08 <0.001
Table 1. Trends of backgrounds of participants
Data are means (SD) or age‐adjusted means (SD) and percent.
Abbreviations: BMI; Body mass index, TC; Total cholesterol, HDL‐C; High density lipoprotein cholesterol, LDL‐C; Low density lipoprotein
Unadjusted Age‐adjusted
1977 1989 1999 2009 p for trend 1977 1989 1999 2009 p for trend
n 231 332 389 445 231 332 389 445
Heat rate, /min 68.6 (13.1) 64.2 (12.1) 61.4 (10.6) 63.0 (10.4) <0.001 68.7 (13.2) 64.3 (12.1) 61.4 (10.6) 63.0 (10.4) <0.001
Rhythm, AF %* 4.4 3.0 4.6 5.4 0.467
PR, msec 0.190 (0.028) 0.176 (0.035) 0.171 (0.028) 0.168 (0.032) <0.001 0.191 (0.030) 0.176 (0.036) 0.172 (0.020) 0.169 (0.042) <0.001 QRS, msec 0.094 (0.021) 0.091 (0.016) 0.107 (0.016) 0.105 (0.019) <0.001 0.094 (0.015) 0.092 (0.018) 0.107 (0.019) 0.106 (0.021) <0.001 QTc, msec 0.432 (0.033) 0.421 (0.031) 0.412 (0.031) 0.414 (0.031) <0.001 0.433 (0.030) 0.422 (0.036) 0.412 (0.039) 0.414 (0.021) <0.001
SV1+RV5, mm 30.5 (11.0) 28.0 (9.5) 27.9 (9.1) 26.2 (9.6) <0.001 30.5 (11.1) 28.0 (9.4) 27.8 (9.1) 26.3 (9.6) <0.001
Major abnormalities, %* 17.2 18.4 12.6 29.7 <0.001
Major Q, QS waves 3.1 3.9 2.8 6.3 0.055
ST‐depression 3.5 4.5 1.0 7.6 0.029
Negative T‐waves 3.9 3.0 1.5 6.7 0.047
Artificial pacemaker 0.0 0.3 0.5 0.2 0.648
Ventricular conduction defect 4.8 4.5 5.4 10.1 0.002
ST‐elevation 1.3 3.0 0.0 2.0 0.746
Minor abnormalities, %* 46.3 44.9 34.9 46.7 0.816
Minor Q‐waves 1.3 6.9 7.5 13.0 <0.001
High R‐waves 34.8 24.1 16.5 20.5 <0.001
Minor ST‐codes 1.8 0.6 0.3 4.7 0.002
Minor T‐wave codes 3.1 7.5 7.2 9.4 0.007
Prolonged PR‐interval 12.3 9.0 4.4 8.5 0.063
RR' in V1 or V2 1.3 5.7 6.9 6.1 0.023
Table 2. ECG findings of participants
Table 3. Time trend of coronary risk factors and ECG findings of participants who had died in 10‐year follow up from the baseline at 1977, 1989 and 1999
1977‐1987 1989‐1999 1999‐2009 p for trend*,**
n 231 332 389
Number of deaths (%) 112 (48.5) 130 (39.2) 124 (31.9)
BMI, kg/m2 20.6 (4.4) 21.9 (4.7) 22.0 (5.5) 0.001
Total cholesterol, mg/dl 158.9 (68.5) 178.8 (56.5) 178.7 (51.5) 0.005
HDL‐C, mg/dl ‐ 52.9 (17.7) 55.6 (28.2) ‐
LDL‐C, mg/dl ‐ 116.3 (51.3) 111.9 (49.2) ‐
TG, mg/dl 109.8 (61.6) 125.2 (90.1) 105.7 (61.4) 0.357
UA, mg/dl 5.2 (3.6) 5.9 (3.2) 5.9 (2.6) 0.001
FPG, mg/dl ‐ 106.5 (49.5) 100.7 (77.6) ‐
SBP, mmHg 140.7 (35.2) 138.9 (36.5) 145.6 (42.9) 0.069
DBP, mmHg 76.7 (16.7) 77.0 (19.8) 80.8 (21.8) 0.014
Smoking, (%) 62.5 39.3 38.7 <0.001
Heart rate/min 70.9 (20.6) 66.5 (19.6) 64.4 (20.1) 0.008
PR, msec 0.192 (0.045) 0.173 (0.054) 0.169 (0.059) 0.878
QRS, msec 0.097 (0.030) 0.091 (0.018) 0.109 (0.039) 0.606
QTc, msec 0..435 (0.046) 0.431 (0.036) 0.418 (0.059) 0.006
SV1+RV5, mm 31.2 (18.1) 27.8 (14.8) 27.6 (17.5) 0.010
Major abnormalities* 29 (25.9) 32 (24.6) 20 (16.1) 0.011
Minor abnormalities* 57 (50.9) 62 (47.7) 47 (37.9) 0.032
Rhythm (af)* 7 ( 6.3) 3 ( 2.3) 6 ( 4.8) 0.607
Table 4. Impact of coronary risk factors and ECG findings on mortality in 10‐year follow up from the baseline at 1977, 1989 and 1999