Corporate Social Responsibility:
Ranking Public Listed Companies in Malaysia
Irma Yazreen Md. Yusoff
*, Lau Sim Yee
+&Abstract This study formulates a CSR index―which is a multi-dimensional metric―for assessing the performance of corporate social responsibility (CSR) of the Top100 PLCs in market capitalization in the Bursa Malaysia. Data on financial performances of these companies in 2012 were sourced from Thompson DataStream whilst other CSR related components were taken from each company’s annual report and sustainability report that are available in public domain. CSR index of each Top 100 PLCs was computed by unweighted and weighted methods. This result shows that Public Bank is strongly balanced in profit generation and CSR contribution. The findings also show the rankings of some PLCs have improved when CSR activities with the assigned weightage are incorporated as moderators for evaluating CSR performances. The opposite results were also evident from the analysis. More importantly, the results suggest that with an appropriate system of metrics in quantifying CSR performances, a corporation could certainly achieve a better standing in the society not merely due to a better financial performance but because of its strive to becoming a more responsible corporate citizen in enhancing social wellbeing beyond the acts of paying taxes, employment generation and maximization of shareholders wealth. Hence CSR activities should not be viewed as a means for improving public and investment relations but they ought to be included as an integral part of the corporate’s role in the society.
Keywords: Corporate Social Responsibility, Profit Maximization, Stakeholders, Externality, Ranking, Bursa Malaysia.
Interdisciplinary fields: Economics, Business, Organization Management, Area Studies.
JEL Codes: M140
1. Introduction
The objective of a firm or a corporation is to maximize its profit, in which the difference between total revenue and total cost is at the highest. This profit
* Corresponding author, Chikuro Hiroike School of Graduate Studies, Reitaku University, email:
+ Faculty of Economics and Business Administration, Reitaku University, email: lau.simyee@gmail.
com
& The authors express their gratitude to two anonymous referees who have provided valuable comments and suggestions for the final draft of this manuscript.
maximization is the same as the minimization of production costs with similar output level. In the observed reality of a marketplace, it is evident that many firms are struggling to minimize their production costs to achieve the highest profit. As a consequence of the low cost operation strategies, many firms have generated a variety of negative externalities suchas environmental degradation, child labor, underpaid workers, and low quality products that violate health and safety standards and other problems. These problems have raised many issues of concern withrespect to firmsʼ responsibility in profit maximization. Conventionally, a firmʼs responsibility lies on the economic dimension that encompasses profit making, paying taxes and provision of employments. More critically, Friedman ( 1970 ) asserts that “there is one and only one social responsibility of business―to use its resources and engage in activities designed to increase its profits so long as it stays within the rules of the game, which is to say, engages in open and free competition without deception or fraud.”
However, with the advancement of technology and its spillover effects, increased competition, stronger inter-dependency, a broader spectrum of stakeholders in the marketplace, it is too crucial to ignore the reality that a firm has responsibilities beyond Friedmanʼs concept of corporate social responsibility (CSR).
Put differently, a firm cannot uphold its social responsibility solely based on profit maximization, but instead it should shoulder broader responsibilities such as from paying taxes, employment generation to the wellbeing of its stakeholders, society and environment.
The perception and practice on CSR vary across different places, people, and times (WBCSD, 1999; Campbell, 2007). On one hand, for a big and high profit making company, giving a portion of its profit to business stakeholders does not affect its business negatively. If a portion of a firmʼs profit is contributed to philanthropic activities, that amount is considered as tax deductible profit. Indeed, more companies are using the CSR related activities as a means to gain good corporate images, which in turn affect consumersʼ decision making that is not solely influenced by price. On the other hand, for small and medium-sized firms, the intensity of CSR activities is expected to be lower since this category of companies has to focus more on expanding their business activities. Hence, institutionalizing CSR rules and requirements equally in a country regardless of firmsʼ size is tricky and unfair. Benchmarking based on number of activities and amount spent on CSR are not good enoughto make a clear assessment of firmsʼ CSR contributions. More critically, using a global standard measurement to calculate CSR contribution in a developing nation suchas Malaysia is even unsuitable as it may hamper business activities caused by improper assessments.
Even so, it is still essential for Malaysia to establishits own standards that are
consistent withinternational practices in order to lay a strong foundation to sustain
its economic development for reaching the high-income nation status. To become a
high income nation does not means merely achieving a high income per capita but instead that status must encompass a higher living standard that entails a better income distribution, lesser environmental degradations, better provisions of social capital especially in terms of economic and political stability as well as enhanced social welfares. Towards this end, there are at least three major contributors, viz., the government, private sector and not for profit organizations (NPOs) such as charitable organizations, civil society organizations, community-based organiza- tions and volunteer-based organizations.
The government has an important role in ensuring the effective mobilization of resources for strengthening social economic development. The private sector, which is the collection of profit seeking corporations, plays the major role in driving economic activities. On one hand, NPOs in a broad sense contribute to the betterment of social economic welfare, but on the other hand, in a narrow sense they carry out activities that serve the purposes of their organizations. The former is explained by the complementary and substitution roles of NPOs vis-à-vis the government
1. The latter is interpreted from the fact that because a NPO is an organization that is created by like-minded individuals who aspire to pursue a common interest or concern.
To a certain extent, the three sectors―government, private and NPO―have increasingly overlapped their roles with one another. In this connection, the focus of this study―CSR―has become a catalyst for the corporate world to contribute more in strengthening social economic welfare beyond the conventional roles as paying taxes and providing employment. In the context of Malaysia, as evident as in other countries with similar or higher income, there are more contributions from the corporate sector in supporting non-profit driven activities that enhance the wellbeing of social, economic, politic and environmental spheres. In order to lift CSR to a higher ground, Bursa Malaysia (i. e. the company that operates Malaysian stock exchange) established a requirement for all companies that are listed in its stock exchange to disclose their CSR activities starting in 2007. The disclosure has become a benchmark for the public to make assessment with regard to CSR policy, method of implementation, and the scale of CSR activities.
Notwithstanding the novelty of Bursa Malaysia, CSR annual reports provided by the public listed companies (PLCs) are not the performance metric for measuring CSR performances. A CSR report is a document that describes the scope of the companyʼs CSR in terms of policy, implementation and coverage. As such, CSR report per se is not a yardstick for quantifying its own performances nor it could be used as a quantitative comparison of CSR performances among PLCs. For this
1 NPOs can complement the government in delivering public services when the government faces resource constrains or the government does not have sufficient electorate support to provide the desired services. NPOs can substitute the government in providing public services because their autonomy, flexibility and closeness to target beneficiaries enable efficient and effective deliveries.
reason, it is desirable to establisha CSR performance metric that is used to gauge the intensity or the degree of CSR activities contributed by PLCs in Malaysia. This study contends that the proposed metric is certainly useful at least from two perspectives: a useful guide for assessing CSR activities of PLCs by their stakeholders; a benchmark for enhancing better CSR performances among the PLCs.
Against this background, this paper aims to establish a CSR performance metric or a CSR index that measures a public listed firmʼs performance or contribution in CSR activities in Malaysia. It is anticipated that this proposed metric helps to serve as a barometer for self-monitoring, tracking and benchmarking in terms of the CSR performance with better information thus it in turn contributes to better decision making among various stakeholders. In order to realize this expectation, the CSR index is the composition of measurements used to make quantitative assessment of several dimensions that determine CSR activities in PLCs in Malaysia. This approach is crucial because the purpose of the CSR index is to encourage the public listed firms to be more proactive instead of taking on a burden, hence contributing to the enculturation of CSR in corporate sector in Malaysia.
This paper is organized as follows. The next section provides a concise review on existing studies that are relevant to the formulation of a conceptual framework in establishing a multi-dimensional CSR index. Section 3 describes the methodolo- gy, whereas section 4 discusses the findings. The last section concludes the paper.
2. Literature Review
CSR is not a new concept for the corporate sector. Until the 1950s, it encompassed
the firmʼs contributions such as service, civic mindedness, welfare work, or
trusteeship that strengthened social wellbeing (Husted, 2015). Like other topics in
socioeconomic studies, theories and empirical analyses in explaining CSR have
evolved considerably. In addition, studies pertain to the best practices of CSR are
well documented too. Notwithstanding an abundance of ideas, the reality in the
corporate world shows that, contrasting the profit seeking behavior, many firms are
reluctant to adopt the best practices because of undetermined expectation in terms
of the cost-benefit of CSR activities withrespect to business operations. Therefore,
in order to mitigate this hindrance, it is imperative to establish a system of
quantifiable metrics that entails a set of key elements for the use in measuring the
benefactorʼs level of performances derived from its CSR activities. Equally
important, this index can serve as a useful yardstick for the benefactor to improve
its future CSR activities. In these connections, this section intends to conduct a
review of selected literature that elucidates the prevailing definitions and
supporting theories related to the conceptualization of CSR, and also examines
different types of practices in promoting CSR in the corporate world.
2-1. CSR Models
During the earlier stage of CSR model development, both economists and corporate executives agree that profit maximization is the primary objective of any corporations. This classical view was strongly endorsed by Friedman (1970), who insisted: “ the social responsibility of business is to increase profits. ” Friedmanʼs position was strongly founded on his unshakable belief that corporate business is responsible to its shareholders or investors rather than to a society as a whole. This value is underpinned by the fact that wealth sharing for the society and environment can only be made possible if a company is financially strong and stable.
Even if shareholders who had good purpose wanted to make contributions to the society or environmental protection and other activities pertain to social wellbeing, they certainly could do so by using their earned dividends or gains from shareholdings.
Grounded upon the classical model, the Committee of Economic Development (CED) revised its idea and concept related to CSR into a Concentric Circle model in 1971. In the Concentric Circle model, economic responsibility is positioned as the smallest circle, whereas legal responsibility, ethical responsibility and philanthropic responsibility form the sequence of outer concentric circles (Figure 1: left diagram).
Since its inception in 1942, CED had established national priorities for guiding the promotion of sustained growth and development that have continuously benefitted all Americans. On one hand, CED views that economic responsibility is the core of social responsibility. On the other hand, italso urges business to operate in a humanely fashion towards the society. In other words, the economic responsibility does not only mean profit making per se, but it also implies that profit gained from businesses must also able to bring about constructive results to the society as a whole (i. e. produce goods and services, provide employment, generate economic growth, etc.) (Geva, 2008).
Two decades later, Caroll (1991 ) redefined the Concentric Circle model using
the CSR Pyramid model. This model illustrates the hierarchy of corporate
responsibilities based on the same components as in Concentric Circle model. In this
upgraded model, Caroll (1991 ) transformed the Concentric Circle model into a
pyramid form where economic responsibility is the base of a pyramid that
represents profit. Legal responsibility is the second layer from the base that
represents legal compliance. Ethical responsibility comes in as the third layer,
whereas philanthropic responsibility sits at the tip of pyramid ( Figure 1: right
diagram). Caroll has positioned economic responsibilities as the foundation of the
pyramid model. Moreover, this model defines that businesses can only move up to
fulfill the next tier of the pyramid after upon fulfilling its obligation in the current
tier. Equally crucial, corporate responsibilities towards social and environmental
aspects are manifested in all the three tiers above the economic responsibilities.
Although the terms used in the Concentric Circle model (Figure 1: left diagram) is similar to those of Carollʼs Pyramid model (Figure 1: right diagram), but the latter has incorporated different levels of responsibility for economic, legal, ethical, and philanthropic scope of CSR. Hence the Pyramid model provides a clearer guidance to set priorities for a firm to organize its CSR activities.
Elkington (1994) introduces the “Triple Bottom Line” or commonly called the 3Ps―People, Planet and Profit. This model differs from Concentric Circle model and CSR Pyramid model whereby all the three dimensions are defined as partially overlapping responsibilities instead of a separated hierarchy of responsibilities (Figure 1: bottom right diagram). Elkington argues that corporations should not only focus on profit making but also ought to be conscious of the consequences to the planet as well as to the people at large resulted from their business operations.
As illustrated in Figure 1, as evidenʼt from the three models, economic responsibility is the foundation and the core responsibility of the corporation. If the core responsibility―profit making―is ignored, then a corporation is unable to fulfill other responsibilities due to the incapability of the business to provide monetary and non-monetary resources to execute its CSR intentions. Various past studies on CSR in Malaysia have concentrated mainly on CSR reporting in order to clarify how Malaysian corporations position a spectrum of responsibilities entail in their business operations (Thompson and Zakaria, 2004; Othman and Thani, 2010; Abdul Hamid and Atan, 2011; Abdifatahand Nazli Anum, 2013; Abdifatah, 2013 ). In addition, there are several attempts to identify the inter-twined relationship between financial performance and CSR in the Malaysian corporate sector (Saleh,
Figure 1: CEDʼs Concentric Circle Model, Carollʼs CSR Pyramid Model, and Elkingtonʼs Triple Bottom Line Model
Zulkifli and Muhamad, 2011; Raza, Ilyas and others, 2012). However, these empirical works have left out a crucial aspect with respect to CSR activities, viz., conducting assessment of CSR performances with respect to the relationship between economic responsibility or profitability and CSR performances in the Malaysian corporate sector.
2-2. CSR Reporting Guidelines
Over the decades, various internationally recognized CSR reporting guidelines were developed. Some of these guidelines are continuously being reviewed and updated based on current global business environment needs in order to maintain resilient international guiding principles to support continuously evolving approach in promoting CSR globally. International guidelines for CSR that are widely used include Global Reporting Guideline (GRI), the OECD Guidelines for Multinational Enterprises, th e United Nations Global Compact Ten Principles, th e United Nations Guiding Principles on Business and Human Rights, th e ISO 26000 Guidance Standard on Social Responsibility.
Many of these internationally recognized principles and guidelines emphasize particularly on environmental sustainability suchas environmental conservation, eco-friendly and green technology, climate change, biodiversity, pollution avoidance and raw resources efficiency. Furthermore, they also cover human development dimensions such as community involvement, consumer rights, human rights, labor and employment practices as well as anti-corruptions and bribery issues. Although the concept of CSR may be generalized for global used, critics claim that the extent of those principles and guidelines being recommended are not necessary universally applicable (Lindgreen, Swaen, & Johnston, 2009).
It is worth noting to admit that most of these internationally recognized guidelines and principles are established by the developed countries such as the US, UK and other European countries where there are effective institutions that could bothdirectly and indirectly influence companiesʼ decision making on CSR.
Practicing and enforcing the same level of CSR standards in a developing country can be counterproductive, which as a result may actually hinders economic development in that country. In this respect, World Business Council for Sustainable Development stresses that there is no universal standards of CSR due to its dependency to local factors suchas culture, religion, government, as well as legal framework conditions (WBCSD, 1999 ). Cross-country studies on CSR also confirm significant differences of CSR practices areindeed influenced by factors suchas religion, culture, language as well as the countryʼs development level (Chappel & Moon, 2005; Matten & Moon, 2008).
2-3. CSR in Malaysia
Aware of CSR importance and benefits, Malaysia has followed suit with other
countries in its attempt to promote CSR by imposing a regulation for all public listed companies to report their CSR activities. However, since its implementation in 2007, not many companies have taken CSR seriously but they merely report their CSR to fulfill the requirement instead of proactively strengthening their efforts in CSR.
Empirical evidences from GRI (2012) show that only a few companies in Malaysia have seriously promoted their CSR beyond the regulatory requirement. Various studies in the early 2000s demonstrate that Malaysiaʼs CSR practices are at its infancy stage despite various initiatives and awareness being promoted by the government and NGOs (Abdulrazak & Ahmad, 2014; Amran, Zain and others, 2013;
Ramasamy, Ting, and Yeung, 2007 ). Put differently, even after the mandatory requirement for all PLCs, the CSR practices in Malaysia are still far behind of those in developed countries.
Malaysia is a multi-racial country, and thus its society is diverse in terms of religion, belief, culture and customs. In this connection, CSR practices in Malaysia are influenced by the diversified characteristics embedded in the society and hence CSR activities tend to revolve around festivities such as philanthropic contributions during main religious and cultural festivals. Salleh, Zulkifli and Muhamad (2011 ) underline that Malaysian corporate executives and government leaders view CSR the contribution of good intents to society through charitable contributions and therefore many CSR programs are catered to create direct impact on the community. UNICEF (2012), based on its findings from the survey of CSR reporting in Malaysia, claims that companies overly emphasized on their charitable activities and their knowledge of CSR is superficial and in need of greater direction and monitoring.
Furthermore, the narrow and limited views that define the concept of CSR in Malaysia are influenced by the collectivist culture. Hence the on-going CSR initiatives are preventing companies from approaching CSR at a holistic level, which is necessary for companies to shift their focus on CSR programs that can produce higher visibility by gaining awards and recognition given by government and other supporters whose main interests lie on community development and specific areas of environmental concern. In the short term, however, this type of approach yields higher chances of capturing public eyes and thus CSR is a powerful tool for marketing their corporate images.
3. Methodology
3-1. Conceptual Framework
From the review in the preceding section, this study reasons that a CSR index―for measuring CSR performances―that corresponds to the level of economic development is more reliable to make a better assessment of CSR performances.
This requirement does not mean that CSR in a developing country is promoted in a
less stringent institutional environment but rather it is promoted in the milieu commensurate to the socioeconomic reality of that developing country. A quantifiable metric for CSR is useful for strengthening companiesʼ competitive advantage because the assessment scores with respect to performances of CSR are clear indicators for consumers to make judgments on the pros and cons of their choices in consumption. Furthermore, a CSR index also allows companies to benchmark themselves against other companies and thus it stimulates one another to improve their social responsibility for better gains (Abdifatah & Nazli Anum, 2013).
Hence this study defines five key dimensions that constitute a CSR index in measuring CSR performances. These dimensions are economic prosperity, marketplace, community, workplace and environment. In consistent withCaroll (1991 ) and Edgeworth(1994 ), eachproposed dimension is assigned a weight to reflect the level of responsibility. In other words, the proposed CSR index reflects its multi-dimensional aspects but each of them has different magnitude of responsibil- ity. Each dimension is important but the weightage explains different level of responsibility. More importantly, the assigned weightage to each CSR dimension is expected to stimulate companies to explore other areas of CSR and to strengthen creativity and productivity in mapping their CSR strategies.
3-2. Model Specification
Reflecting the conceptual framework outlined earlier, for measuring CSR performances of the Top PLCs in Malaysia, this study defines a CSR index that incorporates 12 variables for five dimensions, viz., economic prosperity, market- place, community, workplace and environment. Eachvariable is transformed into a scale range between (0, 1). The model specification is shown in Eq. 1, where C
is the CSR index of company i, X
is the company i value of X
variable, and X
and X
is the respective minimum and maximum value of X
variable from the Top 100 PLCs. There are 12 variables (n=12) in the measurement of a companyʼs CSR index, in which 8 variables represent the dimension for economic prosperity (i. e.
market value, market capitalization, earnings per share, dividend per share, return on equity, dividend payout per share, return on investment, and number of employees) while each of the remaining variables represents the dimension for community, marketplace, workplace, and environment, respectively.
C
=
X
−X
X
−X
Eq. 1
This study computes Eq. 1, in which each C
(i =1 to 100 ) is the score of i
companyʼs CSR performance. The scores of the Top 100 PLCs are then ranked in
descending order, which become CSR rankings for the Top 100 PLCs. In computing
C
, this study uses two different methods. The first method is based on the sum of
unweighted nominal value of every variable as shown in Eq. 1. The unweighted nominal value implies every variable from eachdimension is of equal importance.
The second method assigns weightage to each of the five dimensions based on the specification of Eq. 1. The weightage is 0. 3, 0. 2, 0. 3, 0. 1 and 0. 1 for economic prosperity (EP), community (C), marketplace (M), workplace (WP), and environment (E), respectively. The weighted CSR index of company i (C
) is expressed in Eq. 2.
C
=.3EP+.2C+.3M+.1W +.1E Eq. 2
The weightage of 0. 3 is assigned to economic prosperity (EP) dimension and marketplace (M) dimension, respectively because of the following rationales. On one hand, EP has direct impact on CSR activities. A better financial performance tends to raise a higher profitability that strengthens the capability of the firm to channel its resources for CSR activities. Also, the magnitude of CSR activities influences the degree of governmental support in the form of financial incentives such as corporate tax relief, subsidies or grant for CSR activities and non-financial incentives such as awards and recognitions that enhances the credibility of the firmʼs CSR activities. Moreover, the size of employees has significant bearing on the magnitude of CSR activities because the contribution in terms of manpower volunteers or pro bono services in specific expertise and others influences CSR performance. Equally crucial, consistently good financial performance also influences the firmʼs willingness of continuous support for CSR. Similarly to EP, M also influences a firmʼs financial and non-financial capabilities and enthusiasm in undertaking CSR activities actively.
On the other hand, the weightage of 0. 2 is assigned to the community (C) dimension because, as explained in the preceding section, Malaysia is a multi-racial country and thus many firms incline to contribute their CSR in community related events in festive seasons to foster the spirits of coexistence. Also, many firms give monetary or in-kind donations to communities to strengthen education, social and cultural aspects. These community-cares oriented CSR actually strengthen benefactorsʼ public relations withbeneficiaries.
The weightage of 0. 1 is assigned to W and E, respectively, does not mean these two dimensions are not important. They are essentially the integral part of the proposed CSR index but to a certain extent less significant withrespect to EP, M and C.
Withregard to EP, it is further re-organized it into three major components. In
other words, the original 8 variables being defined in EP at the outset of this model
specification is regrouped into market performance (MP), financial performance
(PF), and company size (S). The sum of these three components is the score for EP
dimension, which is expressed in Eq. 3.
EP=MP+FP+S Eq. 3
The weightage for MP is 0. 3, FP is 0. 6, and S is 0. 1. The rationales for the respective weight is based on our emphasis described for Eq. 2. A firmʼs MP evaluated based on its market value (MV) and market capitalization (MC), which is denoted by Eq. 4 where the weightage for MV and MC is 0. 75 and 0. 25, respectively.
MP=0.3.75C
+.25C
Eq. 4
FP comprises five key indicators, viz., earning per share (EPS), dividend per share (DPS), return on equity (ROE), dividend payout per share (DPPS), and return on investment ( ROI ). Eachindicator carries equal weightage of 0. 2, and is expressed in Eq. 5.
FP=0.6.2C
+.2C
+.2C
+.2C
+.2C
Eq. 5
Company size is denoted by S in Eq. 6, which is determined by the number of employees (L).
S=0.1C
Eq. 6
Furthermore, this study also compares how CSR rankings change from market value rankings to unweighted rankings and then to weighted rankings. There areeight possible patterns in the change of rankings, which are tabulated in the Appendix. The rankings of CSR index change when the companyʼs performance is moderated by other financial performance and CSR activities.
3-3. Data Source
To measure the extent of CSR contribution of PLCs in Malaysia, this analysis selects the Top 100 PLCs in market capitalization from the main board of Bursa Malaysia for the year 2012. This study focuses on large firms because large market capitalization is important due to the fact that they have greater public visibility and higher impact towards the society and thus tend to respond better to public pressure (Zainal, Zulkifli and Saleh, 2013).
The analysis is based on two main data sources. First, information pertain to
eachcompanyʼs financial performance of the Top 100 PLCs were sourced from
Thomson Reuters DataStream Professional. Second, CSR data is obtained from each
companyʼs annual report, website, and CSR report or sustainability report. From
the second source, content analytical method is used to examine CSR related
information. This analytical method has been widely used in previous studies such as in Zainal, Zulkifli and Saleh(2013), Zakaria and Dewa (2010), Lee, Fairhurst and Wesley (2009). It is noteworthy that the disclosure rate of CSR activities in Malaysia is still very low and unstandardized since the regulatory requirement for CSR reporting was introduced by the Bursa Malaysia in 2007. As such, we have to mediate the CSR activities based on the CSR related reports by each of the Top 100 PLCs.
4. Finding and Discussion
From Eq. 1, this study computed unweighted CSR index (i. e. C
) of eachof the Top PLCs. The weighted scores (i. e. C
) are calculated based on Eq. 2, but the value for each variable on the right hand side of that formula is derived from Eq. 3 to Eq. 6.
Table 1 summarizes the sectoral activities of the Top 100 PLCs. From our content analysis, we found that only 19 companies published a standalone CSR or Sustainability Report ( 6 firms based on the GRI and 1 firm based on DJSI guidelines)
2, 7 firms published the excerpt of their CSR section from their Annual Report as a standalone document; 79 firms report CSR in a section of their Annual Report (2 follows GRI and 1 DJSI guidelines) while 2 firms did not report their CSR activities.
Based on the four major dimensions of CSR activities i. e. community, environment, marketplace, and workplace, the findings suggest the following trend.
Majority (i. e. 91. 2%) of the Top 100 PLCs in Malaysia emphasizedtheir CSR on community related activities, follows by environmental related activities (85. 1%), workplace related activities (78. 7%) and marketplace related activities ( 64. 9%).
2 GRI refers to Global Reporting Initiative, whereas DJSI denotes Dow Jones Sustainability Index.
Table 1 Sectoral Activities of the Top 100 Companies
Sectors No of
Company Reports CSR in Annual Report
Reports in Standalone CSR Report
Standalone Report part of Annual Report
Follows Universal CSR Reporting Guideline
Construction 4 4 1 1
Consumer 13 11 6 2
Finance 13 12 4 1 2
Hotel 1 1
Industrial Product 9 9 1
Infrastructure Project 4 3 1
Plantation 11 11
Properties 8 7
Real Estate Investment Trusts 4 4 1 1
Technology 1 1
Trading/Services 32 29 6 5
Grand Total 100 92 19 2 11
Based on the content intensity analysis of their CSR reports, the analytical results suggest that the Top 100 PLCs incline to publicize more on community related CSR activities followed by workplace, environment, and marketplace. The work count ratios for these four dimensions are shown in Table 2.
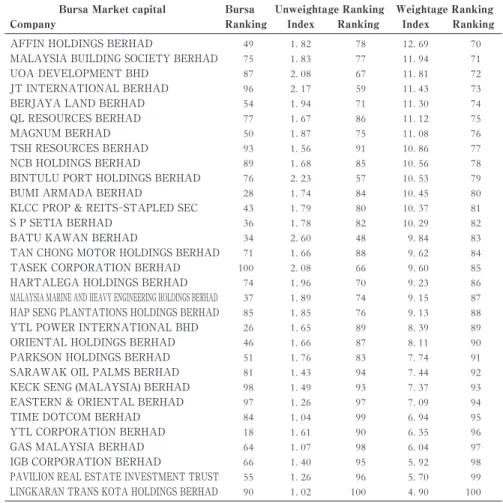
Table 3 tabulates the overall analytical results based on three criteria: Bursa Malaysia rankings based on market capitalization; the unweighted CSR rankings (i.
e. C
rankings); the weighted CSR rankings ( i. e. C
rankings). On the basis of these results, we characterized them according to the changing pattern of rankings (Table 4). There are at least three salient characteristics. Firstly, the results show that only Public Bank shows an unchanged ranking. This company is consistently ranked 3
rdin the three ranking methods suggest that it is strongly balanced in profit generation and CSR contribution. Hence, for theoretical and practical reasons, it is valuable to undertake a thorough analysis on Public Bank business and CSR practices, and the findings certainly are useful as references or benchmarks for other PLCs.
Secondly, the rankings of 99 PLCs changed when their CSR performances were evaluated on both unweighted and weighted methods. Among them, a significant number of PLCs have improved their rankings when various financial indicators and CSR are taken into account. This implies that there is an increasing awareness among the Top 100 PLCs to undertake CSR activities in Malaysia. On the contrary, quite a number of the Top PLCs have plunged their rankings as well. This pattern suggests that there are PLCs that did well in profit generation but they were relatively weak in undertaking CSR activities.
Table 3 Unweighted and Weighted Index and Ranking of Top 100 PLC in Malaysia Bursa Market capital Bursa
Ranking
Unweightage Ranking Weightage Ranking
Company Index Ranking Index Ranking
CARLSBERG BREWERY MALAYSIA BERHAD 57 5. 41 4 62. 11 1
MEDIA PRIMA BERHAD 79 4. 60 10 60. 91 2
PUBLIC BANK BERHAD 3 5. 74 3 56. 61 3
LPI CAPITAL BHD 67 4. 68 8 52. 64 4
PETRONAS GAS BERHAD 9 4. 71 7 47. 72 5
AMMB HOLDINGS BERHAD 21 3. 94 16 47. 26 6
MAH SING GROUP BERHAD 95 3. 36 25 45. 63 7
AXIATA GROUP BERHAD 5 4. 65 9 44. 44 8
AIRASIA BERHAD 33 3. 62 20 42. 64 9
MALAYAN BANKING BERHAD 1 6. 13 2 42. 57 10
BRITISH AMERICAN TOBACCO (MALAYSIA) BERHAD 22 6. 70 1 42. 37 11
PETRONAS CHEMICALS GROUP BERHAD 6 4. 90 5 41. 15 12
SUNWAY BERHAD 69 3. 49 22 41. 14 13
KULIM (MALAYSIA) BERHAD 41 4. 36 11 40. 69 14
Table 2 Word Count Ratio between CSR Components
CSR Components Community Marketplace Workplace Environment Intensity of Content 4. 50 1. 24 2. 13 2. 03
Bursa Market capital Bursa Ranking
Unweightage Ranking Weightage Ranking
Company Index Ranking Index Ranking
TENAGA NASIONAL BHD 10 4. 32 14 37. 85 15
TELEKOM MALAYSIA BERHAD 16 4. 29 15 37. 64 16
MALAYSIA AIRPORTS HOLDINGS BERHAD 40 3. 32 28 34. 13 17
STAR MEDIA GROUP BERHAD 92 3. 22 32 33. 83 18
RHB CAPITAL BERHAD 20 3. 35 26 33. 08 19
LAFARGE MALAYSIA BERHAD 30 3. 52 21 32. 48 20
UEM SUNRISE BERHAD 29 2. 66 47 31. 52 21
GENTING BERHAD 11 3. 80 17 31. 36 22
SIME DARBY BERHAD 2 4. 35 13 29. 65 23
KUALA LUMPUR KEPONG BERHAD 13 4. 87 6 29. 64 24
KPJ HEALTHCARE BERHAD 58 2. 77 42 28. 28 25
GENTING PLANTATIONS BERHAD 38 2. 99 34 27. 54 26
IJM CORPORATION BERHAD 32 2. 69 45 27. 17 27
FRASER & NEAVE HOLDINGS BHD 39 3. 31 29 26. 72 28
MAXIS BERHAD 7 3. 29 30 26. 68 29
MISC BERHAD 19 2. 79 40 25. 98 30
UNITED PLANTATIONS BERHAD 48 3. 63 19 25. 66 31
GAMUDA BERHAD 35 3. 05 33 25. 44 32
CIMB GROUP HOLDINGS BERHAD 4 4. 35 12 24. 84 33
BIMB HOLDINGS BERHAD 72 2. 38 53 24. 03 34
SHELL REFINING COMPANY (FEDERATION OF MALAYA) BERHAD 80 2. 04 68 23. 58 35
IJM LAND BERHAD 70 2. 14 61 23. 14 36
IJM PLANTATIONS BERHAD 78 2. 78 41 23. 13 37
DRB-HICOM BERHAD 53 2. 59 49 22. 97 38
MALAYSIAN AIRLINE 83 1. 79 81 21. 72 39
HONG LEONG BANK BERHAD 15 2. 87 37 21. 71 40
PETRONAS DAGANGAN BHD 14 3. 47 23 20. 96 41
IOI CORPORATION BERHAD 12 3. 45 24 20. 70 42
BERJAYA CORPORATION BERHAD 61 2. 11 63 20. 22 43
ALLIANCE FINANCIAL GROUP BERHAD 42 2. 22 58 19. 90 44
AEON CO. (M) BHD 52 2. 31 55 19. 85 45
UMW HOLDINGS BERHAD 24 2. 88 36 19. 46 46
BOUSTEAD HOLDINGS BERHAD 47 2. 87 38 19. 08 47
DIGI. COM BERHAD 8 3. 34 27 18. 95 48
GENTING MALAYSIA BERHAD 17 2. 75 43 18. 66 49
SHANGRI-LA HOTELS (MALAYSIA) BERHAD 94 2. 25 56 18. 60 50
JAYA TIASA HOLDINGS BHD 82 2. 11 65 18. 30 51
GUINNESS ANCHOR BERHAD 56 3. 23 31 17. 81 52
SUNWAY REAL ESTATE INVESTMENT TRUST 60 2. 11 64 17. 78 53
BURSA MALAYSIA BERHAD 63 2. 75 44 17. 66 54
PPB GROUP BERHAD 25 2. 48 50 17. 56 55
DUTCH LADY MILK INDUSTRIES BERHAD 73 2. 82 39 17. 11 56
MALAYSIAN RESOURCES CORPORATION BERHAD 88 1. 93 73 16. 28 57
MSM MALAYSIA HOLDINGS BERHAD 62 2. 41 52 15. 59 58
MMC CORPORATION BERHAD 31 1. 82 79 15. 24 59
HONG LEONG FINANCIAL GROUP BERHAD 27 2. 35 54 15. 20 60
JCY INTERNATIONAL BERHAD 99 2. 16 60 15. 16 61
BERJAYA SPORTS TOTO BERHAD 44 2. 89 35 14. 87 62
NESTLE (MALAYSIA) BERHAD 23 3. 78 18 14. 85 63
HAP SENG CONSOLIDATED BERHAD 59 2. 13 62 14. 79 64
TOP GLOVE CORPORATION BHD 65 2. 46 51 14. 15 65
CAPITAMALLS MALAYSIA TRUST 68 1. 97 69 14. 09 66
DIALOG GROUP BERHAD 45 1. 93 72 13. 65 67
AMWAY (MALAYSIA) HOLDINGS BERHAD 91 2. 68 46 13. 58 68
WCT HOLDINGS BERHAD 86 1. 56 92 13. 11 69
Bursa Market capital Bursa Ranking
Unweightage Ranking Weightage Ranking
Company Index Ranking Index Ranking
AFFIN HOLDINGS BERHAD 49 1. 82 78 12. 69 70
MALAYSIA BUILDING SOCIETY BERHAD 75 1. 83 77 11. 94 71
UOA DEVELOPMENT BHD 87 2. 08 67 11. 81 72
JT INTERNATIONAL BERHAD 96 2. 17 59 11. 43 73
BERJAYA LAND BERHAD 54 1. 94 71 11. 30 74
QL RESOURCES BERHAD 77 1. 67 86 11. 12 75
MAGNUM BERHAD 50 1. 87 75 11. 08 76
TSH RESOURCES BERHAD 93 1. 56 91 10. 86 77
NCB HOLDINGS BERHAD 89 1. 68 85 10. 56 78
BINTULU PORT HOLDINGS BERHAD 76 2. 23 57 10. 53 79
BUMI ARMADA BERHAD 28 1. 74 84 10. 45 80
KLCC PROP & REITS-STAPLED SEC 43 1. 79 80 10. 37 81
S P SETIA BERHAD 36 1. 78 82 10. 29 82
BATU KAWAN BERHAD 34 2. 60 48 9. 84 83
TAN CHONG MOTOR HOLDINGS BERHAD 71 1. 66 88 9. 62 84
TASEK CORPORATION BERHAD 100 2. 08 66 9. 60 85
HARTALEGA HOLDINGS BERHAD 74 1. 96 70 9. 23 86
MALAYSIA MARINE AND HEAVY ENGINEERING HOLDINGS BERHAD 37 1. 89 74 9. 15 87 HAP SENG PLANTATIONS HOLDINGS BERHAD 85 1. 85 76 9. 13 88
YTL POWER INTERNATIONAL BHD 26 1. 65 89 8. 39 89
ORIENTAL HOLDINGS BERHAD 46 1. 66 87 8. 11 90
PARKSON HOLDINGS BERHAD 51 1. 76 83 7. 74 91
SARAWAK OIL PALMS BERHAD 81 1. 43 94 7. 44 92
KECK SENG (MALAYSIA) BERHAD 98 1. 49 93 7. 37 93
EASTERN & ORIENTAL BERHAD 97 1. 26 97 7. 09 94
TIME DOTCOM BERHAD 84 1. 04 99 6. 94 95
YTL CORPORATION BERHAD 18 1. 61 90 6. 35 96
GAS MALAYSIA BERHAD 64 1. 07 98 6. 04 97
IGB CORPORATION BERHAD 66 1. 40 95 5. 92 98
PAVILION REAL ESTATE INVESTMENT TRUST 55 1. 26 96 5. 70 99 LINGKARAN TRANS KOTA HOLDINGS BERHAD 90 1. 02 100 4. 90 100
Table 4 Changing Pattern of Ranking under CSR Moderated Method Pattern
Shape Description Sector Percentage Number of
Companies The ranking remain unchanged despite
the different method of measurement being used.
Finance 1% 1
The ranking increase after CSR compo- nents were taken into account. This implies that the company has relatively high CSR contribution despite of low market and financial performance.
Construction 2%
26
Consumer 2%
Finance 3%
Hotel 1%
Industrial Product 5%
Plantation 3%
Properties 3%
Trading/Services 7%
The ranking decline after CSR compo- nents were taken into account. This implies that the company has relatively low CSR contribution despite of better market and financial performance.
Consumer 3%
24
Finance 4%
Infrastructure Project 1%
Plantation 2%
Properties 1%
REIT Trading/Services 2%
Trading/Services 11%
Pattern
Shape Description Sector Percentage Number of
Companies The ranking increase under unweightage
index measurement but decrease when weightage measurement is applied. This indicates that the company has some inconsistencies in bothfinancial perform- ance and CSR when every component are treated equally important.
Construction 2%
22
Consumer 2%
Finance 4%
Infrastructure Project 1%
Plantation 1%
Properties 1%
REIT Trading/Services 2%
Trading/Services 9%
The ranking drops under unweightage index measurement but increase when weightage measurement is applied. This indicates that the company is consistent in bothfinancial performance and CSR when every component is treated equally impor- tant.
Consumer 6%
22
Finance 1%
Industrial Product 4%
Plantation 4%
Properties 1%
Technology 1%
Trading/Services 5%
The ranking drops under the unweightage index measurement and remain un- changed under the weightage measure- ment. This indicates that the company is not taking the CSR seriously.
Infrastructure Project 2%
3
Properties 1%
The ranking increases under the un- weightage index measurement and remain unchanged under the weightage measure- ment. This indicates that the company is placing CSR as part of their activities.
Properties 1% 1
The ranking remains unchanged under bothunweightage but increase under weightage measurement. This suggest that the company has serious efforts on CSR activities.
Industrial Product 1% 1
Total 100% 100
Thirdly, both the unweighted and weighted methods have convincingly showed some varieties on company rankings when CSR and other financial indicators are used as moderators. As far as CSR activities and reporting by the Top PLCs in Malaysia is concerned, their commitments are still low. These are evident from our analytical results particularly there are almost equal number of PLCs that have shown their rise and fall in rankings, quite similar number of PLCs that have changed in rankings in the form of U-shaped and inverse U-shaped patterns. The U-shaped pattern means the ranking rise under unweighted CSR measurement but it drops when weights are applied to the performance evaluation.
The inverse U-shaped is the reverse. In this case, the rankings of 26 PLCs plunged when weightages were assigned to each of the dimension in CSR index.
5. Conclusion
This study has established a metric for quantifying CSR performances. This
quantifiable multi-dimensional CSR index comprises economic prosperity, market- place, community, workplace and environment. The CSR index is used to analyze CSR performances of the Top 100 PLCs in Malaysia, in which the results were used for ranking their CSR performances. For this purpose, the analyses used two approaches. The first approach was the computations of CSR index based on unweighed method, whereas the second one adopted the weightage method. For the second approach, the analysis separated economic prosperity into market performance, financial performance and company size. Market performance encompasses market capitalization and market value; financial performances include earning per share, dividend per share, return on equity, dividend payout per share, return on investment; whereas company size is measured in number of employees. Additionally, for the purpose of verifying the usefulness of the established CSR index, the analysis used Bursa Malaysiaʼs rankings based on market capitalization of the Top 100 PLCs.
The findings show that there is only one PLC―Public Bank―is consistently ranked 3
rdin all three methods. This result indicates that Public Bank is strongly balanced in profit generation and CSR contribution. The findings also show the rankings of some PLCs have improved when CSR activities with the assigned weightage are incorporated as moderators for evaluating CSR performances. The opposite results were also evident from the analysis. More importantly, the results suggest that with an appropriate system of metrics in quantifying CSR performances, a corporation could certainly achieve a better standing in the society not merely due to a better financial performance but because of its strive to becoming a more responsible corporate citizen in enhancing social wellbeing beyond the acts of paying taxes, employment generation and maximization of shareholders wealth. Hence CSR activities should not be viewed as a means for improving public and investment relations but they ought to be included as an integral part of the corporateʼs role in the society. For this reason, focusing on the Top 100 PLCs in Malaysia, this study has contributed significantly to the establishment of a metric in the form of a multi-dimensional CSR index for evaluating CSR performances.
This study has adopted the word count approach for content analysis of CSR
reports. The method focused on PLCsʼ annual reports and the results were
weighted for all five CSR dimensions. This analytical approach has a limitation
because the nature of businesses varies across sectors and companies. For future
research, we shall attempt to conduct content analysis based on companiesʼ CSR
reports with respect to different industrial sectors. From that approach, we
anticipate to identify what are the dominant types of CSR activities in each
industrial sector. Additionally, the outstanding performance shown by Public Bank
warrants an in-depthcase study withrespect to its business practices and CSR
activities. The analytical findings from this proposed future study will undoubtedly
bring to the table useful references.
The current CSR reporting styles adopted by the Top 100 PLCs in Malaysia indicate that the benefactorsʼ awareness and willingness to strengthen CSR activities in terms of their approaches and scope are low, which in turn caused inherent CSR disclosures in their annual reports. The demand for corporate supports in the society―particularly those areas that are not attended sufficiently by the government sectors and NPOs―is enormous. The situation in Malaysia is the same but this study found that most of the Top 100 PLCs have chosen to focus their supports to charitable activities. It is plausible to say that this kind of exposures enhances their corporate images and hence it is a good incentive for the Top 100 PLCs. In order to diversify corporatesʼ scope in CSR activities, government and NGOs have to work together with the corporate world in promoting all areas of social responsibility and sustainability in Malaysia.
References
Abdifatah, A. H. (2013). Corporate Social Responsibility Disclosure Over Time: Evidence from Malaysia.Managerial Auditing Journal, 28(7),647-676.
Abdifatah, A. H., & Nazli Anum, M. G. (2013). The Quality and Determinants of Voluntary Disclosures in Annual Reports of Shariʼah Compliant Companies in Malaysia.Humano- mics, 29(1),24-42.
Abdul Hamid, F. Z., & Atan, R. (2011). Corporate Social Responsibility by The Malaysian Telecommunication Firms. International Journal of Business and Social Science, 2(5), 198-208.
Abdulrazak, S. R., & Ahmad, F. S. (2014). The Basis for Corporate Social Responsibility in Malaysia.Global Business and Management Research: An International Journal, 6(3), 210-218.
Amran, A., & Siti-Nabiha, A. K. (2009). Corporate Social Reporting in Malaysia: A Case of Mimicking the West or Succumbing to Local Pressure.Social Responsibility Journal, 5(3), 358-375.
Amran, A., Zain, M. M., Sulaiman, M., Sarker, T., & Ooi, S. K. (2013). Empowering Society for Better Corporate Social Responsibility (CSR): The Case of Malaysia.Kajian Malaysia, 31 (1),57-78.
Campbell, J. L. (2007). Why Would Corporations Behave in Socially Responsible Ways? An Institutional Theory of Corporate Social Responsibility.Academy of Management Review, 32(3),946-967. doi:10. 2307/20159343
Caroll, A. B. (1991). The Pyramid of Corporate Social Responsibility: Toward the Moral Management of Organizational Stakeholders.Business Horizons, 34(4),39-48.
Chappel, W., & Moon, J. (2005). Corporate Social Responsibility ( CSR ) in Asia: A Seven-Country Study of CSR Web Reporting.Business and Society, 44(4),415-441.
Elkington, J. (1994). Towards the Sustainable Corporation: Win Win Win Business Strategies for Sustainable Development California.Management Review, 36(2),90-100.
Friedman, M. (1970, September13). The Social Responsibility of Business is to Increase its Profit.The New York Times.
Geva, A. (2008). Three Models of Corporate Social Responsibility: Interrelationships between Theory, Research, and Practice.Business and Society Review, 113(1),1-41. doi:10. 1111/j.
1467-8594. 2008. 00311.
Husted, B. W. (2015). Corporate Social Responsibility Practice from1800-1914: Past Initiatives and Current Debates.Business Ethics Quarterly, 25(1),125-141.
Lee, M., Y. Fairhust, A., & Wesley, S. (2009). Corporate Social Responsibility: A Review of the Top100US Retailers.Corporate Reputation Review, 12(2),140-158.
Lindgreen, A., Swaen, V., & Johnston, W. (2009). The Supporting Function of Marketing in Corporate Social Responsibility.Corporate Reputation Review, 12(2),120-139.
Matten, D., & Moon, J. (2008). “Implicit” and “Explicit” CSR: A Conceptual Framework for A Comparative Understanding of Corporate Social Responsibility.Academy of Management Review, 33(2),404-424.
Othman, R., & Thani, A. M. (2010). Islamic Social Reporting of Listed Companies in Malaysia.
The International Business & Economics Research Journal, 9(4),135-144.
Porter, M. E., & Kramer, M. R. (2006). Strategy & Society: The Link Between Competitive Advantage and Corporate Social Responsibility.Harvard Business Review, 84(12),78-92.
Ramasamy, B., Ting, H. W., & Yeung, M. C. (2007). Does it Pay to be Good in Developing Countries? The Relationship Between CSR and Financial Performance in Malaysia.Asian Academy of Management Journal of Accounting and Finance, 3(1),21-36.
Raza, A., Ilyas, M. I., Raul, R., & Qamar, R. (2012). Relationship between Corporate Social Responsibility ( CSR ) and Corporate Financial Performance ( CFP ): Literature Review Approach.Elixir Financial Management, 46(9),8404-8409.
Saleh, M., Zulkifli, N., & Muhamad, R. (2011). Looking for Evidence of the Relationship between Corporate Social Responsibility and Corporate Financial Performance in an Emerging Market. Asia Pacific Journal of Business Administration, 3 ( 2), 165-190. doi:
10. 1108/17574321111169849
Thompson, P., & Zakaria, Z. (2004). Corporate Social Responsibility Reporting in Malaysia:
Progress and Prospect.The Journal of Corporate Citizenship, 13,125-136.
UNICEF. (2012). Corporate Social Responsibility Policies in Malaysia Enhancing the Child Focus.Kuala Lumpur: United Nations Childrenʼs Fund (UNICEF) Malaysia.
WBCSD. (1999).Business role: Corporate Social Responsibility. Retrieved on5July2015, from World Business Council for Sustainable Development: http: //www. wbcsd. org/
work-program/business-role/previous-work/corporate-social-responsibility.aspx Zainal, D., Zulkifli, N., & Saleh, Z. (2013). Corporate Social Responsibility Reporting in Malaysia:
A Comparison Between Shariah and Non-Shariah Approved Firms.Middle-East Journal of Scientific Research, 15(7),1035-1046.
Zakaria, S., & Dewa, N. (2010). Corporate Social Responsibility ( CSR ) Reporting in Six Malaysian Financial Institutions. 2010 Oxford Business & Economics Conference Program, June 28-29th.
Appendix 1 Market Value, Unweightage, and Weightage Index Changing Pattern No Pattern Symbol Result Interpretation
1 Consistent →
The ranking remains unchanged despite different methods of measurement. Companies in this category indicate their strength and balanced performance in most of the components and variables adopt in this study.
2 Decreasing ↘
The ranking falls after CSR components were taken into account. This implies that the company has relatively low CSR contribution despite better market and financial performance.
3 Increasing ↗
The ranking rises after CSR components were taken into account.
This implies that the company has relatively high CSR contribution despite low market and financial performance.
4 U Shape ∪
The ranking drops under unweighted index measurement but it increases when weighted measurement is applied. This indicates that the company is consistent in both financial performance and CSR when every component is treated equally important.
5 Inv-U Shape ∩
The rankings rises under unweighted index measurement but falls when weighted measurement is applied. This indicates that the company has some inconsistencies in both financial performance and CSR performance when every component is treated equally important.
6 L-Shape L
The ranking drops under the unweighted index measurement and it remains unchanged under the weighted measurement. This indicates that the company is not taking the CSR seriously.
7 Inv-L Shape Γ
The ranking goes up under the unweighted index measurement and it remains unchanged under the weighted measurement. This indicates that the company is placing CSR as part of their activities.
8 Mir-L Shape Γ The ranking remains unchanged under unweighted index measure- ment but it goes up under weighted measurement. This suggest that the company has serious efforts on CSR activities.