A Study on the α‑ β‑and γ‑Polypeptide Chains in
Normal Human Adult and Fetal Hemoglobin by Cellulose Acetate Membrane Electrophoresis*
Shinichi KOBAYASHI**
Department of Biochemistry Nagasaki University School of Medicine
Nagasaki, Japan
Received for publication, Septemer 1, 1965
For the purpose of separation and identification of the α‑, β‑and γ‑poly‑
peptide chains contained in healthy human adult and fetal hemoglobins, studies were performed by means of cellulose acetate membrane elec- trophoresis. On this method of electrophoresis, a comparative examination was made in various combinations of the effects of the urea concentration, temperature and time in the treatment of the globins before electrophoresis, and the effects of the urea concentration, ionic strength, and pH of the veronal buffer in course of electrophoresis. As the result, this method
proved to be a simple and rapid way to separate the α‑, β‑and γ‑poly‑
peptide chains of human hemoglobin with an efficient ability of separation.
For a better separation of these three kinds of polypeptide chains, desired results were recognized when the globin was incubated in 8 M urea solution at a room temperature for 30 min for the pretreatment before electrophoresis, and was subjected to electrophoresis at a current of 0.5 mA/cm for 30 min by the use of a veronal buffer of ionic strength 0.045 and pH 6.2- 6.5 containing 6 M urea.
Recently, a great many studies have been made on human and various other animal hemoglobins. On human hemoglobin, especially, detailed studies have been achieved on many kinds of adult, fetal and various abnormal hemoglobins. It has been confirmed that adult hemo- globin consists of four polypeptide chains, two a-and two 19-chains,while fetal hemoglobin four polypeptide chains, two a-and tow r-chains, and that the a-chains belonging commonly to both hemoglobin are identical.
**小 林 信 一
1965 ELECTROPHORETIC STUDY OF HUMAN GLOBIN 13 Moreover, the primary structures of these a-, Q-and r-polypeptide chains have already been determined, and it is known that the a-chain is composed of 141 amino acids, and each of the /3-and ,r-chains 146 amino
acid S2,1,101.
Therefore, a simple method to separate and identify these a-, /3-and r-polypetide chains composing human hemoglobin is much needed for various studies, for example, to determine, in the investigation of abnormal hemoglobin, which of the a-, /3-and r-chains is abnormal; to determine the purity of the a-, (3-and r-chains which have been isolated and purified by another method; or to compare them with various kinds of polypeptide chains composing other animal hemoglobins.
For the purpose of simple identification of the a-, (3-and r-polypeptide chains, starch-gel elect rophoresis7) and filter paper electrophoresis in
the presence of urea9, 10' have been reported. Recently, electrophoresis on cellulose acetate membranes has come to be employed to analyze various proteins. This method has the advantages of the following points:
the necessary amount of the sample is very small, it takes us a very short time, the apparatus used is of small size, staining is easy, and ability of separation is high. Therefore, the present author performed urea dissociation electrophoresis using cellulose acetate membranes in order to isolate and identify the a-, p- and r-polypeptide chains contained in human hemoglobin. No report has been presented on the isolation and identification of these polypeptide chains from globins by the use of cellulose acetate membranes. In the present work, the effects of the urea concentration, temperature and time in the treatment of the globin before electrophoresis, and the effects of ionic strength, pH and urea concentration in the veronal buffer during electrophoresis have been mainly studied comparatively.
MATERIALS AND METHODS
1) Preparation of Hemoglobin Solution
Preparation of the hemoglobin solution was carried out according to DRABKIN'S method') from venous blood of healthy human adults and cord blood of the newborn. The blood sample, after the addition of sodium citrate as an anticoagulant, was centrifuged at 1,000-2,000 r.
p. m. at 0-5°C for 5 min to separate the red blood cells. Then the obtained red cells were washed with 0.9% NaCI solution three times.
The washed red cells were hemolyzed by adding 2 volumes of distilled
water and 0.4 volume of toluene and shaking the mixture. The hemoly-
sate was subsequently centrifuged at 15,000 r. p. m. at 0-5°C for 60
min. In the centrifuge tube, the hemolysate was divided into three
layers, the middle of which, the desired hemoglobin solution, was taken
up.
2) Preparation of Globin
The removal of heme from the purified hemoglobin was performed by the met hod of ANSON and MIRSKI.11 An acetone solution containing 2% concentrated hydrochloric acid was cooled at-15'C. To the solution, 0.1 volume of 10% !hemoglobin solution was added and the mixture was stirred for 20 min. Then the globin moiety was separated from the Solution by centrifugation, washed by cooled acetone, and dissolved into water. And after one more repeated treatment, it was lyophilized.
3) Treatment of Globin before Electrophoresis
To have a good dissociation of those globin-composing polypeptide chains by alight denaturation of the globin before electrophoresis, namely for preincubation, portions of globin were incubated in distilled water and 4 M, 6 M, 8 M and 10 M urea solutions, respectively, for 30 min, 3 hr, 12 hr and 24 hr at 16-18°C; for 30 min and 1 hr at 50°C; and for 30 min and 1 hr at 80°C; and the results were discussed.
4) Cellulose Acetate Membrane Electrophoresis
a) Apparatus for electrophoresis
An apparatus as illustrated in Fig. 1 was made with some modifica- tion of the cellulose acetate membrane fixing apparatus which OGAWA had reported". The cellulose acetate membrane used was what was manufac- tured by OXO Company and obtained from JOKO Industrial Company Ltd. For the densitometer to analyze the patterns after electrophoresis
Eig. 1. Apparatus for Cellulose Acetate Membrane Electrophoresis
A. Supporting plate B. Arranging bridge
C. Pressing plate D. Filter paper
E. Electrode compartment F. Cellulose acetate membrane strip
G. Lid H. Central Compartment
T. Electrode
1965 ELECTROPHORETIC STUDY OF HUMAN GLOBIN 15 was employed ATAGO Self-recording Densitometer Ozumor-7 (ATAGO Optical Works Co. Ltd. ).
b) Buffers for electrophoresis
The following kinds of veronal buffers were employed for electropho- resis, and the results were examined comparatively..
i) Solutions of ionic strength 0.015, 0.030, 0.045, 0.060, 0.075, and 0.090 were prepared with sodium 5,5-diethylbarbiturate and sodium acetate according to the method of HOLT and GAEDE5'. These solutions were adjusted to pH 8.0 with acetic acid, and to them urea was added by the concentration of 6 M. Using these veronal buffers, the effects by the difference of the ionic strength in the buffer were examined.
ii) Portions of the above veronal buffer of ionic strength 0.045 were adjusted to pH 6.0, 6.2, 6.5, 7.0, 8.0 and 9.0 with N/10 acetic acid solution. To them urea was added by the concentraion of 6 M.
Using these kinds of veronal buffers, the effects by the difference of the pH in the buffer were examined.
iii) The above veronal buffer of ionic strength 0.045 and pH 8.0, and portions of the said buffer containing urea by the concentration of 4 M, 5 M, 6 M, 7 M and 8 M were used and the effects by the differ- ence of the urea concentration in the buffer were examined.
c) Operation of electrophoresis
A cellusole acetate membrane was cut into strips of 5.0 cm by 1.0 cm and one of the strips was dipped evenly into the buffer to be used.
The excess of the buffer on the strip was removed by filter paper and the strip was placed in the apparatus crossing over the central compart- ment with its ends on both supporting plates and fixed with the pressing plates. On the line which was previously drawn with a pencil at 1.5 cm distant from the anode-side end of the strip, the globin solution which had been preincubated was applied directly with a capillary in a breadth of 0.05-0.1 cm and a length of 0.7-0.8 cm. Electrophoresis was performed at a constant current of 0.4-0.5 mA/cm for 30-40 min.
After the electrophoresis, the strip was taken out and the remaining
buffer on the strip was removed with filter paper. The strip was dipped
in a Ponceau 3 R staining solution (3 % trichloroacetic acid solution
containg 0.4% Ponceau 3 R) for about 30 sec. The excess of the solution
on the strip was removed with filter paper and the strip was washed
thoroughly with 5 % acetic acid. The washed strip was dried, and after
it was dipped in liquid paraffin to make it transparent, it was analyzed
by the automatic densitometer with a 500 m,'i filter.
RESULTS AND DISCUSSION
1) Effects of Temperature and Time in Preincubation
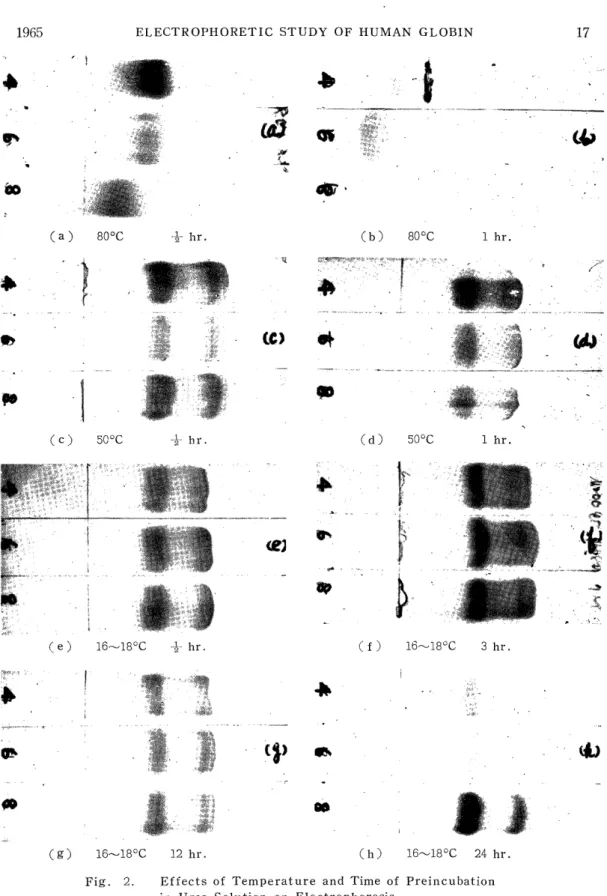
The effects of the temperature and the time in preincubation were compared and discussed in 4 M, 6 M, and 8 M, urea solutions using mainly human adult globin in this experiment. As for the experimental conditions, electrophoresis was performed at the current of 0.5 mA/cm for 40 min by the use of a veronal buffer of ionic strength 0.045, pH 8.0 and urea concentration 7 M. The results are shown in Figs. 2 and 3.
The migration patterns of the globin when it was preincubated at 80°C for 30 min are shown in (a) of Fig. 2. In all the cases of 4 M, 6 M and 8 M urea solutions, the patterns migrated towards the cathode, but presenting tailing, they failed to divide into the two bands, a and l3. The higher the concentration of the urea solution for the incubation was, the less the migration velocity was, and the nearer to the origin the patterns remained. The migration patterns of the globin when it was preincubated at 80°C for 1 hr are shown in (b) of Fig. 2. In all the cases of 4 M, 6 M and 8 M urea solutions, most of the globin migrated in the opposite direction, that is, towards the anode. The higher the urea concentration in the solution was, the higher the migration velocity was, and the more tailing the patterns presented. The migration patterns for the incubation at 50°C for 30 min and for 1 hr are represented in (c) and (d) of Fig. 2, respectively, in which a-and j3-polypeptide chains are clearly divided. That is, the faster moving zone is the a-chain and the slower moving zone the n-chain. DRABKIN3>, examining the relation- ship between the urea denaturation and the temperature using hemoglo- bin, reported that the higher the temperature was, the higher the velocity of the denaturation was, in agreement with the results of the present experiment using globin. Furthermore, in this experiment the globin incubated at 16-18°C for 30 min, 3 hr, 12 hr and 24 hr was subjected to electrophoresis, and the electrophoretic patterns are shown in (e), (f), (g) and (h) of Fig. 2, respectively. There every migration pattern is clearly divided into the a-and the j3-polypeptide chain. In this case also, the faster moving zone is the a-chain and the slower moving zone is the a-chain. Concerning filter paper electrophoresis in the presence of urea has been reported an experiment in which globin was preincu- bated for 24 hr in a urea-containing veronal buffer, but from the results
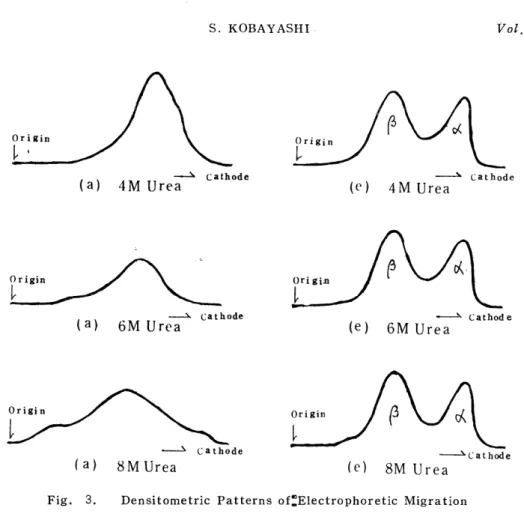
of the present experiment, preincubation for 30 min in a urea aqueous solution proved to be sufficient. In these electrophoretic patterns, the double a-chain was sometimes recognized. MULLER, 7I also recognizing a slower band in the a-chain in the experiment using starch-gel electro- phoresis, conjectured that it would be due to the agglomeration of single chains, to which the present author agreeds. Fig. 3 represents the
results of the densitometric analysis of the electrophoretic patterns
1965 ELECTROPHORETIC STUDY OF HUMAN GLOBIN 17
Fig. 2. Effects of Temperature and Time of Preincubation in Urea Solution on Electrophoresis
Veronal buffer: u=0.045, pH 8.0, Urea 7M.
0.5 mA/cm, 40 min.
Fig. 3. Densitometric Patterns of:Electrophoretic Migration Shown in (a) and (e) of Fig. 2
shown in (a) and (e) of Fig. 2.
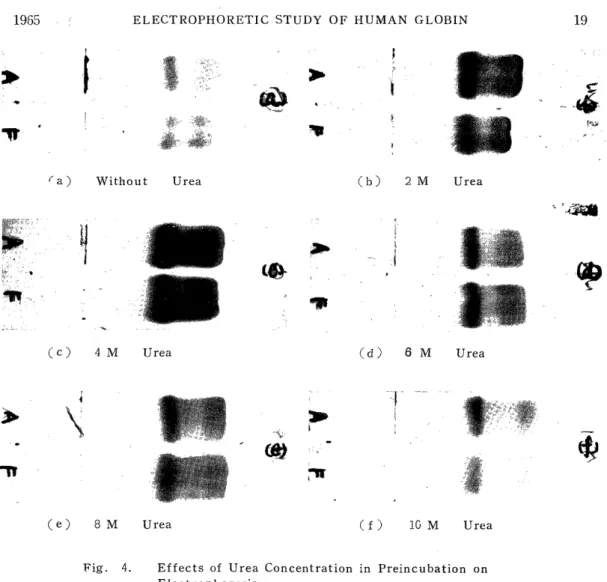
2) Effects of Urea Concentration in Preincubation
Human adult (Hb A) and fetal (Hb F) globins were incubated at 16-18°C for 30 min in distilled water, and 2 M, 4 M, 6 M, 8 M and 10 M urea solutions, and subjected to electrophoresis using a veronal buffer of ionic strength 0.045, pH 8.0 containing urea by a concentration of 7 M. The electrophoretic conditions were 0.5 mA/cm and 40 min.
The results are shown in Fig. 4. In this figure, (a) represents the results of preincubation in distilled water. There, Hb A and Hb F are both divided into the a-, p-and r-chains, but in spite of the a-chains in these two kinds of hemoglobins having the same structure, the a- chain of Hb F migrated more slowly than that of Hb A. For the 2 M and 4 M urea solutions shown in (b) and (c) also, the migration velocity of the a-chain of Hb F was a little slower than that of Hb A, while for the 6 M, 8 M and 10 M urea solutions shown in (d), (e) and (f), Hb A and Hb F have a-chains with the same migration velocity.
Originally, urea is known to denature proteins. when the concentra-
tion of urea in the solution for preincubation is low, however, the
1965 ELECTROPHORETIC STUDY OF HUMAN GLOBIN 19
Fig. 4. Effects of Urea Concentration in Preincubation on Electrophoresis
Veronal buffer: u=0.045 pH8.0, Urea 7M
0.5 mA/cm, 40 min.
globin seems to divide incompletely, and especially in Hb F it is more hardly divided by urea than Hb A. When the globin is incubated in a urea concentration below 4 M, it divides insufficiently and the cr-chain in Hb F may be a little slower because it migrates gradually dividing in the buffer containing 7 M urea. Under these conditions of the buffer, any electrophoretic difference between the ('- ane r-polypeptide chains could hardly be recognized.
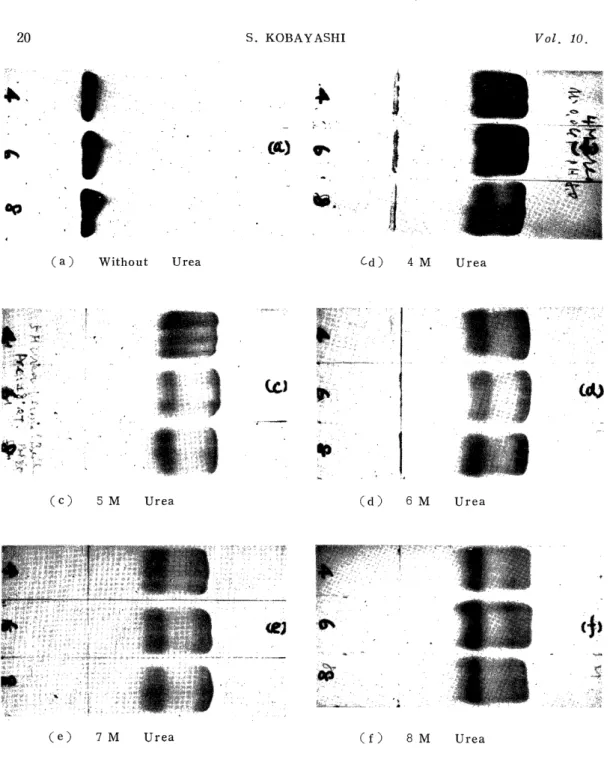
3) Effects of Urea Concentration in Veronal Buffer
In this experiment, the effects of the urea concentration in the
buffer on the globin electrophoresis were examined using human adult
globin preincubated at 16-18°C for 30 min in urea solutions of 4 M, 6
M and 8 M, and subjected to electrophoresis with the electrophoretic
veronal buffer of ionic strength 0.045, pH 8.0 and the same buffers
Fig. 5. Effects of Urea Concentration in Electrophoretic Veronal Buffers on Electrophoresis
Veronal buffer: u=0.045, pH8.0, 0.5 mA/cm, 40 min.
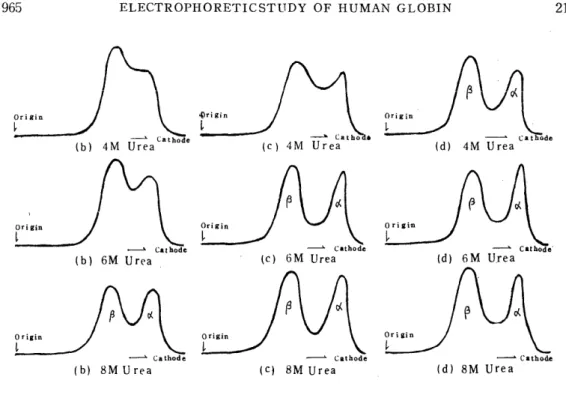
1965 ELECTROPHORETICSTUDY OF HUMAN GLOBIN 21
Fig. 6. Densitometric Patterns of Electrophoretic Migration Shown in (b), (c) and (d) fo Fig. 5
containing 4 M, 5 M, 6 M 7 M, and 8 M urea. As shown in (a) of
Fig. 5, for the non-urea-containing electrophoretic buffer, the globin
stayed almost at the origin without migration. Of course, the globin,
which was preincubated in the 4 M, 6 M and 8 M urea solutions, is
thought to have been once divided into the a- and the 8-chain, but to
have stayed at the origin uniting with each other again when placed in
non-urea-containing electrophoretic buffer. As (b) of Fig. 5 shows, with
the buffer containing 4 M urea, the globin incubated in the 4 M and
6 M urea solutions did not give any sufficiently divided patterns, but
the globin preincubated in the 8 M urea solution gave a migration
pattern divided into the a- and the p-chain. As shown in (c) of Fig. 5,
the electrophoresis with the buffer containing 5 M urea did not give
any good separation for the globin which was preincubated in the 4 M
urea solution, but gave a satisfactory separation for the globins which
were preincubated in the 6 M and 8 M urea solutions. In every case of
the electrophoresis with the buffers containing 6 M, 7 M, and 8 M urea
which is shown in (d), (e) and (f) in Fig. 5, the pattern presented a
good separation of the a- and the p-chain. From these facts it can be
considered that, when electrophoresis is carried out with a buffer contain-
ing less concentrated urea, preincubation should be performed in a
more concentrated urea solution. TAKE11) reported from the results of
his filter paper electrophoresis that globin could not be separated into
the a- and the n-chain in the electrophretic buffer of less concentration
of urea than 4 M, while the present experiment showed an interesting relationship between the urea concentration for preincubation and the urea concentration in the electrophoretic buffer. Moreover, in the report of TAKE, the electrophoretic pattern of the globin in non-urea-contain- ing buffer slowly migrated undivided towards the cathode, but in this experiment, the pattern stayed at the origin with the a-and (3-chain unseparated. This may be due to the difference between filter paper and cellulose acetate membranes. Fig. 6 represents the densitometric analysis of the migration patterns shown in (b), (c) and (d) of Fig. 5.
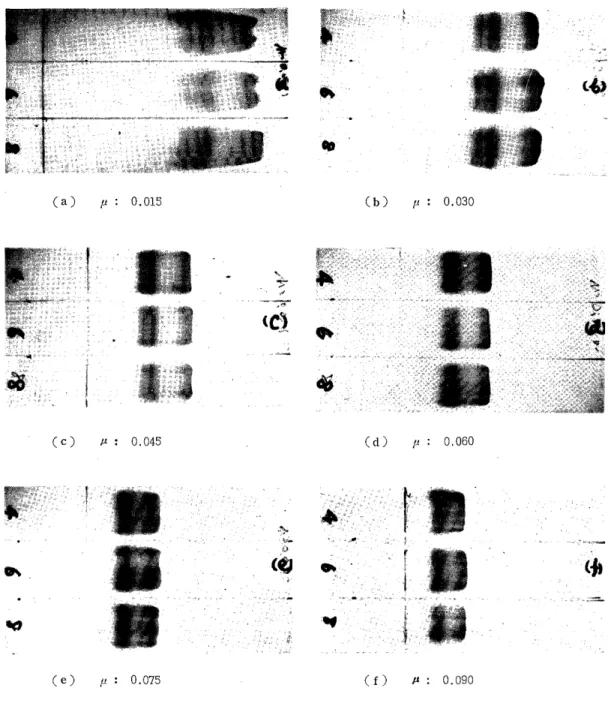
4) Effects of Ionic Strength in Veronal Buffer
The globin of human adult hemoglobin was preincubated at 16-18' C for 30 min in the 4 M, 6 M and 8 M urea solutions. On the other hand, electrophoretic veronal buffers of ionic strength of 0.015, 0.030, 0.045, 0.060, 0.075 and 0.090 were prepared and adjusted to pH 8.0.
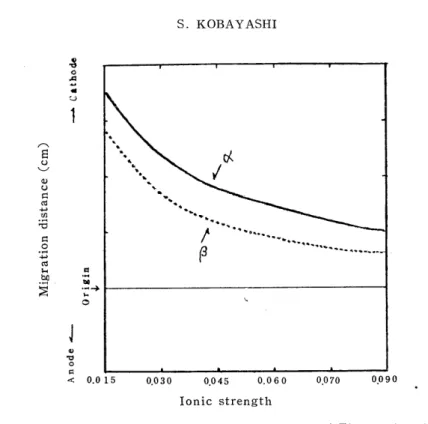
To it urea was added by the concentration of 6 M. The electrophoresis of the preincubated globin was performed with the above buffers and the relationship between the ionic strength and the migration velocity of the a- and (-chains in every case was examined. The current was 0.4 mA/cm and the time 30 min. As Figs. 7 and 8 show, as the ionic strength decreased, the breadth and the distance of zones became larger and 'the migration velocity became higher. When the ionic strength became excessively small, the pattern presented some disorder because the potential gradient on the strip became uneven and the effect of the electrosmosis became great owing to the decrease of the buffer ability.
As the ionic strength increased on the contrary, the breadth of the zones became less and the migration pattern became clear, but the distance became less and the migration velocity became less. When it became excessively great, the migration pattern became worse owing to the rising of the temperature on the membrane and the change of the buffer concentration accompanying the distillation from the strip surface, caused by the increased heat during the electrophoresis. In this experi- ment, in the cases of the ionic strength of 0.015 and 0.030, the fl-chain was recognized to migrate in double. One of these zones, as stated for the a-chain, is thought to be due to the agglomeration of single chains of p.
5) Effects of pH of Veronal Buffer
The globin from human adult hemoglobin was incubated in 4 M,
6 M and 8 M urea solutions at 16-18'C for 30 min. An electrophoretic
veronal buffer (p=0.045, the urea concentration 6 M) was adjusted to
pH 6.0, 6.2, 6.5, 7.0, 8.0 and 9.0, respectively. Electrophoresis was
performed using the above globin and the above buffers and the rela-
1965 ELECTROPHORETIC STUDY OF HUMAN GLOBIN 23
Fig. 7. Effects of Ionic Strength in Electrophoretic Veronal Buffers on Electrophoresis
Veronal buffer: pH 8.0, Urea 6 M, Q.4 mA/cm, 30 min.
Ionic strength
Fig. 8. Relationship between Ionic Strength of Electrophoretic
Buffers and Migration Velocity
tionship between the migration velocity and the pH of the electrophoretic buffers was examined. The current for the electrophoresis was 0.4 mA/cm and the time 30 min. As shown in Fig. 9, in the pH 6.0 buffer the migration velocity was high but the migration pattern presented tailing with the a-and n-chains unclearly separated. It is well known in the case of filter paper electrophoresis that, in general, when the pH of the electrophoretic buffer is lowered, the migration velocity increases.
In this experiment, in which cellulose acetate membranes were used, the similar results were obtained as shown in Fig. 10. TAKE, concern- ing filter paper electrophoresis, reported that a-and (3-chains did not separate from each other in the buffer of pH below 5.5. In the pres- ent experiment, it was difficult to separate the a-and p-chains clearly by electrophoresis in the buffer of pH below 6.0.
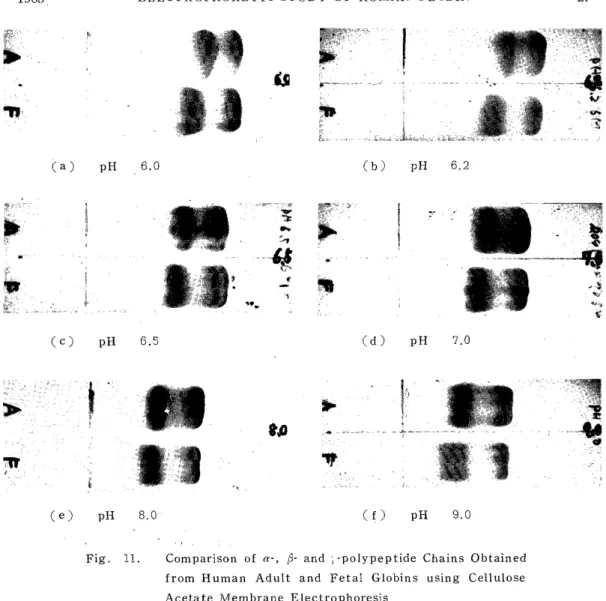
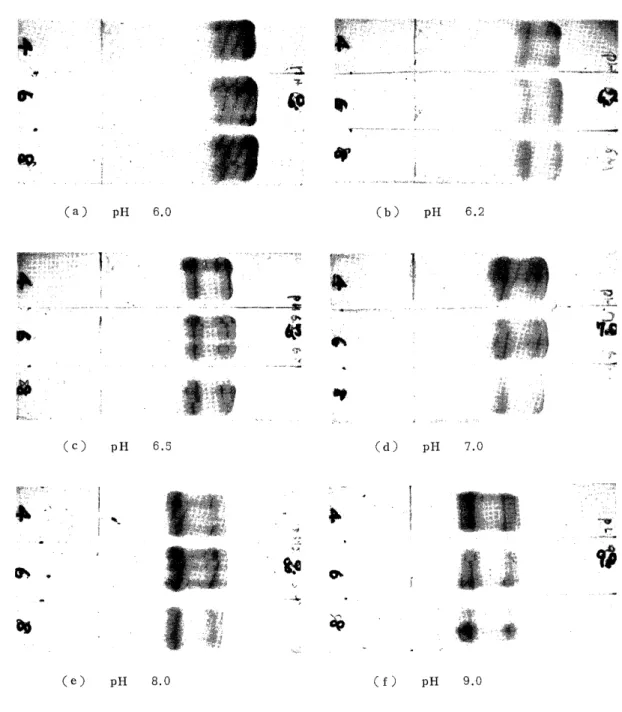
6) Electvophoretic Comparison of Human Adult and Fetal Globins
The globins from human adult and fetal hemoglobins which were
preincubated at 16-18°C for 30 min in a 8 M urea solution were applied
to electrophoresis with veronal buffers (,u=0.045, 6 M urea concentra-
tion) which were adjusted to pH 6.0, 6.2, 6.5, 7.0, 8.0 and 9.0 and
the migration patterns of the adult and fetal globins were studied by
comparison. The current for electrophoresis was 0.4 mA/cm and the time
30 min. The result, as shown in Fig. 11, was that the most suitable
range of pH of the veronal buffer for the electrophoretic separation of
1965 ELECTROPHORETIC STUDY OF HUMAN GLOBIN 25
Fig. 9. Effects of pH of Electrophoretic Veronal Buffers on Electrophoresis
Veronal buffer: u=0.045. Urea 6M, 0.4 mA/cm, 30 min.
Fig. 10. Relationship between pH in Electrophoretic Verona]
Buffers and Migration Velocity
the n-and l-chains was 6.2-6.5, and near this range, the R-chain was perceived to move more rapidly than the r-chain, and the higher the pH of the electrophoretic buffer was, the closer the velocities of the ~3- and the r-chain became.
Recently, electrophoresis of protein with cellulose acetate membranes
has been employed in many fields. In the present work, for the purpose
of the application of this method for the separation of the a-, (3- and
7i-chains composing human hemoglobin, the effects of temperature, time
and urea concentration in preincubation, and the effects of the urea
concentration, ionic strength, pH of the electrophoretic buffer were
studied with comparison.
1965 ELECTROPHORETIC STUDY OF HUMAN GLOBIN 27
Fig. 11. Comparison of a-, R- and ; -polypeptide Chains Obtained from Human Adult and Fetal Globins using Cellulose
Acetate Membrane Electrophoresis
Veronal buffer: ,u=0.045, Urea 6M, 0.5 mA/cm, 30 min
![Fig. 10. Relationship between pH in Electrophoretic Verona]](https://thumb-ap.123doks.com/thumbv2/123deta/10140093.1973963/15.766.160.612.96.697/fig-relationship-ph-electrophoretic-verona.webp)