論 文
出生率変動と家族政策
丸尾 直美・荘 発盛
Total Fertility Rate and Family Policy
MARUO, Naomi CHONG
, Fatt Seng
Abstract
In the industrial stage of economic development, when the female labour force partici-pation rate increases, the total fertility rate (TFR) tends to decrease. In the case of Japan, the total fertility rate (TFR) peaked at 4.4 after the Second World War. Since then, the TFR followed a declining trend and it reached a record low point at 1.26 in 2005 (Chart
1 in the Japanese text).
It is not only Japan but also in most industrial countries that the TFR has followed a declining trend at least for a certain period. However, when female participation in the la-bour market and the existence of dual breadwinners become seen as normal phenomena, there is a good possibility that the TFR will begin to recover. “The Nordic combination of high levels of female labour force participation with relatively high levels of fertility, may suggest that a sustainable level of fertility is compatible with gender equality. In Ja-pan and Korea in Asia, and in Germany, Italy, Spain and the former communist countries in Europe, the TFR has remained at a low level, while in the Nordic countries, in the US, France and UK the movement of the TFR has changed from a decreasing trend to an up-ward trend.
This paper sets out to explain the main possible reasons that make it possible to divide highly industrial countries into two groups, namely, the low TFR countries and the coun-tries that have succeeded in recovering or in keeping the TFR at a fairly high level.
Chart 1 U-shaped Curve of TFR
However, the U-shaped behaviour shown above does not take place automatically. We have assumed that there are three main possible reasons to explain the change in the trend of TFR behaviour and the difference in the TFR between the lowest TFR countries and the relatively higher TFR countries among the industrialized countries.
The first reason to explain the U-shaped behaviour is that of changes in “the traditional status relationships” and in conservative attitudes and practices aimed at maintaining these relationships. In particular, it is essential to change the differential treatment of fe-male workers and that of fe-male workers. Changing differential status relationships be-tween regular employees and part-time employees is also important.
If the changes mentioned above do not take places, the increase in the female labour participation rate or the ratio of female employees to total employees will probably entail a decline in the TFR. We assume that the conflict between increasing female participation in the labour market and unchanging conservative status relationships will bring about a decreasing TFR and that renovations in conservative status relationships have positive ef-fects on the TFR and that the reforms in conservative status relationship will have posi-tive effects on the TFR.
Secondly, we have assumed that active family policies have positive effects on the TFR, other things being equal.
Thirdly, favourable economic performance such as higher economic growth, lower un-employment rate and bright economic prospects in future will have favourable effects on the TFR, other things being equal.
In this paper, we suggest that it is possible to predict the TFR in the near future by ob-serving the behavior of the “marginal” fertility ratio (the difference of TFR between the year and that of the preceding year), for marginal ratio precedes the average ratio as Chart 2 in the case of Japan suggests.
In the last section of this paper we will try to show the data to support the above hy-pothesis, especially from the cases of high GDP per capita countries and the cases of the developing countries in Southeast Asia.
In 2009 Myrskylä、Mokko, Hans-Peter Kohler Francesko& C. Billari published a pa-per “Advances in development reverse fertility declines” Nature, August 2009. They sug-gest that including developing countries a reversed J shaped curve will be observed. Their paper in 2009 is more comprehensive including less developed countries and used more comprehensive indicators than Maruo’ papers in 2006. However, their findings suggest as far as highly developed countries are concerned the V shaped behavior is observed.
要 約
1.
はじめに
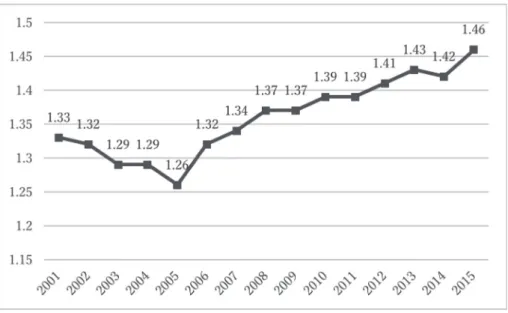
日本経済は1990年代から低成長に悩まされている。先進国経済になったのだから当然ともいえ るが、先進工業国の中でも出生率と生産年齢人口の低下傾向が低いことが経済成長率の主要原因 であるという点では OECD 諸国の中でも幾分、特異である。「実質経済長率≒一人当たり実質所 得の増加率+人口増加率」だから、人口減少過程で経済成長率が鈍化するのは当然ではあるが、 人口維持のためにも、一人当たり実質所得増加率を持続的に維持するためにも出生率の維持は重 要である。日本の合計特殊出生率(total fertility rate, 以下 TFR と略)は1970年頃から2005年まで趨勢的に 低下した。その後、2006年から8年間、微増に止まった年もあったが2013年まで連続して上昇し た(図表1参照)。2014年の TFR は、TFR が上昇趨勢に転じた2006年以降としては、初めて前年 より低下して、1.42となり、2013年の1.45をわずかに下回ったが、2015年にはTFRが1.46となり、 上昇趨勢に戻り、2016年のTFRも微増が期待された。そのTFRの動きを左右する要因は何か。 かつては TFR 低下の理由として女性就業の普及が指摘されたことがあるが、女性就業率の高 い北欧などの TFR が高いことなどから、女性就業の普及を TFR 低下の原因とする説は、最先進 国に関してはなくなった。とはいえ、女性就業と子育てを両立させる政策が発達しないと、低い TFRの一因となる。 また日本での2014年の TFR 低下の一つの理由として出産年齢人口の高齢化が挙げられている が、出生率に影響する家族政策支出が2012年と2013年に低下したことも原因の一つと推定される (後述)。 本稿では第一に、TFR 変動の要因を明らかにすること、第 2に、TFR が経済発展の過程で U 字 ないしV字型の趨勢変動をすることを示してその原因を示唆すること、第3にTFRの上昇に効果 のある政策を示唆してその根拠を示すことを主たる目的とするものである。 ると、合計特殊出生率は、一人当たり GDP が高い国ほど低いと見られるが、時系列 で見た場合、経済発展がある成熟段階に達すると、一人当たり GDP が高くなるにつ れ、合計特殊出生率がU字型に回復する傾向がある。合計特殊出生率の低下を経験し てきた一人当たり GDP の高い国及び地域、そして発展途上にある東南アジアと比較 し、その原因についても考察する。 キーワード
合計特殊出生率(Total Fertility Rate) 一人当たり GDP(GDP per capita)
家族政策(Family Policy) 子育て支援(Child Care Support)
図表 1 (a) 合計特殊出生率と家族政策給付費の対国民所得比(日本)
(出所)国立社会保障・人口問題研究所『平成25年度社会保障費用統計』の資料より作成
図表 1 (b) 2001年〜2015年までの合計特殊出生率(日本)
先のTFRに関する図表1は日本の場合も、限界TFRの趨勢変動がTFRの趨勢変動に10年ほど先 行していることを示している。TFRのU字型時系列変動はある国の時系列データで観測されるだ けでなく、先進主要国のクロス・セクション・データでも観測される (Naomi Maruo, December 2006;丸尾直美、2007年3月)ことを2006年12月刊の英文論文他で発表した。TFRが経済発展の 成熟段階で一度低下して、その数年後、TFRがU字型に上昇することは2009年8月にNature誌に 掲載されたM.ミルスキレ(Myrskylä、Mikko)等による論文で世界的に広く知られるようになっ た。ただ、ミルスキレ等は先進工業国だけでなく TFR が非常に高い発展途上国をも対象として いるので、U 字型曲線でなく、逆 J 字型曲線になっているが、工業化国だけについてみれば U 字 型であり、TFR曲線が先進国の場合、経済発展のある段階で V字型ないしU字型になり、発展途 上国を含めれば逆J字型に趨勢変動することは国際的にも認知されつつある現象である(M.ミル スキレ等の論文では、経済発展段階の指標として包括的な社会指標を用いているが、発展途上国 も対象とする場合は一人当たり GDP の信憑性が乏しいので、包括的指社会指標のほうが適する かも知れない。横軸に一人当たり GDP を、縦軸に TFR を取って発展途上国を含む諸国の一人当 たり GDPをとっても、図表4のように、逆 J 字型曲線が描ける。筆者の一人(丸尾)の TFRの U 字型曲線の仮説は、かなり先進国段階に達した国に関するものであるが、発展途上国を含むTFR の逆 J 字型曲線仮説は発展途上国を含むより一般的なものであるといえる。横軸に一人当たり GDP(米ドル換算)を取り、縦軸に TFR を取って統計が得られる世界の国々を取って図示する と、図表5のようになる。横軸に一人当たりGDPを取ると、石油産国など経済発展段階は低くて も、一人当たり GDP の高い国が含まれる。イラク、オマン、ガボンなどの石油産出国は経済発 展段階が低開発段階であるが、一人当たりGDPが高いので、逆J字型曲線から乖離する。スイス、 ルクセンブルグ、シンガポール、マカオなどは一人当たり GDP が高いのに出生率が北欧、フラ ンス、アメリカのように高くないのは国土面積が狭いことも影響しているものと推定される。 図表 4 世界各国の一人当たり GDP(2015年)と TFR の関係
6.
東南アジアにおけるTFRの動き
経済発展が成熟段階に達する段階までは、TFRも死亡率も高い水準にあるが、経済が成熟段階 に達すると、TFRが低下する段階を迎える。しかし、経済発展段階がさらに進み、TFRが人口減 少をもたらす2.0以下になると、やがて人口維持に必要な2.0に近づく傾向がある。ただ例外はあ る。 本稿で取り上げるシンガポールは一人当たりGDPでは最先進国並みになったが、TFRは1前後 で低水準である(1)。経済発展段階から見れば、少し前の日本の状態であり、日本の TFR が下が っていた段階と推定される。シンガポールは国土が狭いうえ、移入民が多いことも低TFR の一 因であろう。筆者の一人である荘はシンガポール、マレーシア等東南アジアの事情に詳しいの で、これらの国のTFRの考察を試みた。 東南アジアにおける TFR は、世界の推移と同様に低下して来た。世界銀行の発表した資料に よれば、特に2015年において、人口維持に必要な2.0を下回った国は、ベトナム(1.96)、マレー シア(1.93)、ブルネオ(1.86)、タイ(1.50)、シンガポール(1.24) である(図表5)(2)。 ( 1 ) その他、台湾、香港とマカオのケースも同様に言える。 ( 2 ) 本論文は、合計特殊出生率と一人当たり GDP との関係を考察するのに、より正確な比較をするため、両方 のデータはともに世界銀行が公表した資料に基づいている。 図表 5 東南アジア TFR2.0を下回った 5 カ国の推移ン・ショックの直前の2007年まで、たった数年間で一人当たりGDPは約30%近く成長し、6万8 千ドルまで跳ね上がった。TFRも実はこの間、ずっと上昇し続け、1.29まで回復していた。とこ ろが、リーマン・ショック発生後、一人当たり GDP がマイナス成長になり、TFR も低下傾向に 転落し、その後2010年に一人当たり GDP は成長の軌道に戻っても、TFR はすぐに回復せず、史 上最低の1.15まで低下した。このことから、シンガポールの国民は、リーマン・ショックに対し て、しばらくの間、相当な不安が残っていた結果であると言えるかも知らない。しかし、リーマ ン・ショックから回復し、安定した経済成長が続くと、2011年から2015年にかけて、TFRは基本 的に回復基調に戻った。つまり、一人当たり GDP が著しく上昇していても、一人当たり GDP と TFRとの逆の関係は見られなくなり、むしろその逆である。このことから、下記のように二つの ことが示唆されていると言える。 一つは、前述のように、経済発展が一定の水準までに達すると、人口を維持するには、必要な 2.0に近づく傾向がある。国によってちょっとずつ違うが、シンガポールのように、一人当たり GDPが相当高い水準に達し、そして相当低い TFR になってから、ようやく TFR が落ち着き、そ 図表 6 シンガポールの合計特殊出生率と一人当たり GDP
くなるであろう。 一人当たり GDP の持続的な成長を維持していくために、労働生産性を上げ続けるのは一つ有 効な方法であるが、それはどのような状況であろうか。技術進歩はもちろん大切であるが、労働 市場において、高い失業率の場合、労働生産性が上がりにくいと考えられる。なぜなら、せっか くの技術進歩が実現しても、失業者が増加した場合、労働者の賃金が逆に下落する可能性もある からである。逆に人手不足の場合、賃金の上昇により、労働生産性が上がるという結果につなが るとも考えられる。 人手不足が所得の上昇をもたらす理由は、一つ、前述のように、マクロ的に見て総需要が総供 給を上回るので、インフレ・ギャップが起き、労働市場においても需給の関係で人手不足にな る。結果的に賃金が上昇する圧力がかかり、労働所得が上がるのが普通である(8)。もう一つは、 必要に迫られて、技術革新が起きやすくなり、人工知能(AI)などの機械化が進むことにより、 社会全体の生産性が上がることにより、一人当たり GDP の成長につながる。シンガポールは現 在、人手不足問題を解消するために、外国人労働者に頼っていると知られているが、意外と知ら れていないのは、シンガポールは様々な分野で、人口知能(AI)及び無人機械化サービスなど がかなり進んでいることである。人手不足の問題は、少子化対策に頼るのは限界があり、こうし た画期的な対策に切り替え始めているのである。 厳密に言うと、人工知能と労働の関係は、補完的か代替的かを見極める必要がある。一般的 に、人工知能又は機械化は、労働が代替されてしまうと考えられがちであるが、人手不足の状況 においては、どちらも社会的に見て望ましいのである。なぜなら、人手不足の場合、人工知能や ( 8 ) もちろん、価格の下方硬直性により、企業は一度賃金を上げると景気悪化の時に下げにくいと懸念するの で、人手不足であっても、安易に賃金を上げないという上方硬直性の可能性もあるが、ここでは、そのよ うな議論は割愛する。 図表 7 変化率で見たシンガポールの合計特殊出生率と一人当たり GDP
機械化は、労働と代替関係にあれば、人手不足の状態の解消につながり、労働と補完関係にあれ ば、労働生産性が上がることにより、所得が増えることにつながるからである。 これは、今日の日本の状況にもよく当てはまっている。日本の少子高齢化は、やがて深刻な人 手不足が発生し(9)、やがて労働生産性が上がり、一人当たり GDP が上昇し、最終的に子供の出 産が増え、合計特殊出生率が回復すると言う好循環になると考えられる。 実際、少子高齢化が問題視されている一つの理由は、人口の減少で需要不足で消費が減少し、 経済が後退すると見られていることである。しかし、この見方自体はいくつかの問題点がある。 一つは、少子化による人手不足(10)と消費の減少は相対的に見るべきである。日本の場合を例え ると、政府の消費支出も含めた日本全体の消費支出(11)は減っていると言えない。これは当然と 言えば当然である、人口減は毎年30万人とは言え、全人口の割合で考えると、0.2%ぐらいであ り、消費は劇的な減少はむしろ考えにくいのである。しかも高齢者数の増加がもたらす社会保障 などの支出の増大で、日本全体の支出はこれからむしろ増加する可能性もある。その中で、人手 不足の問題がそれに先立って起きるとどうなるかと言うと、先ほどすでに述べたように、最終的 に労働生産性の上昇により、少なくとも一人当たりの所得の上昇がもたらされるのである。 実は、日本においても、2007年以降、この現象が起き始めている可能性がある。図表8は、日 本における2007年以降の一人当たりGDP成長率のTFRの変化率を表している。 ( 9 ) 実際、日本において人手不足の問題はすでに顕著に現れている。ヤマト宅急便のケースのように、値上げ から、賃上げ、人員確保、そしてロボット化などの対策はすでに始められている。 (10) 外国人労働者の受け入れはとりあえず考慮しない。 (11) 政府の消費支出は主に高齢者のための社会保障費などの部分が大きく、しかも高齢者数の増加で、支出が 年々増加している。民間最終消費支出と政府最終消費支出の状況は付録で参照されたい。 図表 8 変化率で見た日本の合計特殊出生率と一人当たり GDP(2007年以降) 2007 2008 2009 2010 2011 2012 2013 2014 2015
出所:世界銀行 (The World Bank)の資料に基づいて作成 出所:世界銀行 (The World Bank)の資料に基づいて作成
出所:世界銀行 (The World Bank)の資料に基づいて作成
参考・引用文献 大渕寛教授古希記念論文集(2007年3月)中央大学経済学研究会。 勝俣幸子(2005年3月)「子育て世帯に対する社会保障給付の現状と国際比較」 『子育て世帯の社会保障』 (編) 国立社会保障・人口問題研究所編 国立社会保障・人口問題研究所 pp.53-81。 谷沢英夫著『スウェーデンの少子化対策』(2012年)、日本評論社。 丸尾直美(2007年3月)「次世代育成の福祉政策---出生率変動要因とU字型趨勢仮説」 中央大学『大渕寛 教授古希記念論文集』 中央大学経済学研究所。 丸尾直美(2008年6月)「日本における出生率の U 字型回復の可能性と有効な施策」『尚美学園大学総合 政策論集』。 丸尾直美(1993年)『総合政策論』有斐閣。
Esping-Andersen,G,ed.(2002)Why We Need a New Welfare State? Oxford University Press. Esping-Andersen, (2009), Incomplete Competetion, Polity
Esping-Andersen, G (1990), The Three Worlds of Welfare Capitalism, Polity Press. Harris, Fred.R. ed. (2006), The Baby Bust, Roman & Little Field.
Lundqvist,Åsa (2011), Family Policy Poradoxes---Gender equality and labour market regulation in Sweden 1930~2010, Policy Prss. Co. UK.
Maruo, Naomi (December 2006),“Eertility and Family Policy---A Hypothesis on the U-Curve Behabiour of the Total Fertility Rate---”Shobi Journal of Policy Studies.
Maruo, Naomi, Andre Björklund and Karl le Grand (2005), Welfare Policy and Labour Markets, Almqvist International.
Myrskylä、Mokko, Hans-Peter Kohler &Francesko, C. Billari “Advances in development reverse fertility declines” Nature ,August 2009.
Reference
Maruo, Naomi, Andre Björklund and Karl le Grand (2005), Welfare Policy and Labour Markets, Almqvist International.
Bradshaw, Jonathan and Aksel Hatland (2006), Social Policy, Employment and Family Change in Comparative Per-spective, Edward Elgar.
Chesnai, J. (1998),“Below Replacement Fertility in the European Union, Review of Population and Social Policy: Facts and Policies, 1960−1997”, No.7.
Douglass, Carrie B. (2005), Barren States: Population “Implosion” in Europe, Berg.
Mósesdóttir, Lilja (2001), The Interplay between Gender, Markets and the State in Sweden, Germany and the Unit-ed States, Ashgate.