Examining the effects on underground water levels of a subterranean construction using a 3D management model for underground water in Kyoto‑City, Japan.
著者 Kitaoka Takafumi, Kusumi Harushige journal or
publication title
Proceeding of EIT‑JSCE Symposium on
Engineering for Geo‑Hazards:Earthquakes and Landslides‑for Surface and Subsurface
Structures
year 2010‑09‑06
URL http://hdl.handle.net/10112/5635
Examining the effects on underground water levels of a subterranean construction using a 3D management model for underground water in Kyoto-City, Japan.
Takafumi Kitaoka
1and Harushige Kusumi
21Graduate school of Kansai University E-mail: [email protected]
2 Dept. of Civil and Environment Engineering, Kansai University E-mail: [email protected]
ABSTRACT: Kyoto city has various traditional cultures and industries. One of these is the production of Japanese sake, for which Fushimi-Ward is famous. This area has a lot of underground water of good water quality suited to making Japanese sake, and consequently. However, the new construction of a combined sewer system was started 3 years ago in Fushimi-Ward. The purpose of our study is to establish a 3D management model for underground water and examining the influence of the subterranean construction on the surrounding underground water level. The underground water of the Fushimi area has been protected by the Fushimi sake brewing union. They protect underground water from various potentially harmful construction projects. We believe that this management model will be useful in predicting the effects of the underground water levels. And, it is recognized that in the context of this model the new sewer does not cause adverse effects on underground water levels. We have to protect the underground water in the Fushimi area and in order to protect traditional Japanese sake.
1. INTRODUCTION
Fushimi-Ward located in the south of Kyoto-City is composed of the plains part along three rivers, the Higashiyama mountain range with the southern end of Momoyama hill. The underground water of Fushimi is traditional industry, and the abundant underground water has been used for a long time.
However, the new construction of a combined sewer system was started 3 years ago. The purpose of our study is to establish a 3D management model for underground water and examining the influence of the subterranean construction on the surrounding underground water levels. Finally, we will analyze the effect of underground water levels on brewery company wells.
2. GEOLOGICAL CONDITIONS IN FUSHIMI
Kyoto basin is surrounded by mountains formed by a bowl shaped depression in the paleozoic strata and granite. The paleozoic strata basin rock is an impermeable bed upon which there is a permeable, diluvial layer and then alluvial layer. In the strata of
the Kyoto basin, in the majority of areas a gravel layer can be seen. The area above this is covered by fine-grained soil. The N-value of the gravel layer is, as a rule, greater than 50. In the geological structure of the subject area a gravel layer corresponding to the diluvial layer has build up. This is covered by an alluvial layer of a depth of approximately 10 meters. Fig1 shows the strata of the Fushimi-Ward.1)
Fig1. Geological map on the Fushimi
3. WATER LEVELS IN FUSHIMI
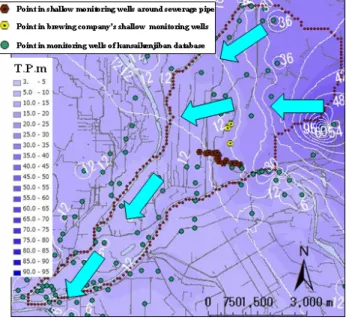
Fig2 shows the expansion of the area around Fushimi Brewery Union. The position of the monitoring wells in the present study is recorded.
We set up 18 monitoring wells in the part where the shield passes. Moreover, we borrow each brewing company's monitoring wells, and set the water meter in 9 places. The water level data is obtained from the 27 monitoring wells in total. We compared the observed underground water head with the underground water head obtained by the analytical result, and examined the validity of the stratum we made. Moreover, we made the water level contour chart from the result of these underground water heads of only shallow wells, and forecasted roughly how the underground water flows. Fig3 shows the underground water flows toward the part where three rivers in the southwest are joined from the Momoyama hill part in northeast.
4. A STRATUM OF MODEL
(1)Outline of a stratum of model
We understood geological composition in a region concerned by arranging the data of the topographic map and “Kansaiken Jiban Jouhou Database in 2009”2) which has a lot of geological data. We studied the shallow aquifer of about 30m from the ground level where the shield passes. Fig4 shows the conceptual diagram of the model in the region concerned. We divided it into 3 layers based on the classification by geological features and the according to N value.
(2)Range of analytical object
Fig5 shows the range of modeling that is the researched in the study. We decided that analysis range would be the area of about 9000m from the east to the west and about 10000m from the south to north. The borders of the model are set based on the three rivers Kamo, Katsura and Uji and the groundwater divide. The surface area is approximately 28 square kilometers.
Fig3. Water head contour map
Fig2. Location of monitoring wells Fig5. Model range
Fig4. Conceptual diagram of the model
(3)The layer thickness
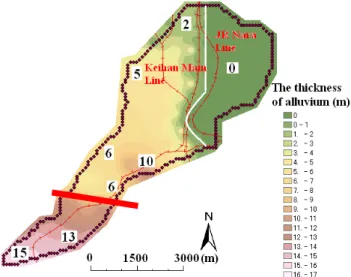
The layer thickness of the alluvial layer is shown in figure6 according to the contour data. The layer thickness is roughly shown by the figure at the point. The thickness of the alluvium disappears from the white line along the railway track between Keihan Main Line and the JR Nara Line in the Fushimi-Ward northern part toward the Momoyama hill in the east. The alluvial layer is thick in the part where three rivers located in the southern part of Fushimi-Ward are joined. It is about 15m in the thickest part. The results of a drilling survey showed that within the alluvial layer, in the northern side of the subject area the proportion of silt and clay constituents is greater, while in the southern side the proportion of sand constituents is greater. For this reason, the analytical stratum model has four materials. Where the red line is on the diagram the material of the alluvium changes between the north and south side.
Fig7 shows the layer thickness distribution in the diluvium (gravel) layer. The layer thickness is thick in the part where the shield passes. Moreover, the layer in the area with the Momoyama hill in the northern part of Fushimi-Ward is raised, while going to the east part. Based on T.P.-20m, we set a diluvium (clay) layer at the bottom of the model under the alluvium and the diluvium (gravel) layer.
About 400 boring data was used to understand the geological features in the analyzed region.
(4)Mesh model
The analysis method used is FEM. Therefore, the subject area is divided into limited components.
Fig8 shows the mesh model chart. The mesh was made in most detail in areas where sewerage pipes extend in order to examine the water movements in those areas. The part enclosed by red shows the part where the shield chiefly passes. The profile of the sewerage pipes to be laid in the subject region is 3.5 meters. Accordingly, to make the mesh smaller than the sewerage pipes we set to 1.5 meters, less than half the diameter of the pipe. Moving away from the sewerage pipes the mesh size was increased to 3, 12.5, 25 and then 50 meters. Setting the maximum mesh size to 100 meters, we partitioned the expansive subject area. The size of the mesh in a perpendicular direction, minimum is about 50cm, and maximum is about 20m. The number of nodes of analytical meshes is 110872, and the number of elements is 109402.
Fig7. Diluvial layer thickness Fig6. Alluvial layer thickness
Fig8. Mesh model
(5)Completed model chart
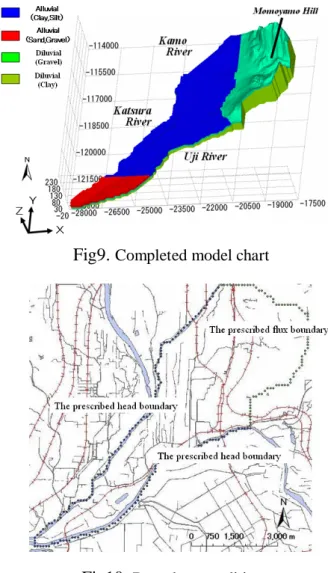
Fig9 shows the completed model chart. A perpendicular direction is displayed at ten times magnification. Within the upper strata of the plains area, an alluvium with different soil qualities between the north and south has accumulated.
Beneath this, a diluviual gravel layer has accumulated. On the surface of the plains area this is covered by the alluvium. However, in the mountains the diluvial gravel layer appears on the surface. Accordingly, we are able to confirm that we are re-creating the soil structure seen in the bore data.
6. SEEPAGE FLOW ANALYSIS
(1)Boundary condition
Fig10 shows the boundary condition. The boundary of the model is set referring to the topographic map of three rivers and divides. The three rivers, analysis were performed with underground water levels from the data base of the Ministry of Land, Infrastructure and Transport managed as the prescribed head boundary. In the northeastern groundwater divide, analysis was performed with underground water levels from the Kansaiken Jiban Jouhou Database as the prescribed head boundary. As a result, as deduced from the water-head contour map, in-flows were seen in the groundwater divide. However, the water level in the hilly region was several tens of meters lower that the figures from the Kansaiken Jiban Jouhou Database. Accordingly, in the groundwater divide boundary condition as the prescribed flux condition, we set the flow rate values obtained from the analysis results using the prescribed head boundary.
Then, as part of the hydrological balance we added the rainfall of the area to the nodes specifying the mountain and hill regions from the Arc-GIS high- resolution numerical data (10m-mesh land-use) and, to this we added the inflow amounts from the groundwater divides and re-performed the analysis.
(2)Ground physicality parameter
We set a general value as the ground physicality parameters used in this analysis according to the reference literature etc. It is shown in Table1. The coefficient of permeability greatly influences the analytical result. Therefore, considering values from in-situ permeability tests, we determined a coefficient where the underground water level values from the analysis and from measurements correspond most.
Fig9.
Completed model chartFig10.
Boundary conditionsTable1.
Ground physicality parameter3)(3)Result of seepage flow analysis
The vector of the velocity of the underground water is shown in figure11. This flow velocity vector shows the point of T.P.0m. The flow velocity vector of the underground water of each element was shown and the overall flow was shown by a macro vector. Red vector degree flow velocity is fast, and blue vector degree flow velocity is slow.
Flow velocity in northeastern is shown by a blue vector because the flow velocity of the diluvium (clay) is shown. The part shown by a red vector shows the flow velocity of the diluvium (gravel) layer, the flows are faster than diluvium (clay) layers. Roughly speaking, the underground water flows toward the part where three rivers joined from a northeastern hilly district. The comparison of the water head contour charts obtained from the analysis model and contour chart obtained from the result of the survey of figure12 tells us that we can reproduce roughly how the underground water flows.
(4) Validation of the model
As our model covers a shallow layer, we were able to examine it by checking if it matches the water levels from shallow wells. To examine the model, fig14 shows the water head data of the various points of the model is compared by using the water head data of shallow monitoring wells obtained from the brewing company and that of shallow monitoring wells from near the new sewerage pipe. In order to examine the entire subject area, we used underground water level data from the Kansaiken Jiban Jouhou Database in places we were unable to obtain our own measurements. Most results show the error margin of about 3m. Therefore, overall it is a good result.
Furthermore, in the area the sewerage pipes will be established, there is an overall 1m error margin in the underground water levels of the analysis results.
Fig14.
Comparison between values measured and the predictions of the analysisFig13.
Location ofValidation’ wells Fig12.
Underground water contour lineFig11.
Underground water flow vector7. SEEPAGE FLOW ANALYSIS CONCERNING SUBTERRANEAN CONSTRUCTION
(1)Outline of a subterranean construction
The underground structure to be established is a sewerage pipe for the improvement of the combined sewerage system in Fushimi-Ward. The combined sewer system is located approximately 15m underground. A trunk-line with an internal diameter of φ3000mm and a southern trunk-line with an internal diameter of φ1800mm will be laid along Otesuj and Otesujiminami road. The length of the combined sewer system tubes is approximately 1600m. The construction will be performed using the tunneling shield method normally utilized in laying new sewerage trunk lines. In this method a cylindrical boring machine (TBM) is sent of from a vertical shaft established in the construction area to make the tunnel. 4)(2)Effect on underground water levels of surrounding after sewerage pipes is reproduced
In our analysis, we reproduce an underground structure by accurately eliminating elements from parts of the concerned area where the sewerage pipes will be laid. In the analysis we exclude elements in the positions T.P.-3m~T.P.0.5m. The sewerage pipes size is 3.5m. Furthermore, in the analysis the effect on underground water flows in the case that an even larger subterranean construction was established is examined. In the analysis we exclude elements in the positions T.P.- 3m~T.P.7m. The subterranean construction size is 10m. The analytical result in the part enclosed by the square is shown as one example in figure15.
Fig16 shows the results of a seepage flow analysis of a 3.5m underground object are given. As shown on the diagram, while slight the underground water flows avoid the sewerage pipes and flow around it. Therefore the effect on underground water flows is estimated to be slight.
Fig17 shows the results of a seepage flow analysis of a 10m underground object are given. It can be seen that the effect on underground water movements of establishing a 10m underground structure is greater than that of establishing a 3.5m underground sewerage pipes. Accordingly, we can predict that underground water levels upstream and downstream of the sewerage pipes would change.
Next, we show the effects an underground structure of each size would have on the water levels around the sewerage pipes and subterranean construction by 4 graphs.
Fig15. Point in analytic result concerning subterranean construction as an example
Fig17. Influence on underground stream movement subterranean construction of 10m causes Fig16. Influence on underground stream
movement sewerage pipe of 3.5m causes
Fig18 shows the influence of underground water level on north side. This graph shows the influence on upstream water levels. Considering the influence on water levels in the case of a 3.5m sewerage pipes, from the graph, according to the analysis, it will be minimal. However, if a 10m underground structure where established, it would effect surrounding water levels. A rise of 4.4cm is seen when examining the effect on water levels 100m upstream of subterranean construction. From this trend it can be deduced that moving away form the point where the pipe will be laid the effects decrease.
Fig19 shows the influence of underground water level on south side. This graph shows the influence on downstream water levels. Considering the influence on water levels in the case of a 3.5m sewerage pipes, from the graph, according to the analysis, it will be minimal. However, if a 10m underground structure where established, it would effect surrounding water levels. A lower of 2.9cm is seen when examining the effect on water levels 100m downstream of the subterranean construction.
From this trend it can be deduced that moving away form the point where the pipe will be laid the effects decrease.
Fig20 shows the influence of underground water level on east side. This graph shows the influence on upstream water levels. Considering the influence on water levels in the case of a 3.5m sewerage pipe, from the graph, according to the analysis, it will be minimal. However, if a 10m underground structure where established, it would effect surrounding water levels. As the influence on the underground water level is different from the north to the south, moving away from the subterranean construction the water does not appear to settle. Since the underground water flows from the north-east to the south-west, we think there is an effect from the sewerage pipes laid in Otesujiminami road.
Fig21 shows the influence of underground water level on west side. This graph shows the influence on downstream water levels at a north point.
Considering the influence on water levels in the case of a 3.5m sewerage pipe, from the graph, according to the analysis, it will be minimal.
However, if a 10m underground structure where established, it would effect surrounding water levels.
As the influence on the underground water level is different from the north to the south, moving away from the subterranean construction the water does not appear to settle. Since the underground water flows from the north-east to the south-west, we think there is an effect from the sewerage pipes laid in Otesuji road.
Fig18.
Influence of underground water on North sideInfluence of groundwater level on North side
10.2 10.3 10.4 10.5
96m 71m 46m 21m 9m 5m
Distance with underground structure(m)
Underground water level(T.P.m)
Underground structure none Underground structure of 3m Underground structure of 10m
Influence of groundwater level on South side
9.85 9.95 10.05 10.15
3m 13m 26m 51m 76m 101m
Distance with underground structure(m)
Underground water level(T.P.m)
Underground structure none Underground structure of 3m Underground structure of 10m
Fig19.
Influence of underground water on South sideInfluence of groundwater level on East side
9.95 10.05 10.15 10.25
4.8m 9.5m 22m 47m 72m 97m
Distance with underground structure(m)
Underground water level(T.P.m)
Underground structure none Underground structure of 3m Underground structure of 10m
Fig21.
Influence of underground water on West sideFig20.
Influence of underground water on East sideInfluence of groundwater level on West side
9.9 10 10.1 10.2
100m 75m 50m 25m 12.5m 6.2m 3.1m
Distance with underground structure(m)
Underground water level(T.P.m)
Underground structure none Underground structure of 3m Underground structure of 10m
(3)Influence of underground water levels on brewery company wells
Fig22 shows the location of pumping wells used by each brewery for mainly sake-brewing. There are 42 brewery pumping wells in Fushimi. The effect of the 3.5 meter sewerage pipe on the underground water levels that would extend to the brewery pumping wells is minimal. Accordingly, using the analysis results we examine the effect on pumping wells, in the case that a 10 meter subterranean construction is laid. There are up to 17 pumping wells presumed to effect the underground water level by 1cm. Therefore, the influence that the laying of sewerage pipes will have on the surrounding pumping wells water level is, even in the case of a 10m underground structure, larger than the planned pipe, not greater than several centimeters. From the analysis results it was determined that the effect laying sewerage pipes would have on the underground water level, that would extend to the brewery wells was insignificant.
7. SUMMARY
Since 2007 in the proximity of the Fushimi Brewers Union, where brewers are heavily concentrated, in order to improve the combined sewerage system new sewerage pipes have been constructed. The finding in the present stage obtained in the present study is shown follows.
We figured out the stratum characteristic in the analyzed region from the boring data, and organized them. Three dimensional ground model was made from these. The underground water movement was analyzed from the made stratum model, and a rough flow of the underground water movement was reproduced. From the analysis results it was determined that the effect laying sewerage pipes would have on the underground water level, that would extend to the brewery wells was insignificant.
The final purpose of the present study is to consider the behavior of the polluter when the velocity of the underground water changes or the pollution arises along with the subterranean construction in Fushimi district where brewing companies with good quality underground water concentrates. In areas making extensive use of underground water in order to respond rapidly in the event of problems such as underground water pollution it is important to understand the behavior of underground water flows. It is thought that the construction of analytical strata models in the Fushimi area will assist these judgements.
REFFERNECES
1) New Kansai Ground (2002), Proc. of Geo-Database Information Committee in Kansai., pp.13-54.
2) Kansai Ground Information Database CD-ROM (2009), Proc. of Geo-Database Information Committee in Kansai.
3) Karlheinz, S., Joanna, M. (2003): A practical guide to groundwater and solute transport modeling, Proc. of Gihoudo (in Japanese), pp.328-334.
4) Groundwater conservation plan <The public sewerage pipe of Otesuji road and Otesujiminami road> (2007), Proc. of Kyoto Waterworks Bureau, pp.1-17.
)