日本 管 理 会 計 学会誌
管 理 会 計 学20(n年 第13巻 第1・2号 (合 併 号 )
論 文
Estimating the maintenance and repair cost in Life Cycle Cost calculation :A case of automobile ownership in the U .S.
Vitoon Puripunyavanich Satoshi Myojo Yuichiro Kanazawa
Abstract
The maintenance and repair cost of dulable goodS has traditionally been hidden from consumers and yeI has been non −−negiigible p盆rt of Li fe Cycle Cosl (LCC )computation . PrediCting the maintenance and repair cost is diff三Gult because many of these dulable goods do not have constant fanure Tates . For some durable producIs such as aulo皿obiles , it is often the case that we have at藍east a rough idea as to their reliabi置ity. In
this study we propose and illustrate a method to convert automobile reliability data孟n the U .S.!o their monetary maintenanoe and repair cost. In our metho4 we firsl estimate a staI重stical modcl from the widely available reliability data. Then we predict the reliabi 玉ity from the [nodeL Finally we convert 重he predicted
reliability 10 cost figtlles. Tbe proposed statistical model takes care of the possible bias introduced by
partially missing reliability data. Conversion to cost figure is done on 1he twenty−six 1996−model −year
vehicles popular in Ihe U .S. during 1992−−1999,
K画yWords
Life Cycle Cost;Reliability of Aロtomobile;Nonignorable Nonresponse;Multinornial Logistic Regression Model
ラ イ フサ イ クル コ ス ト算 出における維 持お よび修理 費用 の推 定
ア メ リ カで の 自動車所有の 例
Vitoon Puripunyavanich 明 城 聡 金 澤雄一 郎
く論 文 趣 旨〉
これ まで耐 久消費 財の 維持お よ び 修 理にかか る 費 用に関 し ては, ラ イフサイ クル コ ス ト計算にお
いても無視でき ない費用であるにもか かわ らず消費者は あ ま り知らさ れ てこな かっ た.一定の故障 頻度を持たない多くの耐久 消 費 財につ いて そ の維持およ び修 理費用 を 推 定 すること は 困 難である.
しか しな が ら例 え ば自動 車のよ う な財につ いては, 少な くと もその信頼性に関 しては 大 ま かに で は あるが 情 報 を得ること がで きる 。そ こで本研究ではア メ リ カ自動車信頼性データ か ら維 持 ・修 理 費 用 を 算 出 方 法につ いて提 案 する .こ の 方 法では まず 広 く利用 可能な信頼性デ ータ か
ら統 計 的モデ
ル を推定する.そして モ デルか ら推定 さ れる 自動車の信頼 性か ら費用へ 変換 を行 う,こ こで用い る
統計的モ デル で は部 分的に欠損 して い る 信 頼 性 データ か ら起こ り うる偏 りの問 題に対処す ること を可能に して い る.具体 的な費用算出 例 と して 1996年モ デルイ ヤーにおい て人 気の あ
っ た26車種 を
取 り上げ た,
〈 キ ーワー ド〉
ライ フ サ イ クルコ ス ト, 自動 車 信頼 性, 無視で き ない非 応 答, 多項ロ ジステ ィ ッ ク回帰モ デ ル 2003年3月26日 受付
2004年3月30日 受理 筑 波 大 学
Submitted 26, March 2003. Accepted 30, March 2004. University of Tsukuba
NII-Electronic Library Service
Wmpftat7 ig13tsag1・2t (al#g)
1Introduction
The L`cost"
of a product forconsurners has traditionallybeen equated with itsprice at the time of
purchase,For some products, however,thisdefinitionof cost can bd quitemisleading. For example,
inthe case of many durablegoods,significant cost will be incurredinthe use and maintenance of the product over a period of years. LifeCycleCost (LCC),which includesall the costs associated with
acquisition, use, maintenance, and disposal,ismore reasonable alternativetoevaluate such products.
Consumersthemselves havebecome increasinglyaware of not only the cost of acquiring butthe cost associated with use, maintenance and disposalof the durableproducts.This awareness hasbeenpartially translatedintotheU,S,regulations. Forexample, the U.S.government,through the Energy Policyand
ConservationAct (EPCA)of 1975,hasbeen asking home appliance manufacturers todiscloseenergy
'
consumption on theirproducts(McNeillet al.1979,Hutton et ai. 1980).
The EPCA also included a "New Auto FuelEconomy Program,"inwhich Departmentof Ttansporta- tion(DOT) was directedtoset C`corporate average fueleconomy" standard fornew car starting inmodel
year1978,and fbrnew lighttrucks starting in1979.Eachautornaker was required tomeet the standard, subject to1arge finesfornon-compliance. The program put Environmental ProtectionAgency (EPA)
' '
incharge of measuring fueleconomy foreach model, of setting up NationalVehieleand FUelEmissions '
LaboratorytQdeterminecar manufacturers' compliance with federalemissions and fuel economy stan-
'
daTds.The prograrriasked Department of Energy (DOE)topublishthe IltielEconomy Guideas an aid toconsumgrs considering the purchaseofa new car, The Guide Iistsestimates of iniles pergallon(mpg)
foreach vehicle aMailable forthe new model year. These estimates have beenprovided by the EPA.
Of all durab!eproducts consurners purchase, automobile iswithout doubt themost expensive, Fbr
exarnple, according tothe U,S.Consumer ExpenditureSurveyin1998,expenditure on vehic]e purchases,
gasolineand motor oil and other vehicle expenses amounted to $6,358or 17.06% of average household
expenditure of $37,260,
Consumers tend tohave a pretty good ideaon acquisition cost of automobile beforethe time of
' '
purchase fromthe sticker priceand pricequetationservices frem such organizations as ConsumerUnion.
By lookingat the window-stickers and using the FUelEconomy Guide,consumers can and are expected
'
toroughly estimate the average yeaily fuel cost fot any vehicre,
'
ItisdiMcult,however,topredictrepair cest fora specific automobile becauseitvaries fromone modei
toanother and the average maintenance and repair cost, forexample, inthe U.S.ConsumerExpenditure
Survey,doesnot apply to the particularautomobile of consumer;s choice. Untilnow there hasbeen no regulation requiring Federal and Stategovernment oMce toestimate the repair cost of automobile.
There are state government regulations such as the Lemon Laws stipulating the manufacturers to
take some responsibility to the defectof the productthey manufactured. CaliforniaLemon Law - CA
'
CivilCode Section1793,22 (TannerConsumer ProtectionAct)isone such example. Althoughthe Lemon
Laws likethisone are protectingconsumers intheirfirstyearof car ownership throughoutthecountry, typlcalconsumers still haveat leastseven more yearstothink about the repair cost, because"the median
4
Estimating the malntenance and repair cost inLifeCycle Cost calculation :
-A case efautomobile ownership intheU.S.-
age of cars on the road in 1999ismore than 8 years, compared with 6} years in 1990" (April1999
Consumer Reportspage 97),Publiccan consult publications such as Consumer Reportsor can access to theirwebsite ferthefrequencyof repair of the specific make and model. Inthispaper we will propose
t t
'
and illustratea methed to convert that knowledgeofthe frequencyof repair to `:monetary repair cost."
'
'
Incurrent practice,rnaintenanee and repair cost of ageneralproduct isestimated thtough the usage
'
of databases and professionalopinions (Taylor!981). The reason forthisisthe factthat the repair cost
depends on maintainability and reliability parameters,While most electronic components are considered tohaveconstant failurerates (exponentialdistributions)-which coincidentally simplifies themathernatics
forcalculating the often used mean time befbrefailure(MTBF)and mean time to repair (MTTR),
reliabilitylmaintainability of non-electronic components havenon-constant failurerates and can leadto the unwary tointractablemathematics (Fricker1979,De Neumann 1983), Automobiles,as computerized
'
as they may be,havesignificant mechanical components. This makes itvery diMcult to ebtain theoretical model ofthe reliability and maintainability of autprnobiles, leavingus an only choice of statistical method
fortracingthem.
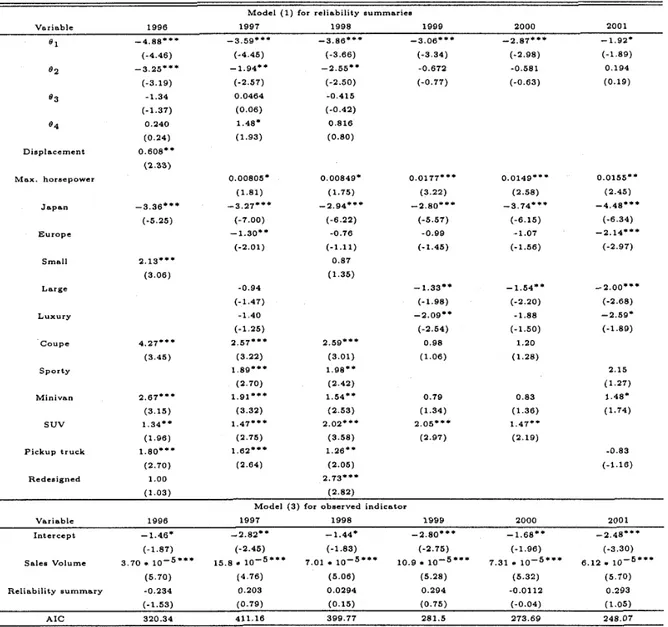
Our method isas follows:We firstestimate astatistical model regressing thereliability summariesi in fivepoint ordinal scale published inthe Consumer Reportson several designcharacteristics of automobile and several attributive dummy variables, We choose theseexplanatory variables becausetheyare easily aNailable tobuyersthinking of purchasinganew car. Then we predictthereliability score from thernodel,
Finallywe convert our predicted reliability score to cost figureusing the datafrotnseveral sources.
As an example, we estimate the vehicle-specific maintenance and repair costs inU,S.dollarsfor
twenty-six popular 1996-model-yearvehicles intheirfirsteight yearsof ownership. They are selected
fromthethirtybest-sellingpassengercars and the twenty best-sellingminivans, SUVs,and pickuptrucks inthe United Statesduring 1992-1999 and were consistently on the best-sellinglistthroughout the period.Sincethesepopularfiftyvehicles and theirsiblings covered 73.1% of all the vehicles sold in1996
and covered al]market segments-passenger car, minivan, SUV, and pickuptruck-important toaverage consumers, we believethe choice isrepresentative,
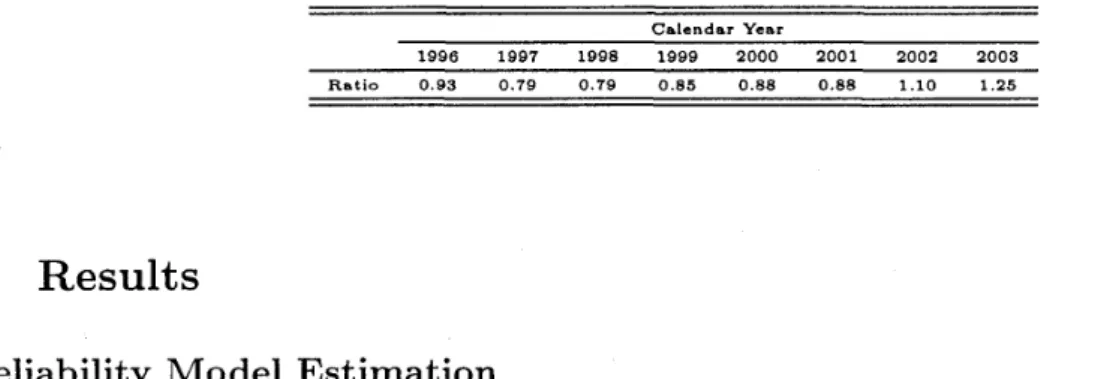
This paper isorganized as foIlows.The methods usecl inestimating the statistical model and con- verting the model into cost figureare describedinsection 2,Insection 3,the result ispresented, and in
section 4 we discussthe result. Appendix A exp]ains how we estimated the statistical model. Appendix
B descrlbesindetai1how we calculated the vehicle-specific ratio formaintenaiice and repair cost.
2Methods
Maintenance and repair cost bymodel and yearwere ingeneralnot available. What we haveinsteadare;
1,Yearly clataon average cost forautomobile maintenance and repair over alt consumers from the Consu7nerEupenditureSurveyi
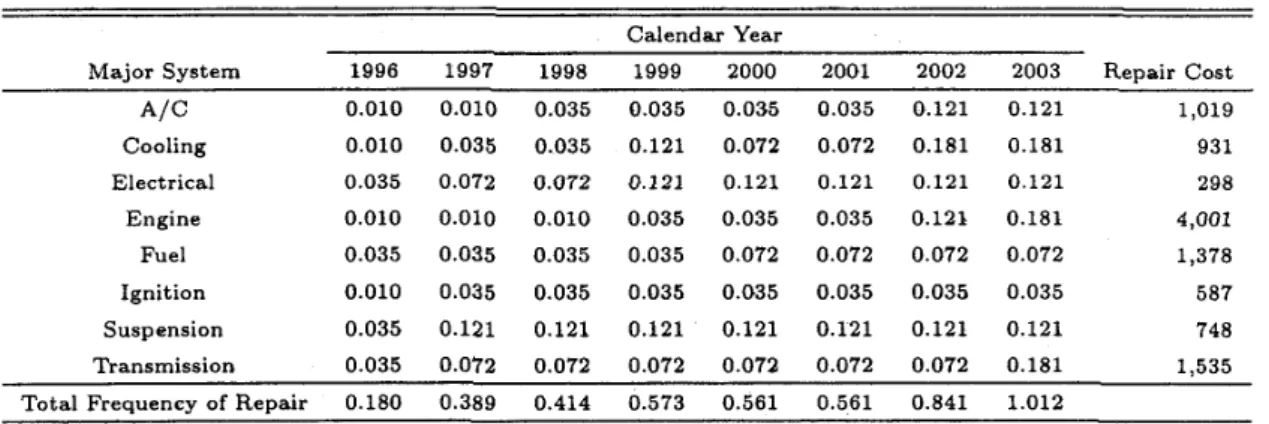
2.Estimatesof `CtypicaV' itemizedmaintenance and repair cost bymodel fbreight major mechanical
NII-Electronic Library Service
ermpftX\ as13tsag1・2e (ftste)
systems for1996-model-yearvehicles compiled fromthtchellMechanicalPartsevLaborEstimating
Guide2002 part of which islistedinthble 1;
'Table
1:Subsystemand totalrepair costs fOreight major mechanical systems includinglaborand their reliabilities for1996-model-yearvehicles in1999.
Major System Subsystem FordTaurus Honda Accord Tbyota Camry ・・,
A!C Blower + Heater Core Cemp:e$sor
[[btal ReHabi]ity
$461
$559$1,020
4
$973
$594$1,567
4
$551
$SS6$1,437
・・・
5
Cooiing Water Pump
RadiatDr + Hose Tetal Reliability
$260$671$e31
2
$408$383$T91
5
$324$55S$8S2
・・・
5 Electrical Windew Motor
Wiper Moter
Total Reliabllity
$150$148$298
2
$182$265$447
4
$316$240$556
・・・
4
'
Subsysterns cerresponding to Augst 2000issueef Consumer Reports were listed.
3.Desigricharacteristicsof 1996-model-yearvehicles and theirsales data from WbTzi'sAutomotive
M7arbooksin1996and 1997;
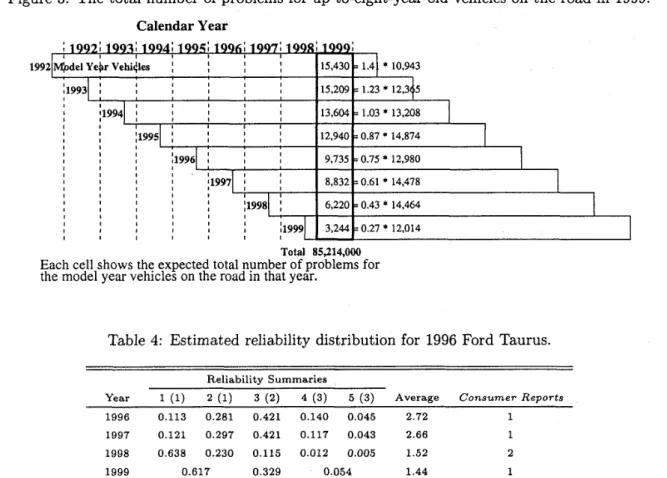
4.The totalnumber of up-to-eight-year-old vehicles ofon theroad in1999from WardlsMotor Vbhicle thctsand Figures in2000inFigure2;
'
5.Thelikelihoodsof problems ineach of theeight major systems for1996-model-yearvehicle between 1996-2eOlfrom April1997-2002 Consumer Reportspart of which isalsolistedinTable 1;
'
6.Annual(1996-2001)Classificationsof 1996-model-year yehicles intofive(threeinApril2000issue
and thereafter)reliability categories fromApril1997-2002 ConsumerReportsl
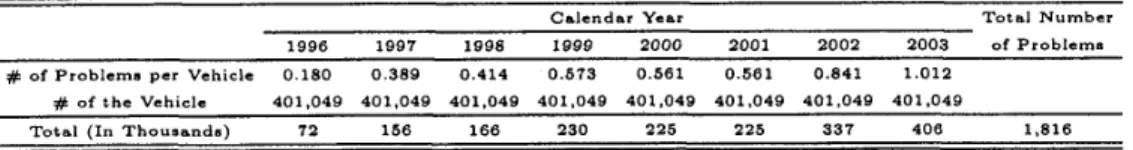
7,Annual(1992-2001)estimates of the number of problems of 1992-2001-model-yearvehicles by reliability categories inApril1993-2002 Consumer Reports. Table 2 isthe estimates for1996- model-year vehicle.
We will use thesedatatoconstruct estimates of lifetimemaintenance and repair cost. The Consumer E!v-
penditure Surveyisbasedon a carefu11y designedsample, theestimates of "typical"
itemizedmaintenance and repair cost and designcharacteristics ef 1996-model-yearvehicles are engineering data,and the total number of up-to-eight-year-old vehicles of on theroad isbased on sales data,These may be presumed
statistically reliable. However the samples on which reliability calculations are basedare selfselected:
they are solicited by ConsumerReports.Itseems possiblethat owners of unreliabre automobiles are
6
Estimating the maintenance and repair cost inLifeCycleCostealculation :
"A case of automobile ownership inthe U.S.-
[lable2:The annual estimates of the number of problemsof 1996-model-year vehicle when itsreliability
falIsintoone of the five(threein1999 and thereaeter)categories, ReliabilitySurnmary
Year 1(1) 2(1) 3(2) 4(3) 5{3)
1996 O.490 O.402 O.283 O.258 O.190 1997 O.775 O,640 D.503 O.3B2 O.2S6 1998 O,9Sl O.859 O,661 O.519 e.297
1999 1.124 O.747 O.450 2000 1.225 O,889 O.503
2001 1.352 O.950 O.530
2002 l.451 1.099 O.679
2003 1.558 1.223 O.705
overrepresented inthesample, leadingto asarnple selection bias.Thisisaggravated by the factthat if thereare too fewresponses fbra givenmodellmodel-year insome year, ConsumerReportsreports a miss-
ingvalue. We next turn to a careful descriptionof the reliability data,and the statistical methodelogy applied toreduee selection biases.
Predicted ReliabilityScore vs ReliabilitySummaries
'
There havebeen two automobile reliability scores publishedin Consumer Reports,"predicted
reliability score" and "reliability summaries." The reliability summaries are the weighted sum of the problemrates
of al1problem spots year byyear,car bycar, Consumer Reportsdescribedthat `tthe reliability summaries show how each model compares with theoveral) average forthat model year"and "the scores inreliability summaries are on relative scale, compared with the ayerage foral1models of the same yeat,from much worse than average tomuch betterthan average" on a five-pointscale (April1998 Consumer Reports).
The predictedreliability scores, on the other hand, are thejudgmentbased on the three most recent
yearsof reliability summaries. With theirauto engineers' knowledgeof the current year'smodels and the
reliability dataforthepast models, ConsumerReportsclaim thatthey havebeenable togivereliability prediction formest current models.
Pastexperiences, however,showed thatpredicted reliability scores might not be as accurate as the
name implied. Fbr example, out of 103,163 and 150 of 1996-model-yearyehicles surveyed inApri]
1997-1999issuesrespectively, 46.6%,45.4%,and 44.0% ef them registered reliability summaries that
were differentfrom the reliability scores predictedinApril1996issue.inthisstudy we chosereliability summaries as the measurement of reliability fortwo reasons: firstitreflected the aetual response, not prediction, from the readers in Annual Questionnaire;second the way itwas computed-relative to
the average foral1models of the same year, which can be easily determined-enabled us to calculate
vehicle-speeific reliability summaries,
NII-Electronic Library Service
ermpkSt\ as13tsrg1t2e (fti#e)
Nonignorable Missing Value Problem
There aare two potentialproblems in Consumer RepoTts'reliability summaries: the number of responses
fromowners of automebiles with fewsales might betoolimitedtoreliably evaluate thesecars, making
"insuMcient data"entries toappear intheirreliability summaries; comparatively more owners might hewe
responded totheirsurveys iftheyhad beendissatisfiedwith the reliability of theirown vehicles, elther out of obligation to make the informationewailable to pub]ic,or simply toconvey theirfrustration.
Especiallythe`[non-ignorable" non-response problernof the latter-insample survey terminology, a variable Y with unit nonresponse iscategorized as `lrion-ignorably missing" ifsome of the Y are missing
because ofthe underlying values ittakes-could rnake the responses fromowners of unreliable automebiles overrepresented inthe sample and seriously distortthe analysis, Seeappendix A forhow theseproblems
were addressed,
Data for Estimating the StatisticalModels
Reliabilitysummaries were the response variable forthe mu]tinemial cumulative probabilitylogistic
regression model inequation (1)inappendix A. We used reliability summaries for1996model years published inApril1997-2002Consumer Reports.We assigned scores 5to1to entries of much betterthan
average tomuch worse than aNerage in1997to1999issues,InApril2000issueand thereafter,reliability summaries were recorded on a 3 point-scale-betterthan average, average, worse than average-and
called the "reliability
verdict."2 We assigned scores 3to 1tothem. There were 84(47,7%),35 (19.9%),
47 (26.7%),48 (27.3%),53 (30,1%)and 63 (35.8%)missing reliability summaries out ef 176models in 1996, 1997,1998, 1999,2000 and 2001respeetively. We coded thern as "NA"
and includedthem. The
observed dataindicatorwas the responGe varjable forthe binomiallogisticregression model inequation
(3)inappendix A,The models in(1)and (3)were sirnultaneously estimated,
Due to the qualityof the parts,the nature of the design,or the production technique, sorne medels
suffer preblems at a rate farloweror higherthanwhat one might expect fromsheer aging. Explanatory
variables formodel (1)were: cars' designcharacteristics-maximum horsepower,displacementinliters,
weight inpounds and lengthininches;two dummy variables-one indicatingmariufacturers' country of
'
origin beingJapan and the other being Europe3-choosing U.S. as baselineieight t`segment;'
category
dummy variables indicatingwhether a vehicLe was small, large,luxury,sportfsporty, coupe, pickup truck,
SUV and minivan selecting medium passenger cars as baseline;one dummy variable indicatingwhether
the model was completely redesigned or newly introduced in 1996 by the Big Three (redesignedfor
short),4 These data were taken from Ward's Automotive}fliarbookin1996. The designcharacteristics were those of the mid-prieed models. We assume sales volume and reliabi]ity summary of each model could affect missing entries of itsreliability summary, and used the sales figurearid reliability score as
explanatory variables inmodel {3).
8