Peer-reviewed Article
How Centralization Affects Voter Turnout: The Case of California Seiji FUJII
*The Downsian model of voting predicts that only a few people will vote since the expected return to voting is far smaller than the cost. But in reality, millions vote. This paradox of voting remains unsolved for more than half a century. I examine empirically the prediction in the context of fi scal centralization which occurred in California in the late 1970s. The state of California limited the property tax rate to 1 percent of the purchase price when Proposition 13 was approved by the electorate in 1978. As a result, property tax revenues, on which local governments rely, declined to less than half, and the authorities lost discretionary power to set tax policy. I test the hypotheses that voter turnout for elected government officials at local level was lower after the passage of proposition 13 than before since the electoral outcomes matter less. I address voting for county boards of supervisors and school board members. Findings suggest that voter turnout for county boards of supervisors declined but that for school board members did not.
Key words: Fiscal centralization, Property tax, Voter turnout, County board of supervisors, School board members
1. Introduction
Downs(1957)predicted that only a few people will vote since the expected return to voting is far smaller than the cost when casting their ballots is hardly decisive to electoral outcomes. Motivated by this argument, an extensive literature has developed the rational voter model to answer why voter turnout is higher than Downs predicted(Riker and Ordeshook, 1968; Ferejohn and Fiorina, 1975; Tideman, 1985;
*
Faculty of International Studies and Regional Development, University of Niigata Prefecture
(sfujii@unii.ac.jp)
Glazer and Grofman, 1992; Aldrich, 1993). Controversies still surround the rational voter model both theoretically and empirically(Mueller 2003, Ch. 14; Duffy and Tavits, 2008).
The Downsian voter model has the following form:
, ⑴
where R is a person's expected return to voting, P is the probability that one's ballot will change the electoral outcome, B is a voter's benefi t from having one's preferred candidate win or the difference in expected utilities from policies of the two candidates, D is positive satisfaction from fulfi lling a sense of civic duty and seeing democracy continue as well as positive satisfaction for expressing solidarity with a candidate, and C is the cost of voting, e.g., time spent on going to the polls and gathering information.
A person votes if R is positive.
To address the Downs paradox, I look at a situation in which fi nancial power shifted from local governments to state government and ask how voter turnout for local government officials differed at the following elections. The constituent of the state of California approved the voter initiative, Proposition 13, which limited property tax rate to 1 percent of purchase price, resulting in local governments losing property tax revenues and power to set tax policy. Thus, Proposition 13 reduces the B term in value in equation (1) since the difference in the expected utilities from policies of the two candidates becomes smaller. Then, I hypothesize that more people will abstain at the local elections when, ceteris paribus, the electoral outcome matters less, as predicted by the Downs model.
The organization of this paper is as follows: The next section explains Proposition 13. The third section goes over the hypothesis testing and shows the results. The last section will conclude.
2. Proposition 13
Proposition 13 was a voter initiative constitutional amendment, which approved by voters by a 2-1 margin at the 1978 primary election in California. Proposition 13 limited the property tax rate to 1 percent of purchase price uniformly across counties.
Prior to the passage of Proposition 13, each local authority(counties, cities, school
districts, and special districts)had the power to determine how much property tax revenue to collect each year. Property tax rates generally varied between 1.5 percent and 3.5 percent of market value, and the average rate was about 2.5 percent(O'Sullivan et al., 1995).
Proposition 13 specifi es the followings. (1) The real property tax rate is limited to 1 percent of the full cash value. (2) The full cash value of the property is its value as of 1976-1977. (3) When there is a change of ownership, the property is assessed at its market value. (4) The full cash value can increase with infl ation up to 2 percent annually. And (5) state and local governments cannot impose any additional ad valorem taxes on real property. The state government also cannot impose any additional taxes without a two-thirds majority vote of the legislature. The city, county, and special district cannot impose additional taxes without a two-thirds majority vote of their electorate. Total tax revenues collected by the county government are redistributed to local governments such as cities, school districts and special districts within each county according to the state law.
When Proposition 13 took effect, county governments suffered a 52.3 percent decrease in general property tax revenues from fi scal year 1977-78 to 1978-79. 33.2 percent of general county revenues were real property collections in 1977-78, whose share fell to 16.9 percent in 1978-79. School and community college districts suffered a 53.1 percent decrease in property tax revenues from fi scal year 1977-78 to 1978-79.
The percentage of property tax revenues in the general funds of school and community college districts was 51.5 percent in 1977-78, which declined to 24.5 percent in 1978-79. See Graph 1 below. As a result, local governments had to turn to the state legislature for fi nancial assistance and raise existing fees or enact new local levies such as property transfer fees or utility user fees to offset losses in property tax revenues.
In this sense, Proposition 13 centralized the financial structure of public sector in
California.
Graph 1. Effects of Proposition 13 on Revenues of Counties and School districts
Sources:
California, State Controller, Annual Report of Financial Transactions concerning Counties of California, various years.
California, State Controller, Annual Report of Financial Transactions concerning School Districts of California, various years.
State aid was available to compensate for property tax revenue losses, although
the magnitude of losses and the extent to which state subsidies have replaced the
losses have varied among different levels of government. Due to state bailout bills,
both short-run and long-run assistances, net losses were 6.1 percent for general county
revenues and 1.2 percent for the general funds of school and community college
districts respectively in fi scal year 1978-79. The incomes in general funds for school
and community college districts went up by 10 percent from fiscal year 1977-78 to
1979-80. On the other hand, the general county revenues decreased by 2.8 percent from
fi scal year 1977-78 to 1979-80.
Proposition 13 was a salient and high profile issue in California in the late 1970s. There are at least two reasons. One is the rapid increase in property tax bills and the other is a furious campaign done by the opponents to Proposition 13. Due to infl ation, some property tax bills doubled and tripled, and also income taxes increased by more than 1.5 times between 1974 and 1977(Rabushka and Ryan, 1982). The public required substantial tax relief and the legislature was well aware of this public pressure.
Virtually every interest group opposed Proposition 13. Opponents were business, labor, education, political groups, the press, and politicians. Opponents did an awful campaign. They warned, intimidated, threatened, and even bribed voters
(Rabushka and Ryan, 1982). The legislature attempted to beat Proposition 13 by more moderate alternative Proposition 8, which was put on the same ballot(Fujii, 2009).
Only a few proponents were home owners and two of four Republican candidates for the governor.
In fact, Novel Prize winning economist, Paul Samuelson, states that Proposition 13 may be the most important political-economic event of 1978, and perhaps even of the 1970s, in the United States(Francis, 1978).
3. Estimation and Results
Following typical empirical research in this fi eld, I specify voter turnout as a function of available independent variables. I apply the fi xed effects model or LSDV
(least-squares dummy variable)model(Knack, 1995; Radcliff, 1992; Riel and Schram, 1993). The fixed effects model can control for district-specific and time- invariant factors, the data availability of which is quite limited by supervisorial and school district levels in the 1970's. These factors would be somewhat related to the term D in equation (1), namely, satisfaction for fulfilling the sense of civic duty or satisfaction for expressing solidarity with a candidate.
I address voting for county boards of supervisors and school board members
among four major levels of local governments in California: county, city, school district
and special district. As mentioned earlier, the effects of Proposition 13 on these two
levels of governments will be large enough for the test to be instructive. As discussed
in the previous section, property tax revenues, on which these governments rely,
declined signifi cantly. Moreover, it is more diffi cult to collect data on voter turnout for city councils and directors of special districts than county boards of supervisors and school board members.
To test the hypothesis that voter turnout for supervisors was lower after the passage of Proposition 13 than before, I apply the Chow test of structural change. I would predict there is a difference between two regression lines before and after 1978.
The difference could be due to intercept terms or slope coefficients or both. On the other hand, to test the hypothesis that voter turnout for school board members was lower after the passage of Proposition 13 than before, I consider that the structural change was due to the intercept term only since it would not be possible to construct an interaction term due to the availability of data.
3.1. Analysis of County Board of Supervisors
Except for the city-county of San Francisco, which has 11 supervisors and a mayor, each county has 5 supervisors elected from 5 supervisorial districts. Since county boards of supervisors are chosen for 4-year staggered terms on a nonpartisan ballot at primary elections, some of them are chosen at gubernatorial elections and the others are chosen at presidential elections. It depends on each county which district chooses the supervisor at which election. In some cases supervisors are chosen irregularly when incumbents resign or retire during their terms. Due to these features panel data is unbalanced.
I compare the two different races for supervisors and for the governor / president at the same general elections, which are run-off elections for supervisors. If the most popular candidate didn't receive a majority vote at the primary election, the most popular candidate and the second-most popular candidate face the run-off election in November.
1That is, I focus on the behavior of voters who did join one of the races on the ballot but did not join the other of the races on the same ballot at the polls.
I look at 187 districts from 49 counties. The number of observations is 325 at 7 general elections between 1972 and 1984. The average number of elections per district is 1.7. The observation is by county in San Mateo County and Tehama County.
Dependent variable
Super: The dependent variable is the voter turnout for supervisors at run-off elections
at the general elections. This is given by the number of voters voted for county board of supervisors divided by the number of registered voters by supervisorial district.
2Ideally, the number of eligible voters by supervisorial district must be used since it can avoid possible miscellaneous effects such as a fl uctuation of the numbers. Registered voters would make decisions differently from eligible voters who do not register to vote.
I take the logistic transformation on the voter turnout since the transformed variable takes the value between negative infinity and positive infinity(Eagle and Erfl e; 1989).
3Independent variables
Prop 13: The dummy variable equals to 1 if the election is held after 1978.
PreGov represents voter turnout for the president or the governor by supervisorial district at general elections except two counties mentioned above. This is the number of voters voted for the governor at the gubernatorial elections and the president at the presidential elections divided by the number of registered voters. I also applied the logistic transformation.
Closeness measures how close the races are. When the election is by district and there is only one seat available, I take the difference between the percentage vote of the most popular candidate and the second-most popular candidate. When there are two seats, I take the difference between the percentage vote of the second-most popular candidate and the third-most popular candidate, and so forth.
4Democrat is the percentage of Democratic voters in each supervisorial district. The observation is by county in San Mateo County and Tehama County.
Financial information by county is also used. Variables include Property tax
rates, Property tax revenues, Charges for current services, and License fees. Variables
about expenditures include General function, Protection, Health, Public assistance,
and Education.
5When the data by supervisorial district is not available, I substitute
the county data for the supervisorial district data. I compute the value per capita. These
variables will control for the effects of public spending aspects on voter turnout.
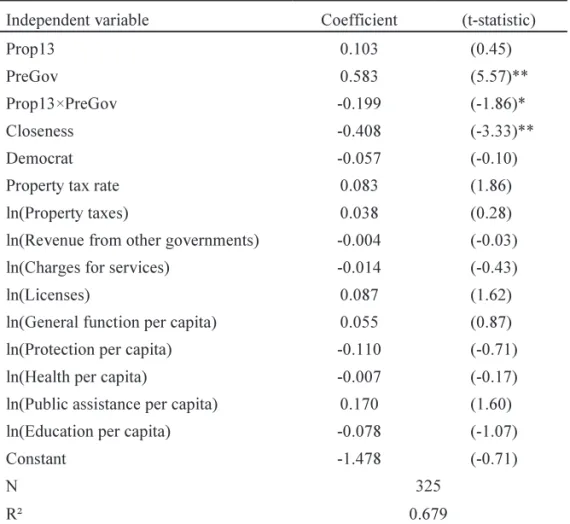
Table 1. Fixed Effect Estimates
Supervisorial district turnout 1972 - 84(General elections run-off)
Dependent variable: Super(Voter turnout for supervisors)
Note:
*Signifi cant at the 10% level
**Signifi cant at the 1% level
Table 1 shows the results for run-off elections at the general elections. Year
dummies are suppressed for ease of presentation. I compared the relative importance
of voting for supervisors against voting for the governor/president at the same
elections. The estimated coeffi cients on PreGov and Prop 13× PreGov are statistically
signifi cant, but the coeffi cient on Prop 13 is not. This indicates that the difference is
attributed to the slope coefficient. When voter turnout for the governor or president
increased by one percentage point, voter turnout for the supervisors increased by 0.583
percentage points on the average before the passage of Proposition 13. On the other
hand, voter turnout for the supervisors increased by 0.384(0.583-0.199)percentage
points on the average after the 1978 primary election as voter turnout for the governor
or president went up by one percentage point. This implies some of the voters refrained from voting for supervisors even though they voted for the governor or president on the same ballot, and the number of this type of voters was significantly larger after the passage of Proposition 13 than before. Thus, I would conclude that the relative importance of county boards of supervisors was smaller compared to the governor or the president after the passage of Proposition 13 than before. Among other independent variables noteworthy is the negatively estimated coefficient on Closeness. Since smaller value of this variable indicates that the race is closer, the probability that one's single vote is decisive(the P term in equation (1))accordingly goes up, which results in higher turnout.
3.2. Analysis of School Board Members
Dependent variable: Voter turnout for school board members by school district.
6The number of vote cast is not divided by the number of registered voters in the district because the information is not available. Each school board consists of 3 – 7 members with 4-year staggered terms. The number of seats available for school trustees usually differs election to election and district to district. To obtain more appropriate turnout, I aggregate the number of votes all candidates received and divide it by the number of seats when the election system is at large. I use this method because voters can choose more than one candidate from the list when the election system is at large. On the other hand, when the system is by trustee area, voters can choose only one candidate from the list.
I look at 96 elementary and unifi ed school districts in Los Angeles County and Orange County. Since high school districts and elementary school districts overlap, high school districts are dropped because the time-invariant individual-specifi c effect terms are typically assumed to be uncorrelated with other individuals. Elementary school districts and unified school districts will never overlap. Community college districts are excluded for the same reason. The number of observations is 715 at 10 school elections between 1967 and 1985.
7Independent variables
Average daily attendance: The number of students per school district. Since neither
the number of eligible voters nor registered voters are available by school district over
covered years, I substitute the number of students for the number of voters. Average daily attendance will be correlated with voter turnout if parents care about their children's school.
Prop 13: Dummy variable which takes on the value of 1 if the election is held after 1978.
Closeness: This variable measures how close the race is. This is obtained in the same way as in the analysis of supervisors.
Referendum: Dummy variable equals to 1 if another referendum was listed on the same ballot. Issues include such as bond issues and revenue measures to raise property tax rates.
8Newspapers provide this information.
Official: Dummy variable equals to 1 if the data source is an official document published by the government. The numbers of voter turnout in offi cial documents are sometimes larger than those in newspapers. This is perhaps because offi cial documents are issued later and can take into account write-in votes or errors such as miscounting.
Newspapers also sometimes show incomplete results based on the counts of less than 100 percent of votes cast.
No opponent: Dummy variable equals to 1 if there is no opponent in the race.
The fi nancial information about school district is also included. The variables consist of Total incomes, Incomes given from the federal and state governments respectively, and Income raised from school district's own sources. I look at only general funds. Incomes from different levels of government consider the shift of power caused by the increase in aid.
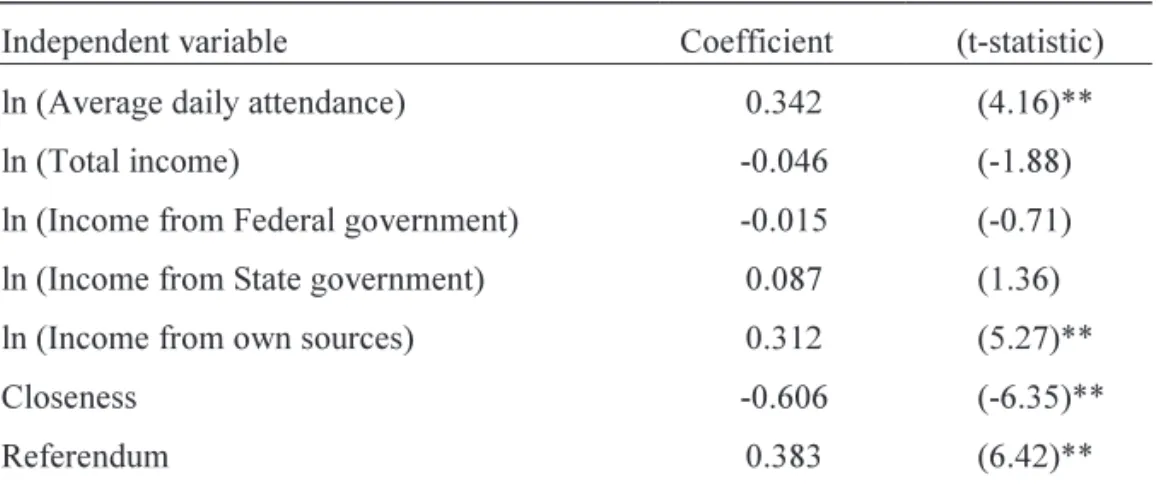
9Table 2. Fixed Effect Estimates: School district turnout 1967 - 85
Dependent variable: ln(Voter turnout for school board members)
Note:
*Signifi cant at the 5% level
**Signifi cant at the 1% level
Table 2 shows the results of the school election analysis. Year dummies are suppressed for ease of presentation but are statistically signifi cant in general. Since the estimated coeffi cient on Prop 13 is not statistically signifi cant, I wouldn't conclude that there was a structural change before and after the passage of Proposition 13.
A possible reason would be confounding effects of another issue, Serrano v.
Priest. In 1971, the California Supreme court ruled in Serrano that reliance on property taxes to finance public schools is unconstitutional and violates the equal protection clause of the California Constitution. The court required the inequalities in dollar expenditures per student be limited within $100 across districts in Serrano II in 1976.
As a result, the effects of Proposition 13 which limited property tax rates to 1 percent uniformly across the state might be weakened. Fischel(1996)argues that the Serrano decision partly caused Proposition 13 to pass. Serrano weakened the Tiebout system, and higher-than-average spending districts lost incentives to preserve higher property tax rates.
The estimated coefficients on other variables, Closeness, Referendum, No opponent, are positive, negative, and positive respectively as I expected.
4. Conclusion
I tested the hypotheses that, if local government offi cials have weaker power
to set tax policies, then voter turnout for the offi cials will be lower at local elections
than before based on the Downsian rational voter mode. Analyzing voter turnout for
the county board of supervisors at run-off elections at general elections from 1972
to 1984 and school board members at school district elections from 1967 to 1985, I
have found that voter turnout for supervisors was signifi cantly lower after the passage
of Proposition 13 than before, the results of which are consistent with the Downsian model, but voter turnout for school board members was not. School district elections in California in 1970s might be affected by confounding effects of another issue Serrano v.
Priest.
Acknowledgement
I would like to thank Professor Amihai Glazer at the University of California, Irvine for innumerable advices, guidance and encouragement to write this paper. I would also thank an anonymous referee, Professor Justin Tobias, Professor Linda Cohen, and Ashish Chaturvedi for their helpful comments and suggestions. All remaining errors are my own.
Notes
1 It depends on each county whether or not the run-off election is executed. In some counties, the most popular candidate wins even though he collects less than a majority vote.
2 The number of total votes cast to candidates for the governor and the president by supervisorial district is obtained from Statement of Vote issued by the California Secretary of State. The number of total votes cast to candidates for the supervisor is obtained from newspapers: Sacramento Bee, Los Angeles Times and San Francisco Chronicle.
The number of registered voters by the supervisorial district level is obtained from Report of Registration issued by the California Secretary of State. This report is issued in several months in an election year. I use the data one month prior to each primary and general election.
3 logistic(Turnout rate)= log {Turnout rate / (1 - Turnout rate)}. With a bit of work, this is reduced to log {(voters who voted)/(voters who didn't vote)}. I owe this derivation to Ashish Chaturvedi.
4 If candidates are chosen at large by county, I take the difference between the percentage vote of the weakest winner and the strongest loser. If the strongest loser received more votes than the weakest winner, I calculate the percentage as mentioned above by district, add up the percentages, and divide it by the number of districts.
5 The data is obtained from Annual Report of Financial Transactions concerning Counties of California issued by the State Controller.
6 Voter turnout is obtained from school board election results in newspapers such as Los Angeles Times and Orange County Register. The school board election results for Los Angeles and Orange Counties are used. I also looked at Statement of all votes cast published by Orange County Registrar of Voters.
7 One might argue that the shift in school election calendar from March to November in 1978 caused some effects on turnout. Turnout can be higher in November in even odd-numbered year because general elections are held in November. If so, it would be diffi cult to isolate the effect of the change in election calendar from the effect of Proposition 13 on voter turnout.(School elections were executed in April before 1973, in March in 1975 and 1977, and in November after 1979. This essay will neglect the shift from April to March.)Instead, one might suggest analyzing the effect of the fi rst Serrano case in 1971 and the legislature response on turnout. Other researchers also argued that the effects of the fi rst Serrano and the legislature response(SB 90)on school financing were negligible because the equalization was not achieved. But it would be important to analyze the effects of AB 65 following Serrano II and Proposition 13 because their effects on public school financing were large. Assembly bill No. 65 was designed to respond to Serrano II, approved by the Governor and took effect in the July of 1978(one month later than the passage of Proposition 13).
8 A majority vote or a two-third majority vote is required to approve these measures.
9 The fi nancial information for all the public school districts in California for every fi scal year is obtained from Annual Report of Financial Transactions concerning School Districts of California issued by the State Controller.
References
Aldrich, John H., ʻRational Choice and Turnout,ʼ American Journal of Political Science, 37, 1993, pp. 246- 278.
226 Cal. Rptr. 584
California. D epartment of Finance, Updated Revised of Historical County Population Estimates and Components of Change, July 1, 1970-1989, Sacramento: The Offi ce, Demographic Research Unit, September 2002.
California, Secretary of State, Report of Registration, Sacramento: California Secretary of State, May 1974.
California, Secretary of State, Report of Registration, Sacramento: California Secretary of State, May 1976.
California, S ecretary of State, Report of Registration, Sacramento: California Secretary of State, March 1980.
California, Secretary of State, Report of Registration, Sacramento: California Secretary of State, May 1982.
California. Secretary of State, Statement of Vote, Sacramento: California State Printing Offi ce, Various years.
California. St ate Controller, Annual Report of Financial Transactions concerning Counties of California, Sacramento: The Offi ce, Various years.
California. S tate Controller, Annual Report of Financial Transactions concerning School Districts of California, Sacramento: The Offi ce, Various years.
Downs, Anthony, An Economic Theory of Democracy, New York: Harper & Row Publishers, 1957.
Duffy, John a nd Margit Tavits, Beliefs and Voting Decisions: A Test of Pivotal Voter Model, American Journal of Political Science, 52, 2008, pp. 603-618.
Eagles, M unr oe and Stephen Erfle, ʻCommunity Cohesion and Voter Turnout in English Parliamentary Constituencies,' British Journal of Political Science, 19, 1989, pp. 115-125.
Ferejohn, Joh n A. and Fiorina P. Morris, ʻCloseness Counts Only in Horseshoes and Dancing,' American Political Scie nce Review, 69, 1975, pp. 920-925.
Fischel, Willi am A., How Serrano Caused Proposition 13?, Journal of Law and Politics, 12, 1996, pp.
607-636.
Francis, D avi d R., Odd effects of California's Proposition 13 crop up, The Christian Science Monitor, June 26, 1978.
Fujii, Seiji, Political Shirking - Proposition 13 vs. Proposition 8, Japanese Journal of Political Science, 10, 2009, pp. 213-237.
Glazer, Amih ai and Bernard Grofman, A positive correlation between turnout and plurality does not refute the rational voter model, Quality & Quantity, 26, 1992, pp. 85-93.
Knack, Steph en, ʻDoes Motor Voter Work? Evidence from State-Level Data,' Journal of Politics, 57, 1995, pp796-811.
Los Angeles Times, Various dates.
Muller, Dennis C., Public Choice III, Cambridge: Cambridge University Press, 2003.
Orange County, Registrar of Voters, Statement of all votes cast, Santa Ana: California, Various years.
Orange County Register, Various dates.
O'Sullivan, A rthur, Terri Sexton, and Steven Sheffrin, Property taxes and the revolts: The legacy of Proposition 13, Cambridge: Cambridge University Press, 1994.
Proposition 1 3, Retrieved from the California Ballot Propositions Database(Record number 774), Available at the Website of Hastings Law Library, University of California, Hastings College of the Law:
http://holmes.uchastings.edu/cgi-bin/starfi nder/14228/calprop.txt.
557 P.2d 929.
Rabushka, Alvin and Pauline Ryan, The Tax Revolt, Stanford: Hoover Institution, 1982.
Radcliff, Ben jamin,
ʻ
The Welfare State, Turnout, and the Economy: A Comparative Analysis,' American Political Science Review, 86, 1992, pp. 444-454.Riel, Arthur v an and Arthur Schram, ʻWeimer Economics Decline, Nazi Economic Recovery, and the Stabilization of Political Dictatorship,' Journal of Economic History, 53, 1993, pp. 71-105.
Riker, Willia m H. and Peter C. Ordeshook, ʻThe Theory of the Calculus of Voting,' American Political Science Review, 62, 1968, pp. 25-42.
Sacramento Bee, Various dates.
San Francisco Chronicle, Various dates.
Tideman, T. Nicolaus, ʻRemorse, elation, and the paradox of voting,' Public Choice, 46, 1985, pp. 103-106.