WASEDA BUSINESS & ECONOMIC STUDIES 2009 NO.45
Bidder and Target Valuation:
Evidence against the Misvaluation-Driven Takeovers of M&As in Japan
by Shinya Hanamura*
Abstract
I analyze 377 takeovers that occurred in Japan between 2000 and 2007. My focus is on the choice of payment method between cash and shares, the bidding premium, the market valuation of a bidder and a target, and the share price reaction. I relate the findings to the two complimentary theories of takeover motives; the Q-theory and the misvaluation theory. Japanese takeover market was very small before the late 1990s and then quickly expanded in the 21st century, so that I believe that we are among the first to explore the marker.
My results are in contrast with Dong et al. (2006) and most of the findings are rather consistent with the Q-theory than with the misvaluation theory. Although I understand the difficulty of separating the Q -theory and the misvaluation theory, as Dong et al, explain, the Japanese evidence casts doubt over the global applicability of the theory of a misvaluation-driven merger wave.
Keywords: Tender Offer Bid, Mergers, Stock-to-stock acquisitions, Q theory, Misvaluation Hypothesis
1. Introduction
Following years of relative inactivity, the twenty-first century has seen the market for corporate control emerging and developing quickly in Japan. According to Recof Corporation's MARR Magazine (2008), the number of purely domestic mergers and
* Doctoral student of The Graduate School of Commerce Waseda University
99
acquisitions increased from 453 in 1997 to 2,020 in 2007, and permeated all levels of corporate Japan. 'Ihe government helped the development of the market for corporate control by a series of deregulation. The motivation was to promote the consolidation among Japanese companies and help the economy to recover from the prolonged recession. One of the most prominent reforms was that of the Commercial Law in 1999.
Following the reform, Japanese M&A transactions, which used to be conducted either by a merger (using shares as a means of payment) or by a cash acquisition of shares (partly through a tender offer bid), have come to include kabusbikl-kokan (stock-to-stock acquisition) that enables an acquirer to transform a target company into a 100-percent- owned subsidiary of the acquirer by forcefully exchanging the target's shares with the acquirer's.
With the market for corporate control quickly expanding in Japan over the decade, and with more choices available regarding payment methods, I am curious how the management of Japanese corporation chooses among the alternatives. I am particularly interested in relating the choice to the motivations for an M&A transaction of the management. As Doug, Hirshlelfer, Richardson, and Tech (2006) claim, there are broadly two alternative theories of takeovers, one based upon stock market misvaluation and the other based upon the Q theory of investment (Brainard and Tobin (1968)). Dong et al. claim that the US evidence is broadly consistent with both hypotheses.
Based upon Dong et al's results, I investigate a similarity or a difference between the motivation in the US and in Japan. Since the previous research such as Kang, Shivdasani, and Yamada (2000) and Inoue and Kato (2006) find that the share price reaction of an acquirer to a takeover announcement is significantly positive, I expect that the acquirer's management generally works to increase the wealth of its shareholders. I still do not know, however, whether the management is also motivated by market misvaluations to launch a takeover, particularly when the management can use overvalued shares as an acquisition currency. Following Dong et al. (2006), I investigate the characteristics of an acquirer and of a target, and the selected payment method. I also examine whether the choice is related to the level of control premium paid to target shareholders and the share price reaction to the news of the deal.
My results are in contrast with Dong et al. (2006) and most of the findings are inconsistent with the misvaluation theory. Although I understand the difficulty of separating the Q-theory and the misvaluation theory, as Dong et al. explain, the Japanese evidence casts doubt over the global applicability of the theory of a misvaluation-driven merger wave.
The paper is structured as follows. In Section 2, I briefly summarize the two complementary theories of takeovers developed by previous research. I also explain the measures that I use to test the two theories. In Section 3, I explain my data, hypotheses and testing methodology. In Section 4, I present the empirical results both from univariate and multivariate tests, which I summarize and conclude in Section 5.
2. Previous Research Literature
2.1. The Q theory: Under the Market Efficiency
The Q theory of an M&A (Brainard and Tobin (1968)) focuses on the redeployment of target assets. High market valuation means that a company is well managed or has good investment opportunities. A takeover of a low valuation target by a high valuation acquirer implies good news that a well-managed company acquires a poorly-managed target to increase the more efficient deployment of the latter's assets (Jensen and Ruback (1983)), Thus, the bidder and target valuations affect the returns of share prices at the time of the takeover announcement. Under the Q hypothesis, the offers by well-run (high-Q) bidders generate greater total gains from takeover on average, and therefore yield higher bidder stock returns.
There are several empirical findings that are related to the Q theory. For example, Lang, Stulz, and Walkling (1989) show that a high-Q acquirer meets with more positive share price reaction at a takeover announcement than a low-Q acquirer. They also find that a low-Q target receives larger takeover premium than a high-Q target. They report that a takeover by a high-Q acquirer of a low-Q target results in the largest gain in market value of combined market value of shares of the acquirer and the target, which implies that the market expects the improvement of the target's management most under such takeover. Andrade, Mitchell, and Stafford (2001) report that in two-thirds of their sample takeovers, the Q-ratio of a bidder is higher than that of a target. Hansbrouck (1985) finds that within an industry, a firm with low Q-ratio is more likely to become a target of a takeover, which he interprets as evidence that a company that is poorly managed is targeted in a takeover bid.
101
2.2. The Misvaluation Theory: Under the Market Inefficiency
While the Q-theory fits in the framework of the market efficiency, the misvaluation theory of a takeover assumes the market inefficiency. The theory suggests that a bidder tries to profit by buying an undervalued target for cash at a price under fundamental value, or by paying by shares when the bidder's share is overvalued. Shleifer and Vishny (2003) argue that target overvaluation encourges the target management to voluntarily accept expropriative offers in order to cash out. Misvaluation of a bidder and a target affects the means of payment (stock versus cash), bid premium, and announcement- period returns. According to the misvaluation theory, a takeover by a high valuation acquirer, particularly using shares as a means of payment, should result in the negative market reaction because the market regards that the acquirer's shares are overvalued rather than the target's shares are undervalued. This should occur under the condition that the degree of misevaluation of a bidder is larger than that of a firm being acquired. Under the Q-theory, offers by well-run (high-Q) bidders generate greater total gains from a takeover on average, and therefore yield higher bidder stock returns.
2.3. Valuation Measures for Empirical Tests of the Two Theories
The above two theories are not necessarily mutually exclusive, unless one is a pure market efficiency believer. However, as I have described, there are circumstances where the two theories make the opposite prediction, such as the market's reaction to a takeover by a high valuation bidder using shares as a means of payment. Therefore, I am interested in figuring out which of the two theories explains better what I observe in the market,
In order to separate out the effects from the two theories, Dong et al. (2006) propose the use of two valuation ratios. One is the price-to-book ratio (hereafter P/B) and the other is the price-to-theoretical-value ratio (hereafter P/V).' They claim that the Q theory is related to the P/B ratio and the misvaluation theory is related to the P/B and the PN ratios. Since P/V ratio reflects the analysts' forecasts of future earnings, P/V is a relatively pure measure of misevaluation and it has also been used by other research such as Frankel and Lee (1998), Lee, Myers, and Swaminathan (1999) and D'Mello and Shroff (2000). Dong et al. (2006) admit the limitation of P/V ratio because analysts forecasts may not perfectly reflect information about the future growth of the company. They propose the inclusion of bidder and target P/B in their tests of the effects of bidder and target P/V and claim that P/B and P/V provide complementary information about the ' The theoretical value (V) is derived from the model
of Ohlson (1995).
misvaluation hypothesis.
3. Data and Methodology
The focus of my research is to follow Dong et al. (2006) and examine whether I can observe similar effects in Japan to what they find in the US takeover market. As I described, Japanese takeover market has only got active since the late 1990s, so relatively few research has been made as to reactions and consequences of a takeover in the country.
Furthermore, the previous research reports significantly positive share price reaction of a bidder, so that I expect the management of a bidder to generally act more oriented to the value creation of its shareholders. Therefore, simply replicating Dong et al. (2006) with Japanese data may result in different findings, and may provide more insights as to the generality of their findings in a more global setting.
3.1. Data
I have collected the sample of tender offers (TOBs), stock-to-stock acquisitions (kabushiki-kokan), and mergers (gappei) between 1999 and 2007 from Nikkei AMSUS/
NEEDS Database. Accounting data and share price data are also collected from them.
Shareholding data are manually collected from Nikkei Kaisha-Joho (Company Data Book). The earnings forecast data, which I use to calculate theoretical value of shares (V) by the model of Ohlson, Juettner-Nauroth (2005), are the figures reported by Toyo Keizai Inc., also collected from Nikkei AMSUS/NEEDS Database, The theorectical value is calculated based upon the model of Abnormal Earnings Growth model. Abnormal Earnings Growth model doesn't need the book value of equity at the date of announcement, which makes easier to calculate theoretical value of shares(V), Toyo Keizai Inc. is a publisher of economic magazines and compiles its forecast by combining a listed company's official earnings forecast and a hearing conducted by reporters of its magazines. The earnings forecast data by Toyo Keizai are frequently used in an academic research.
The sample period is chosen to include kabusbiki-kokan (stock-to-stock acquisitions), which were made possible as a result of the reform of the Commercial Law in 1999. I have initially collected tender offers, stock-to-stock acquisitions and mergers of companies listed on the First and the Second Sections of the Tokyo Stock Exchange (TSE hereafter) between 2000 and 2007. 1 exclude tender offers whose targeted percentage of share purchase is non-controlling block of below 50 percent. I believe such exclusion is necessary to enable the comparison of tender offers with stock-to-stock acquisitions and
103
mergers, which deal with 100 percent of target company's existing shares.
In calculating the valuation ratios, I find that the V is occasionally estimated to be very low, causing the P/V ratio to be extremely large. As a result, I use the reciprocal of P/B and P/V, i.e., B/P and V/P respectively.' I exclude 71 cases where either B/P or V/P is negative, and I sample where V/P is calculated to be extremely large at above 100. My final sample includes 135 tender offers, 166 stock-to-stock acquisitions, and 76 mergers, which totals 377 transactions. Within my sample period, all tender offers use cash as a sole method of payment, while all stock-to-stock acquisitions and mergers use bidder's shares as a means of payment. Therefore, I have 135 cash takeovers and 242 share takeovers in my sample.
3.2. Predictions of the Two Takeover Theories
The purpose of my research is to examine how the two theories that I described in Subsection 2.3 explain the motives of Japanese takeovers, For that purpose, I follow Dong et al. (2006) and use B/P and V/P ratios to measure the valuation effect. As they admit, it is not necessarily easy to separate the effects of the two theories. Both theories may or may not lead to the same empirical predictions. Therefore, I summarize the predictions that are considered to result from each theory as below.
Under the Q-theory, when a low B/P (high valuation) bidder acquires a high B/P (low valuation) target, greater total (bidder and target combined) gains are generated by the acquisition than when a high B/P bidder acquires a low B/P target. 'therefore the bidding premium may be higher for the former type of acquisitions, since larger gains from a takeover imply that a bidder can be more generous in sharing the gains with the target. As for V/$ the theory does not have any predictions about the gains from a takeover. In fact, under the assumption of market efficiency, the difference in V/P should be of random nature and should not be associated with takeover gains. Neither does the theory predict that the choice of payment be related to B/P or V/P, because the market efficiency implies that a share takeover should offer neither advantage or disadvantage over a cash takeover.
2 Since Japanese Securities Law mandates bidders who seek more than 33 .4% of outstanding shares of targets to use TOB, large number of partial bids for less than 50%
of outstanding shares of targets are included in the initially collected sample.
' Dong et al
. (2006) report that the use of B/P and V/P instead of P/B and P/V does not affect their results much.
Under the misvaluation theory, both B/P and V/P measure the degree of equity misvaluation. When a bidder's B/P and V/P are low (high), meaning overvaluation (undervaluation), the bidder is tempted to use its shares (cash) as a means of payment.
When a target's B/P and V/P are low, meaning overvaluation, a bidder is tempted to use its (also overvalued) shares as a means of payment, because this will avoid cashing in the target's highly priced shares. In an opposite case, a bidder prefers to use cash to benefit from the low target share prices. When a bidder's B/P and V/P are low, and when a target's B/P and V/P are high, I expect the bidding premium to be larger because the bidder with easier financing can he more generous about paying premium to the undervalued target. The choice of shares as a means of payment causes the bidder's share price to decrease more than when cash is chosen, since market receives signal that it is probable that the bidder's share price is overvalued.
4. Results
4. 1 Descriptive Statistics
In Table 1, I report the descriptive statistics of my sample, namely the mean and the median of the bidding premium,4 the toehold shareholdings (shareholding of a bidder prior to a takeover announcement), and B/P and V/Ps of bidders and targets. I also report the ratio of target's market cap to bidder's marker cap, which I will use later as variables to characterize the takeovers.
As I see from Table 1, the bidding premium in Japan is significantly positive. I see, however, that the bidding premium is generally smaller in Japan at about 10 percent for tender offers and around 5 percent for share takeovers than that in the US. The toehold is highest with stock-to-stock acquisitions, then that of tender offers follows. In the case of mergers, the toehold is very low with the median being zero. This reflects the fact that ' The bidding premium is c
alculated as (offer price - target's share price 5 business days prior to the offer) / (target's share price 5 business days prior to the offer) for tender offers. For mergers and stock-to-stock acquisitions, we calculate the ratio between the bidder's share and the target's share from share prices at 5 business days prior to the transaction announcement. The bidding premium is calculated as (announced exchange ratio - exchange ratio calculated by market prices at 5 business days prior to the offer) / (exchange ratio calculate by market prices at 5 business days prior to the offer).
s B/P and VIP are calculated using the market capitalization at 21 business days prior to the announcement.
105
stock-to-stock acquisitions are often used when a target is a partially owned subsidiary of a bidder, and is transformed to be 100 percent owned subsidiary via a stock-to-stock acquisition. In contrast, a merger is frequently used to consolidate independent companies which are competing in the same industry.
As for B/F, the median of bidder's B/P is 0.62, while that of a target is about 1, which means that the bidders are more highly valued, or better managed, than the targets.
In contrast, the V/P of a bidder and a target do not differ much, with the mean almost equal to 1. This suggests that on average I do not see systematic misvaluation of bidders or targets, and the bidders are better managed than the targets.
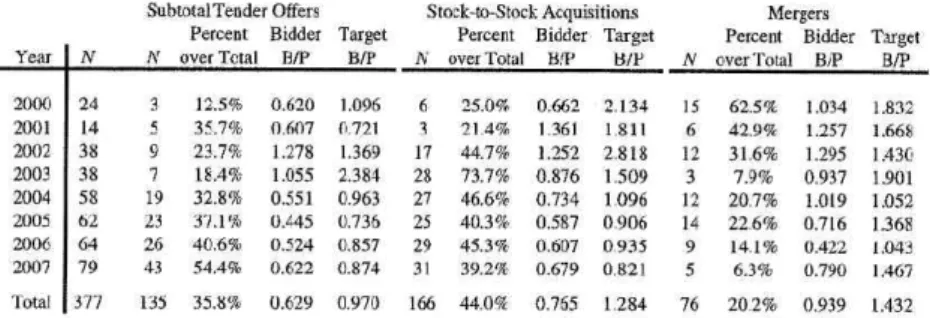
Table 2 shows the number of tender offers, stock-to-stock acquisitions and mergers by year. It also shows the average B/P of bidders and targets within each subgroup. As I can see, the number of tender offers and stock-to-stock acquisitions have been increasing since 2000, while that of mergers is decreasing. Thus, takeovers are becoming more frequent than mergers within this period. I also note that the average B/P of bidders is consistently lower than that of the targets, and shows decreasing trend since 2002. The average B/P of targets, which was above I until 2003, has also been decreasing with the exception of that of mergers. These unique features of mergers implies that I might need to consider not only the difference between cash deals and share deals, but also the difference between merger and stock-to-stock acquisitions.
4. 2 Univariate Analyses
4.2. 1 B/P and VIP of Bidders and Targets
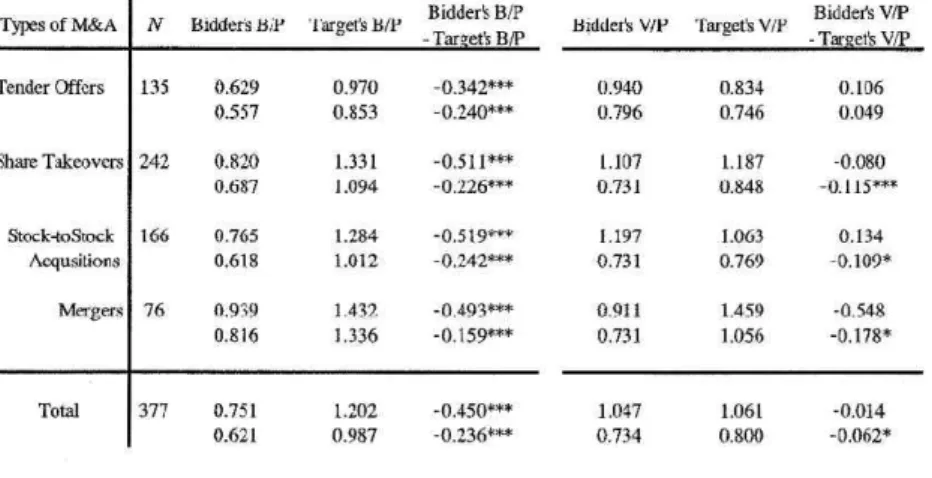
Next, I examine B/P and V/P of bidders and targets, and test whether there is difference between them. Table 3 shows the mean and the median of B/P as well as the difference between B/P of bidders and targets.
As Table 3 shows, B/P of bidders is significantly lower than that of targets in all types of takeovers, which implies that bidders are valued higher than targets. I should note, however, that in the case of M&As using shares as a means of payment, B/P of targets are higher (at above 1 on average) than that of tender offers, meaning that targets are valued relatively lower with share takeovers than with cash takeovers. This is not consistent with the prediction of the misvaluation theory that a bidder is tempted to cash in when a target is undervalued. As I have described in Section 3, above described results are collectively rather consistent with the Q -theory than with the misvaluation theory.
As for V/P, Table 3 shows that there is no significant difference between V/P of bidders and targets. The exception is the test of median, but not of the mean, within
share takeover sample, where V/P of bidders is lower than that of targets. Since the test of the difference of median is not consistent with that of mean in this case, the result is weak. Tests of whether the mean of V/P is different from unity are insignificant with bidders and targets in all types of M&A, suggesting that I cannot observe the significant misvaluation of bidders or targets in any subset of the sample of takeovers.
4. 2. 2 Abnormal Return of Bidders and Targets around Takeover Announcement I further analyze the market reaction to an announcement of takeovers by employing a standard event study methodology. I define the abnormal return as the difference between tile return of an individual company and that of the market index (TOPIX), using the daily returns. ' The event date is the announcement date of an offer in the case of a tender offer, and an announcement dare of the exchange ratio in the case of share takeovers. I focus on the 3-day cumulative abnormal returns (CARS) between day-1 and day +1 in the following analyses. As I described in Section 1, Kang, Shivdasani, and Yamada (2000) and Inoue and Kato (2006) report the positive CARS around announcement date of mergers. I am the first to analyze the CARs of stock-to- stock acquisitions and tender offers, which barely occurred before 1999.
Table 4 summarizes the CARs of bidders and targets according to the types of M&A. Taking the whole sample, I see that the CARs of bidders in general are not negative, which is consistent with the findings of previous researches.
The more detailed analysis reveals new findings, particularly about the different share price reaction depending on the type of takeovers. The bidder CARs of share takeovers are generally higher than that of cash tender offers. 'Ibis is opposite to what the previous research in the US, such as Franks, Harris and Titman (1992), reports. In fact, the misvaluation theory suggests that a takeover using shares should lead to the negative share price reaction of bidders. Therefore, my result casts doubt about the validity of
misvaluation theory in Japan'.
As for the target CARS, they are all significantly positive in all types of M&A, but are largest at around 12 percent for cash tender offers. The target CARs for mergers are 6 We have checked with the mark
et model using TOPIX, but the results do not much because my event window is narrow.
' We report in the multi
variate analysis of Section 4.3 that the difference of bidder's becomes insignificant after controlling for other factors. My claim that there is doubt about the validity of misvaluation theory in Japan is still valid.
107
differ
CARs some
smallest at about 4 percent. Combining the results of bidder and target CARS, I infer that the wealth transfer from a bidder to a target is largest in the case of cash tender offers, while smallest for mergers. On interpretation of these results is that targets of tender
offers with relatively low B/P ratio have stronger negotiation power than targets of share deals with relatively high B/P ratio. My results suggest that the combined wealth increase of a bidder and a target front a takeover is significantly positive in all types of takeovers, but how a bidder and a target divide the gain from a takeover is different among the type of takeovers.
4. 2. 3 Comparison among Different Types of M&A
I have examined the difference between B/P, V/P and CARs depending on the type of M&A. I combine the above findings in Table 5 to examine whether there is any relationship between the above three measures.
Panel A of Table 5 shows the difference between cash tender offers and takeovers using shares as a means of payment (including stock-to-stock acquisitions and mergers).
As I can see, B/P of both bidders and targets of tender offers is significantly lower than that of share takeovers. This implies that a tender offer occurs between a highly valued bidder and a highly valued target, while a share takeover takes place between a lower valuation bidder and a lower valuation target. In the case of target companies, V/P is also significantly lower with tender offers, which implies the over valuation of target firms. As for CARS, the bidder CARS of cash tender offers are significantly smaller (by 1.5 percent) than those of share takeovers, while the target CARs of tender offers are significantly larger (by 6.2 percent) than those of share takeovers. My results imply that in tender offers, a larger proportion of gains from a takeover are transferred from a bidder to a target than in share takeovers, although low B/P of bidders suggests that they are well managed and have high potential for future growth. 'Ibis may be related to the fact that target B/P is also low. Since the target is also a company with high potential growth or good management, the target's management may be in a stronger position in the negotiation of a condition for a tender offer. It may also imply that a bidder is overpaying for a target (Roll (1986)).
Panel B of Table 5 reports the difference between mergers and stock-to-stock acquisitions. I see that B/P of bidders of mergers is significantly higher than that of stock-to-stock acquisitions. B/P of merger bidders is the highest among the three types of M&A, which implies that a merger is conducted by relatively low valuation bidder. 'Ibis implies that, in Japan, merger is a deal mode which is more frequently used by companies
facing with low growth opportunities in the same industries to survive the competition, since the merging companies can enjoy the equality of the two.
There is no significant difference between target's B/P of mergers and stock-to-stock acquisitions. As for CARs, the bidder CARs of mergers are significantly larger (by 2.2 percent) than those of stock-to-stock acquisitions. While the target CARs of mergers are smaller (by an offsetting 2.9 percent), the figure is only weakly significant. I can infer that the wealth transfer from a bidder to a target is smaller with mergers than with stock- to-stock acquisitions. This is consistent with the emphasis of equality of the merging firms in Japan.
4. 3 Multivariate Analyses
The above univariate analyses have already provided implications about the characteristics of bidders and targets according to the type of takeovers. In this subsection, I will conduct multivariate analyses and investigate how the management chooses between different types of takeovers, and how the market reacts to a takeover announcement.
4. 3. 1 Logit Analysis of Choice of Means of Payment
From the previous analysis, it has been suggested that the Japanese takeovers are more in line with the Q-Theory than with the misvaluation theory. Here, I employ multivariate analyses to examine the choice among different types of M&A. I include possible explanatory such as the relative size (market capitalization) of a target to a bidder, and a toehold, or percentage of target shares owned by a bidder before an announcement.
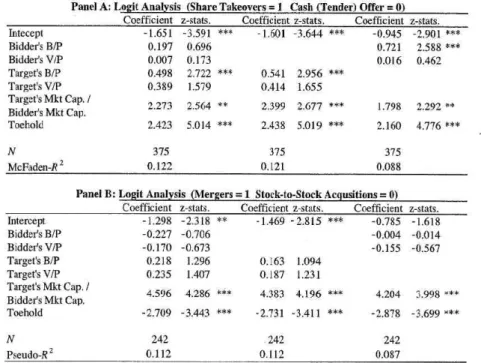
I employ logit analyses for the choice of payment method, i.e, shares or cash, and the choice of stock-to-stock acquisitions and mergers within the sub-sample of share takeovers. The results are reported in Panels A and B of Table 6, respectively.
From Panel A of Table 6, I find that the share takeovers are more likely to be chosen when (1) target's B/P is higher, (2) the target's market cap is larger relative to that of an acquirer, (3) toehold is larger, and (4) bidder's B/P is higher. The last result is only significant when target's B/P is excluded from a regression (one in the last column), so that it may simply reflect the first finding. As I found in univariate analyses, it is confirmed that a takeover using shares are likely to occur when a target and a bidder are poorly valued, while cash offers are more likely when they are highly valued on B/P basis.
I also know that when a target is relatively large compared with a bidder, share takeovers are more likely. This is understandable because using bidder's own shares as a means of
109
payment is particularly valuable when a size of the takeover is large. As for the toehold, I see that if a bidder already owns larger percentage of shares of a target, share takeover is more likely to occur. This is mainly caused by stock-to-stock acquisitions whose objective is mainly to transform a partially owned subsidiary to a fully owned one.
From Panel B of Tanle 6, I find that neither B/P nor V/P of a bidder or a target affects the choice between a merger and a stock-to-stock acquisition, suggesting that the valuation is not an issue with the choice. Within the sub-sample of share takeovers, a merger tends to occur when a target is larger relatively to a bidder, and a stock-to-stock acquisition is more likely to be chosen when a bidder already owns large stakes in a bidder.
I underscore the finding from my logic analysis that the cash offers are more likely to be used when a bidder and a target are highly valued. This means that a tender offer is chosen by a company that has high valuation and good investment opportunities.
Together with the fact that V/P is insignificant in all regressions, my finding confirms the followings, I do not see an evidence that the Japanese management is motivated by the misvaluation to choose shares as a method of payment of a takeover. It is possible, however, that not only a bidder's but also a target's higher valuation may imply that the target's management prefers to receive cash because their shares are overvalued. I will analyze the market reaction to a takeover announcement (the CARS) and whether the market reacts negatively suspecting such possibility.
4. 3.2 Analysis of Premium and CARS
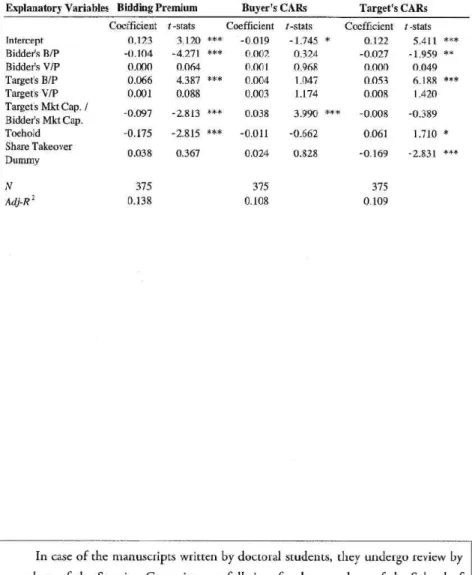
Table 7 reports the results of two-stage least squares (TSLS) regressions, where dependent variables are the bidding premium, the bidder's CARs and the target's CARs.
Since I use a share takeover dummy as an explanatory variable, which I have already shown to be correlated with other explanatory variables, such as a bidder's B/P and a target's B/P, I employ the TSLS to cope with the endogeneiry.
From the first column of Table 7, I see that the bidding premium becomes (1) smaller when the bidder's B/P is higher, (2) larger when the target's B/P is higher, (3) smaller when the target's market cap is larger relative to that of an acquirer, and (4) smaller when the toehold is larger. The findings imply that the bidding premium is largest when the bidder's valuation is high and the target's valuation is low. The fact that the highly valued bidder pays larger premium to the poorly valued target is consistent with the Q -theory (because the bidder's management is relatively good and the room for the improvement of the target is larger), and the misvaluation theory.(because the
overvalued acquirer is generous about paying premium to the poorly valued target) Therefore, how the bidder's share price reacts to an announcement of a takeover must be examined to judge which of the two theories aree more applicable.
The third and the fourth findings are intuitively understandable. When a target is large relative to a bidder, the bidding premium is expected to be smaller in percentage terms (which is how the dependent variable is calculated) even if the actual amount that is paid as the premium may he large. As for the toehold, the result implies that if a bidder already owns target's shares, you tend to be in a better position to negotiate with the target to accept lower premium. Interestingly, a share takeover dummy does not have an impact on the size of the bidding premium. After controlling for factors affecting the choice of a means of payment, I see no significant difference of bidding premium between cash tender offers and share takeovers.
The second and the third columns of Table 7 provide an analysis of bidder's and target's share price reaction (CARs), respectively. I find that bidder's CARs are only affected by the ratio of market cap of a target to a bidder. When the ratio is high, or when a target is relatively large compared with an acquirer, bidder's CAR tend to be more positive. None of other variables explain bidder's CARs including the share takeover dummy. This is not consistent with the misvaluation theory because the market does not
react negatively to the fact that the management chooses share takeover instead of cash tender offer. 'Ihe fact chat the ratio of market cap of a target to a bidder is significant may be consistent with the Q -theory because the market interprets the ratio as the signal of how confident the target is about its skills or investment opportunities, and is willing to take more risk to acquire a larger target.
As for target's CARs, they are larger when bidder's valuation is high (B/P is low), and targets valuation is low (B/P is high). This is exactly what the Q-theory predicts.
The wealth improvement of target's shareholders is largest when a bidder is well-managed and highly valued, and a target is poorly valued. I should be careful, however, that the result could be affected by the result from the first column regression that the higher bidding premium tends to be paid to a low-valuation target.
The regression of target's CARs also shows that a share takeover causes more negative reaction to target's share price. This is despite the fact from the first column regression that the choice of a share takeover is not related to the level of the bidding premium. Although bidder's share price does not react negatively to a share takeover, target's shareholders may be nonetheless concerned that bidder's shares might be overpriced, just as target's shares are overpriced, so that they prefer to receive cash. Such
Ill
asymmetry of perception between shareholders of a bidder and a target is an interesting finding that needs further investigation in the future.
5. Summary of Results and Conclusion
My analyses have found that in Japan, cash offers tend to occur when an acquirer and a target are highly valued on B/P basis, and when target's size in terms of market cap is larger relative to bidder's size. The bidding premium tends to be higher when a bidder's valuation is higher, when a target's valuation is lower, and when target's market cap is smaller relative to bidder's market cap. The choice of payment method (cash or stock) does not affect the bidding premium. Buyer's CARs are higher when target's market cap is larger relative to bidder's market cap. Target's CARs are higher when a bidder's valuation is higher, when a target's valuation is lower, and when cash is used to pay for a takeover.
My results are generally consistent with the prediction of Q -theory in the sense that a highly valued bidder (with good management ability or good investment opportunities) tends to pay higher premium using cash as a currency. The favorable reaction of target's shares to a takeover of a low-valuation target by a high-valuation acquirer is also
consistent with the Q-theory. On the contrary, I hardly see evidence supporting the misvaluation theory. V/P is insignificant in all analyses, suggesting that misvaluation is not an issue in Japan. Besides, the higher valuation of a bidder does not increase the probability of a share takeover, which is also inconsistent with the misvaluation theory.
I suspect that the Japanese management has so far conducted a takeover based on managerial and strategic objectives. The overvaluation of company's shares does not seem to be a reason for launching a takeover, nor does the overvaluation affects the choice of payment method. My results are also consistent with the finding of Kang et al. (2000) and others who report that that on average a takeover announcement in Japan results positive share price reaction of both a bidder and a target.
Acknowledgements
I am grateful for valuable suggestions and guidance to an anonymous reviewer, Masao Tsuji, a professor of Graduate School of Commerce, Waseda University, Kotaro Inoue, an associate professor of Kelo Business School and Kazunori Suzuki, a professor of Chuo Graduate School of Accounting.
References
Amihud, Y., B. Lev, and N. G. Travlos (1990), "Corporate control and the choice of investment financing: The case of corporate acquisitions," Journal of Finance 45(2), 603-616.
Andrade, G., M. Mitchell, and E. Stafford (2001), "Nelvidence and perspectives on mergers," Journal off conomic Perspectives 15(2), 103-120.
Brainard, W.C. and J. Tobin (1968), "Pitfalls in financial model building," American Economics Review- Papers and Proceedings 58, 99-122.
D'Mello, R. and P. K. Shroff (2000), 'Equity undervaluation and decisions related to repurchase tender offers: An empirical investigation'. Journal of Finance 55, 3399-2424
Dong,M., D.Hirshleifer, S.Richardson, and S.H.Teoh (2006), "Does investor misevaluation drive the takeover market?"Journal of Finance LXI(2), 725-762.
Franks,J.R., R.S.Harris, and S. Pitman , "The postmerger share-price performance of acquiring firms,"Journal ofFinancial Economics 29(1), 1991, 81-96.
Frankel, R., and M.C.Lee,C.,"Accounting Valuation, Market Expectation and Cross- SectionalStock Return," The Journal ofAccounting and Economics 25, 283-319.
Hasbrouck, J. (1985), "The characteristic of takeover targets. Q and other measures,"
Journal ofBankingand Finance 9(3), 351-362.
Inoue, K. and H. K. Karo, (2006), "M&A-ro Kabuka (M&A and Share Prices)," Toyo Keizai, Inc.
Jensen, M., and R. Ruback, (1983), "The market for corporate control: The scientific evidence,"Journal of Financial Economics 11, 5-50.
Kang, J., Shivdasani, A., Yamada, T., (2000), "The effect of bank relations on investment 113
decisions: an investigation of Japanese takeover bids," Journal of Finance 55, 2197-2218.
Lang, L.H.P, RStulz, and R.A.Walkling (1989), "Managerial performance, Tobin's q, and the gain from successful takeovers,"Jounal of Financial Economics 24(1), 137-154.
Lee,C., Myers,J., and Swaminarhan,B., (1999), "What is the Intrinsic Value of the Dow?,"Journal of Finance 54, 1693-1741.
Ohlson, J. A. and B. Juettner-Nauroth (2005), `Expected EPS and EPS growth as determinants of value'. Review ofAccounring Studies 10(2-3), 349-365
Roll, R. (1986), "The hubris theory of corporate takeovers," Journal ofBusiness 59(2), 197-216.
Servaes, H. (1991), "TOBin's Q and the gain from takeovers," Journal of Finance 46(1), 409-419.
Shleifer, A. and R.W. Vishny (2003), "Stock market driven acquisitions," Journal of Financial Economics 70, 295-311
Table 1: Descriptive Statistics
This table shows the mean (first row) and the median (second row) of the bidding premium, the toehold, FIF and VIP of bidders and targets, as well as the ratio of target's market cap to bidder's market cap and the cash holdings net of cash of bidders and targets. ", and ' show the significance at 1%, 5%, and 10% level, respectively.
Types of M&A N Bidding Prermnm Toehold
Bidder's B/P
Bidders VIP
Target's A/P
Targets VIP
Targets hike Cap. /
Bidde?r Bidders Cash Nor
Targt&'s Cast Net hike can. of Debt of Dent
Tender Offers 191. 0.00.11 0 111 0.629 It 940 0.970 0934 0.144 11.145 0.094
0.100- U91 0551 0791 0x56 0746 0062 -0.153 -0.092
Share Takeovers 949 00521** 0364 a 820 tIIn 1 131 1.197 0259 -0.I Re -0963
0.0661-1 0404 0689 0711 1094 0848 0 ton -0IRO -0.158
Stock-reSlock 166 /1050 0469 0965 1.199 1294 1 1163 0.118 11.216 -0.149
Acgrsilions 0076-1 0505 11618 0731 1 012 0.769 0054 -0204 -0.152
Mergers 76 0056+ 0.148 0939 0911 1411 1 459 0.565 L 090 1/208
0n44eC 000 /1A 16 0711 1316 11156 0198 -0.091 -0.197
Total 377 0 Mir*0 o s25 0951 1 047 1.202 1 061 /1218 11367 A140
0791- 0.344 6621 6 734 0997 11 R0n 0 081 0.170 -0.136
Table 2: Number of Takeovers by Type and Year
This table shows the number of takeovers classified by type of transaction average B/P of bidders and targets in each subgroup,
SubwtalTender Offers Sock--to-Stock Acquisitions Percent Bidder Target Percent Bidder Target
Year I N N .,,,Total B/P B/P N over Total B/P B/P
Percent Bidder Target
Year N N over Total B/P B/P
20(30 24 1 125% 6620 096
2001 14 5 35.7% Il 6117 0921
2(102 38 9 247% 1.278 1369
2003 is 7 184% 1055 2.384
2004 58 19 32.8% 0.551 0963
2005 62 21 37.1% 0.445 0736
2006 64 26 40.6% 0.524 0957
2(107 79 41 54.4% 0622 0.874
Total 377 135 158%: 0.629 0970
6 3 17 28 27 25 29 31 166
25.0%
21.4%
44.7%
73,7%
46.6%
40.3%
45.3%
39.2%
44.0%
0.662 2.134 1.361 1.811 1.252 2,818 0.876 1.509 0.734 1,096 0.587 0.906 Ob07 0,935 0.679 0.821 0.765 1 294
and by year. It also reports the
Mergers Percent Bidder Target
N over Pouf B/P B/P
15 6 12 3 12 14 9 5 76
62.5%
429%
316%
7.9%
20.7%
22.6%
14.1%
6.3%
20.2%
1.034 1.257 1,295 0.937 1.019 0.716 0.422 0.790 0.939
1.832 1.668 1.430 1.901 1.052 1.368 1,043 1.467 432
115
Table 3: B/P and VIP Ratios of Bidders and Targets
This table shows the mean (first row) and the median (second row) of B/P and V/P of bidders and targets depending on the type of M&A. and " show the significance of difference at 1%, 5%, and 10% level, respectively.
Tapes of M&A N Bidders B/P Targeh B/P Bidder§ B/P -Tareet§ B/P
Tender Offers 135 O AN 09711 -6.342*+*
0.557 O.853 -0240+w
Share Takeovers 242 0.820 1 331 -0 .511 ***
0.687 1.094 -02265**
Stock4oStoek 166 0765 1.284 -0 .519
Acgosltions 0.618 1.012 -0242e**
Mergers 76 0.939 1 A32 -0493***
0.816. 1.336 -0 .159**+
Total 377 0751 1.202 -0450***
0.621 0.987 -0.236**"
_13 Biddere V/P Target9 V/P HiddaS V/P T." V/P
11.940 11796
1.10-) 0731
1.197 0.731
0.911 0.731
1.047 0.734
0.834 0.746
1.187 0x49
1.063 0769
1.459 056
1.061 0x00
0106 0049 -0 .080 -0 -115**-
0.134 -0 .109^
-0 .548 -0 .178^
-0 .014 -0.062*
Table 4: CARs of Bidders and Targets
The table shows the mean CARS and the corresponding t-statistics in the second row. It also shows the number of sample where the CARs are positive or the difference of CARS is positive, which I use for a sign test.
and "show the significance at 1%, 5%, and 10% level, respectively.
Bidder Target
Types of M&A N CAR (fslats )
# of Posidve CARS
CAR (t Oats )
# of Positive CARS
Target,, CAR -Bidders CAR
# of Positive CAR Differences
Tender Offers 135 0.20% 68 1212%*** 1 I R*r* 11.92%*** 108***
(0.39) (12.46) (10.55)
Share Takeovers 242 1.71 %** 144xx 5 95%*** 1748*# 420%**x 165xxx
(4.46) (7.31) (5.03)
Smck4oStock 166 1.03%** R9 687%*** 12058 5 63%*** 118*w
Aequsitions (2.48) (6.53) (6.53)
Mergers 76 3.20%*** 55*** 54*** 0.71 % 4788
(4.04) (3.35) (0.53)
Total 377 1.17%*** 212** R. 15%*** 292*** 6.97%*** 273**'
(3.80) (12.63) (9.99)
Table 5: Comparison among Different Types of M&A
This table summarizes the difference of the mean of B/P, V/P and CARs between different types of M&A. Panel A compares tender offers with share takeovers (stock-to-stock acquisitions plus mergers). Panel B compares mergers and stock-to-stock acquisitions within the sub-sample of share takeovers- ' and ' show the significance of difference at 1%, 5%, and 10% level, respectively.
Ridder Target
Panel A Tender Offer va.
Share Takeover
Tender Offer
Share
Takeover Difference 1alsts
Tender Offer
Share
Take Difference tstale
R/P 0.629
VIP 0940
DAM
1.107 0.191
-0 .167
3370 *°*
-0 .689
RIP 0970
VIP 0834
1.331
1187 0360 -e35 a.
-3456 see
-2265 **
CAR 0002 0017 -0015 -2 .365 ** CAR 0.121 0.1159 0062 4724 see
Bidder Target
Panel B Merger Stock-le-Sleek
Merger Stock-to-
Stnck Difference r-stab Merger Stuck-to-
Stock Difference rear,
B/P 0939
VIP 0911
0765
1.197 (1174
-028fi
2.270 .*
-0.755 B/P
VIP 432
1459 1 284
1 063 0 148
0,396 1 015
1.647 *
CAR 0032 spin 0022 2 635 ** CAR 0.039 0068 -0029 -1 fi70 *
Table 6: Choice Among Different Types of M&A
This table shows the results of the logic regression analyses for the choice among different types of M&A. Panel A shows the results from logit regressions where the dependent variable is 1 for share takeovers and 0 for cash tender offers, and Panel B shows the results from logit regressions where the dependent variable is 1 for mergers and 0 for stock-to-stock acquisitions. and' show the significance of difference at 1%, 5%, and 10% level, respectively.
Panel A: Lei it Analysis (Share Takeovers=l Cash Tender) Offer =0) Coe fficient slats. Coefficient z-stars. Coefficient a-slaw.
Inleeep1 Bidder's BIT
Bidder's V/P Target's B/P Target's VIP Target's Mkt Cap.) Bidder's Idiot Cap.
Toehold
-1 .651 0.197 0.007 0498 0.389 2.273 2.423
-3 .591 0.696 0.173 2.722 1579 2.564 **
5014
-1,601
0.541 (1.414 2.399 2418
-3 .644
2.956 1.655 2.677 5.019
-0.945 0.721 0.016
1.798 2160
-2 .901 2.588 0.462
*4*
2.292 **
4 776
N McFaden-R2
375 0.122
375 0.121
375 0.088 Panel B: L it Analysis (Met era =1 Stock-to-Stock Ac usitions = o)
Coefficient z-stats. Coefficient z-stats. Coefficient z-stats.
Intercept Bidders B/P Bidders V/P Targets B/P Target's VIP Target's Mice ap. / Bidder's Mkt Cap.
Toehold
-1 .298 -0.227 -0.170 0.218 0.235 4.596 -2 .709
-2 .318 **
-0 .706 -0.673
1.296 1.407 4.286 -3 .443
-1 .469
0.163 0.197 4.383 -2 .731
-2 .8I5
1.094 1.231 4.196 -3.411
-0 .785 -0 .004 -0 .155
4.204 -2 .878
-1 .618 -0 .014 -0 .567
3.998 -3 .699
N Pseudo-H2
242 0.112
242 0.112
242 00R7
117
Table 7: Multivariate Analyses of Bidding Premium and CARs
This table shows the results for the TSLS regressions of bidding premium, buyers CARs and target's CARS. The CARs are 3-day (day -1-+1) cumulative abnormal returns based on a fixed return model. and * show the significance of difference at 1 %, 5%, and 10% level, respectively.
Explanatory Variables Bidding Premium Bayer's CARs Target's CARs Intercept
Bidder's B/P Bidder's V/P Target's B/P Target's V/P Target's Mist Cap. / Bidders Mkt Cap.
Toehold Share Takeover Dummy N Adj-R 2
Coefficient 0.123 -0 .104 0.000 0.066 0.001 -0 .097 -0 .175 0.038
375 0.138
/-state 3.120 ***
-4 .271 "**
0.064 4.387 ***
0.088 -2 .813 ***
-2.815 ***
0367
Coefficient -0 .019 0.002 0.001 0.004 0.003 0.038 -0.011 0.024
375 0.108
t-stats -1 .745 0.324 0.968 1.047 1.174 3.990 -0 .662 0.82R
Coefficient 0.122 -0.027 0.000 0.053 0.008 -0.008 0.061 -0 .169
375 0.109
1 -etats 5.411 -1.959 0.049 6.188 1.420 -0.389 1.710 -2 .831
*#*
*
In case of the manuscripts written by doctoral students, they undergo review by members of the Steering Committee or full-time faculty members of the School of Commerce. Such members must be appointed by the Dean of Graduate School of Commerce.
Editorial Board of WB&ES